Upgrade to Pro
— share decks privately, control downloads, hide ads and more …
Speaker Deck
Features
Speaker Deck
PRO
Sign in
Sign up for free
Search
Search
plotlyで動くグラフを作る
Search
takuma koshiishi
January 21, 2023
Technology
1.3k
0
Share
Embed
Copy iframe code
Copy JS code
Copy link
Start on current slide
plotlyで動くグラフを作る
takuma koshiishi
January 21, 2023
More Decks by takuma koshiishi
See All by takuma koshiishi
R package for a team
kosshi
2
2.5k
Other Decks in Technology
See All in Technology
AI Coding Agent時代のcdk-nagガードレール 〜組織ルールを強制CIで守り抜く設計の挑戦〜
mhrtech
3
460
OPENLOGI Company Profile for engineer
hr01
1
74k
壊して学ぶAWS CDK: そのcdk deployで消えるもの、残るもの
k_adachi_01
1
440
AIレビューはどこまで任せられるのか?自動化と人が背負うレビューの境界
sansantech
PRO
3
1.2k
SREとQA 二人三脚で進めるSLO運用/sre-qa-slo
sugitak
0
1.1k
AI時代におけるエンジニアの新たな役割──FDEとクオリアの探求/登壇資料(戸井田 裕貴)
hacobu
PRO
0
140
41歳でAWSが好きすぎてITエンジニアになったおっさんの話
yama3133
1
650
Type-safe IaC for Dart
coborinai
0
170
2年前に削除したPHPクラスが、 ある日突然決済をエラーにした
ykagano
1
630
キャリアLT会#3
beli68
0
170
設計レビューとAIハーネスで向き合う AIが生み出した新しいボトルネックの対処法 / Design Reviews and AI Harnesses Against New Bottlenecks Created by AI
nstock
1
230
実践!既存 Project への AI-Driven Development 適用〜 一ヶ月で Project 唯一のフロントエンドエンジニアを作り出せ〜
lycorptech_jp
PRO
0
360
Featured
See All Featured
GitHub's CSS Performance
jonrohan
1033
470k
No one is an island. Learnings from fostering a developers community.
thoeni
21
3.8k
Building an army of robots
kneath
306
46k
Odyssey Design
rkendrick25
PRO
2
730
How STYLIGHT went responsive
nonsquared
100
6.2k
[RailsConf 2023 Opening Keynote] The Magic of Rails
eileencodes
31
10k
The Mindset for Success: Future Career Progression
greggifford
PRO
0
430
Docker and Python
trallard
47
4k
The Power of CSS Pseudo Elements
geoffreycrofte
82
6.4k
The SEO identity crisis: Don't let AI make you average
varn
0
520
Claude Code のすすめ
schroneko
67
230k
Applied NLP in the Age of Generative AI
inesmontani
PRO
4
2.4k
Transcript
plotlyで 動くグラフを作る Takuma Koshiishi @kotaku08 Tokyo.R #103 2023/1/21
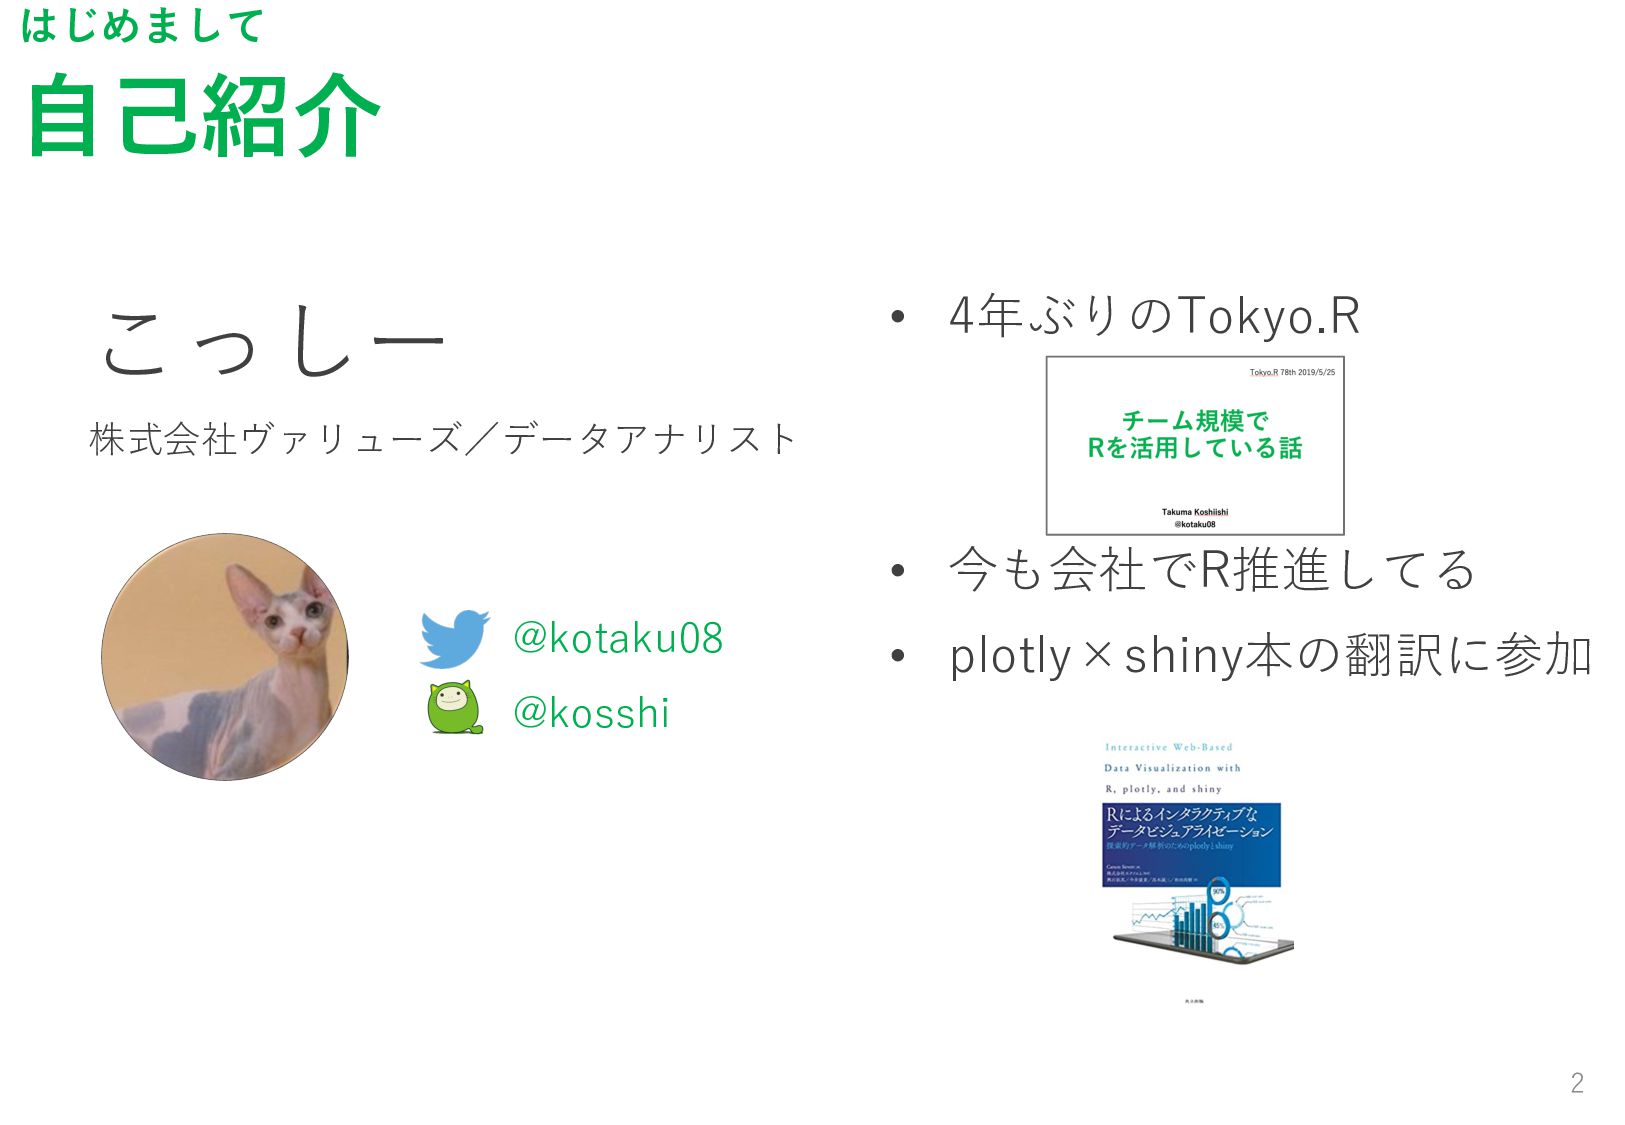
⾃⼰紹介 2 はじめまして こっしー 株式会社ヴァリューズ/データアナリスト @kotaku08 @kosshi • 4年ぶりのTokyo.R •
今も会社でR推進してる • plotly×shiny本の翻訳に参加
今⽇の⽬的 3 plotly触ってみようかな!と思ってもらう
Plotly 4 • ⼤元はJavascriptのデータ可視化ライブラリ(plotly.js) • インタラクティブに操作可能なぐるぐる動くグラフが描画で きる • Rのploltyパッケージなど、他⾔語から利⽤するクライアント が⽤意されている
← 今⽇plotlyと⾔ったらこのRパッケージ • データアナリストにとっては探索的データ分析とコミュニ ケーション(ダッシュボード作成など)に有益
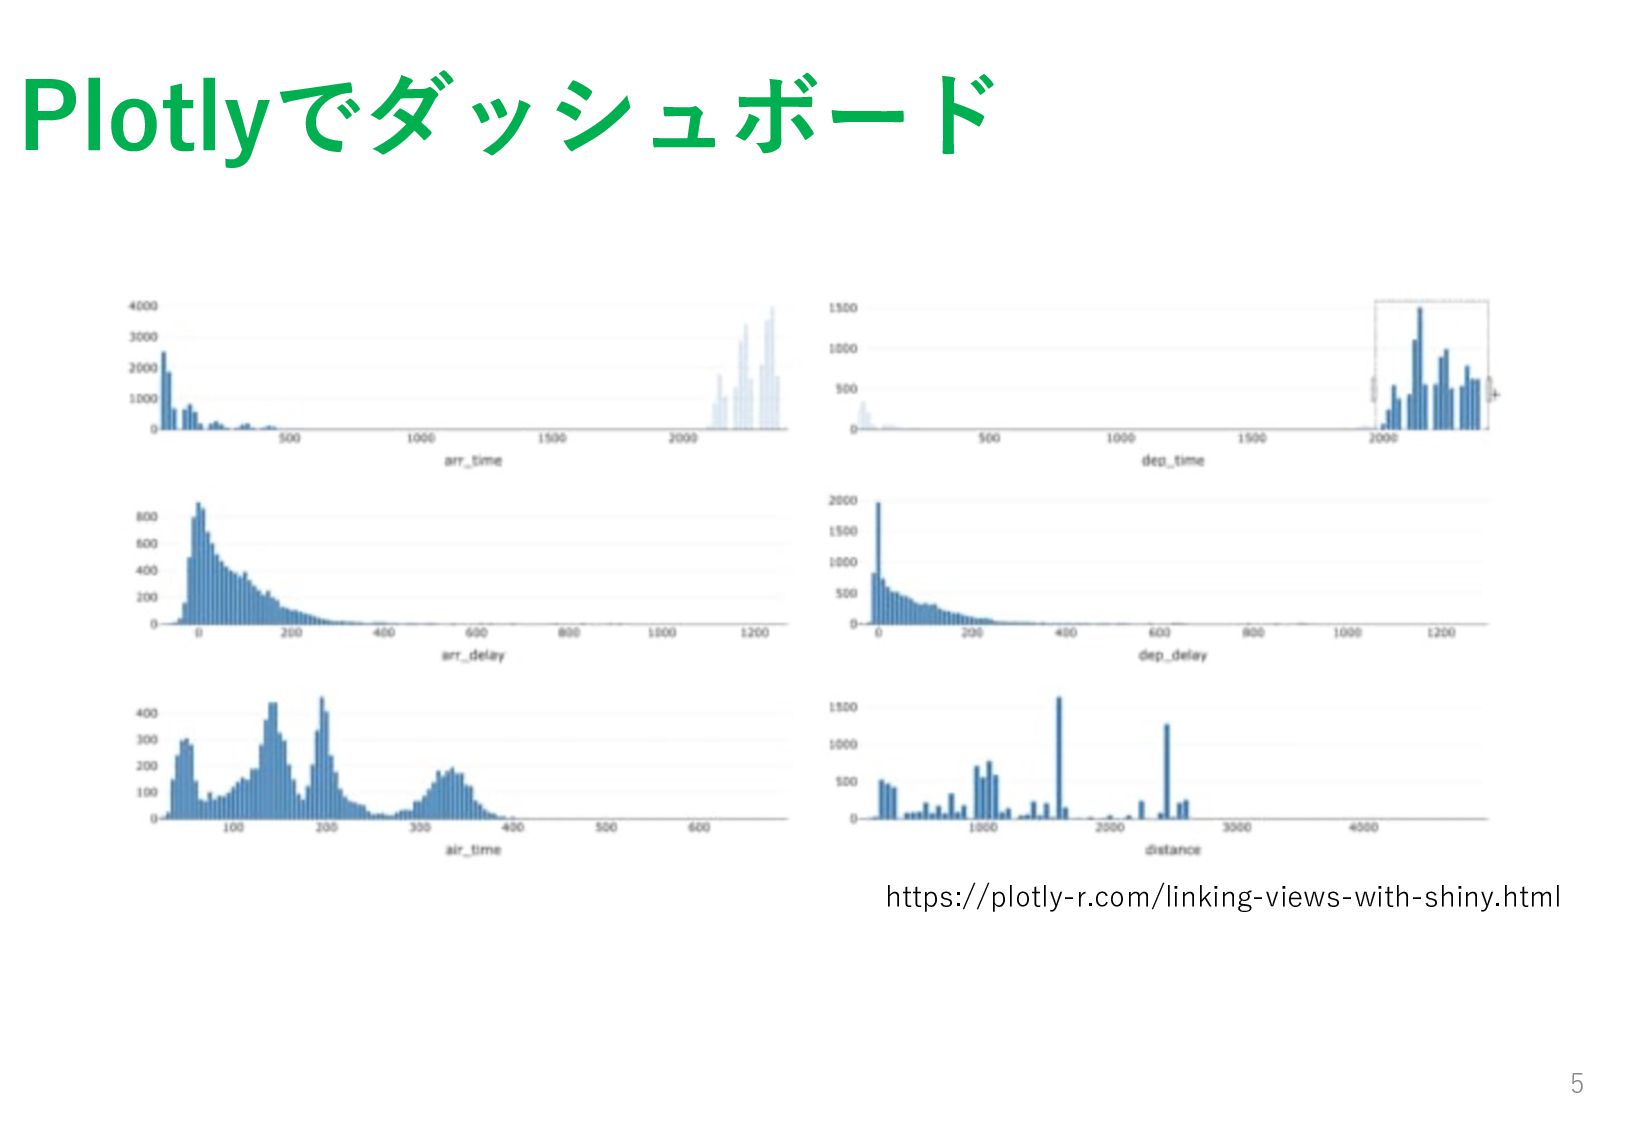
Plotlyでダッシュボード 5 https://plotly-r.com/linking-views-with-shiny.html
ここを推したいPlotly 6 • とにかく動く!楽しい • 多様な出⼒形式。HTML、SVG、PDFなどで保存可能。 Rmarkdown、shinyとも連携できる。 • ggplot2と連携できて、初めの⼀歩の敷居が低い。今⽇か ら使える!
2つのグラフの描画⽅法① 7 ①ggplot2を利⽤して描画 ◦ggplot2のグラフをggplotly()に渡すだけ で簡単! ◦複雑なことでもggplot2とその拡張パッ ケージに任せられるのが嬉しい! ×対応してないgeomもある。
2つのグラフの描画⽅法② 8 ②plotlyの記法で描画 ◦plotlyパッケージ独⾃の書き⽅だが、 ggplot2の書き⽅が⼟台にあり、Rユーザに 優しい。 ◦インタラクティブな点のカスタマイズ性 に優れる。習熟するならこっち。
まとめ 9 • plotlyパッケージで動くグラフが作れるよ! • ggplot2と直接連携しているし、⽂法も似ているので ggplot2ユーザは簡単に始められるよ! • ⼀歩踏み出したらインタラクティブ性を極める旅に出かけ よう!(グラフ同⼠の連携やshinyアプリ作成など)
Enjoy! 10 仕事でR使いたい⼈募集しています! 興味がある⽅是⾮DMください!
参考⽂献 11 • 「Interactive web-based data visualization with R, plotly,
and shiny」https://plotly-r.com/index.html • 「Rによるインタラクティブなデータビジュアライゼー ション: 探索的データ解析のためのplotlyとshiny」