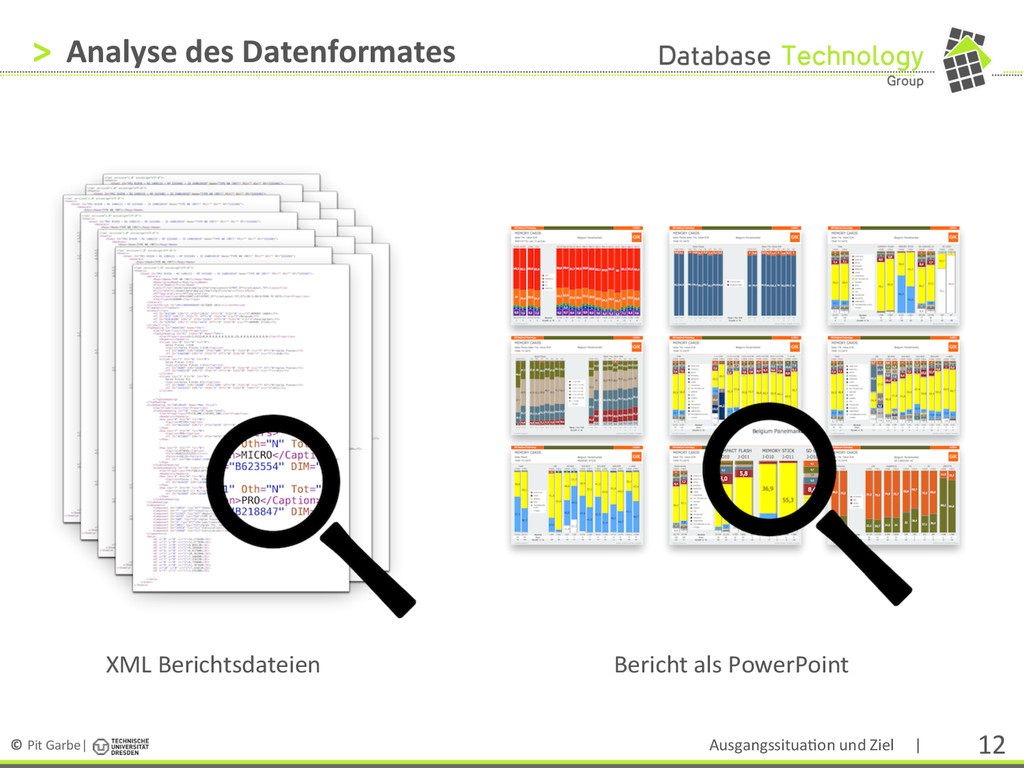
Datenformates AusgangssituaEon und Ziel <?xml version="1.0" encoding="UTF-8"?> <Sheets> <Sheet ID="PRJ 81939 - RG 1486115 - RP 5333481 - ID 240819919" Name="TYPE 00 (RR7)" PRJ="" RG="" RP="5333481"> <General> <ReportName>TYPE 00 (RR7)</ReportName> <ReportgroupName></ReportgroupName> <ProjectName></ProjectName> <LayoutFile>\\msdev\data\deploy\Charting\Layouts\GfKRT_OfficialLayout.TXT</LayoutFile> <PicturePath>\\msdev\data\deploy\Charting\Pictures\</PicturePath> <PPTTemplateFile></PPTTemplateFile> <ChartProperties>OPA=CHART;LAY=GfKRT_OfficialLayout.TXT;STL=3D-1;HDL3=YEAR TO DATE</ChartProperties> <ChartType>DIAGRAM</ChartType> </General> <CurrentPeriod ID="20111099999030">OCTOBER 2011</CurrentPeriod> <FrameSet></FrameSet> <GlobalFilter> <FI ID="B32308" DIM="1" CPID="19655" SPTY="0" TGID="0" Vis="Y">MEMORY CARDS</FI> <FI ID="B13" DIM="2" CPID="7" SPTY="0" TGID="0" Vis="Y">Belgium</FI> <FI ID="B1010280" DIM="2" CPID="22292" SPTY="0" TGID="0" Vis="Y">Panelmarket</FI> <FI ID="G29764" DIM="1" CPID="4479" SPTY="0" TGID="0" Vis="Y">MEMORY STICK</FI> </GlobalFilter> <TopHeading ID="39645185" Name="TH1"> <ChartProperties></ChartProperties> <TopSubHeading ID="61" Index="0" Name="TSH1"> <ChartProperties>LEG=1;DIS2=0,0,0.8,0,0,0,0,0,0,LEG,0,0.8,0,0,0,0,0,0</ChartProperties> <Headers></Headers> <Column Idx="0" Oth="N" Tot="N"> Sales Pieces J-O10 <Caption>Sales Pieces J-O10</Caption> <FI ID="B609" DIM="18380" CPID="609" SPTY="0" TGID="0" Vis="Y" NFT="0">Sales Pieces</FI> <FI ID="G402506" DIM="3" CPID="5" SPTY="0" TGID="0" TGOP="1" Vis="Y">J-O10</FI> </Column> <Column Idx="1" Oth="N" Tot="N"> Sales Pieces J-O11 <Caption>Sales Pieces J-O11</Caption> <FI ID="B609" DIM="18380" CPID="609" SPTY="0" TGID="0" Vis="Y" NFT="0">Sales Pieces</FI> <FI ID="G482270" DIM="3" CPID="5" SPTY="0" TGID="0" TGOP="1" Vis="Y">J-O11</FI> </Column> <Column Idx="2" Oth="N" Tot="N"> Sales Pieces A11 <Caption>Sales Pieces A11</Caption> <FI ID="B609" DIM="18380" CPID="609" SPTY="0" TGID="0" Vis="Y" NFT="0">Sales Pieces</FI> <FI ID="G425353" DIM="3" CPID="5" SPTY="0" TGID="0" TGOP="1" Vis="Y">A11</FI> </Column> . . </TopSubHeading> </TopHeading> <SideHeading ID="40130549" Name="Mem. Stick"> <ChartProperties></ChartProperties> <SideSubHeading ID="78" Index="0" Name="SSH3"> <ChartProperties>TYP=COLUMN_STACKED_100</ChartProperties> <Headers></Headers> <Row Idx="0" Oth="N" Tot="N"> <Caption>MICRO</Caption> <FI ID="B623554" DIM="1" CPID="4479" SPTY="0" TGID="0" Vis="Y">MICRO</FI> </Row> <Row Idx="1" Oth="N" Tot="N"> <Caption>PRO</Caption> <FI ID="B218847" DIM="1" CPID="4479" SPTY="0" TGID="0" Vis="Y">PRO</FI> </Row> . . <Row Idx="5" Oth="Y" Tot="N"> <Caption>OTHERS</Caption> <Color>RGB255255255</Color> <Pattern>SOLID</Pattern> <FI ID="!1477204!218847!218848!57779!623554" DIM="1" CPID="4479" SPTY="0" TGID="0" TGOP="0" Vis="Y">OTHERS</FI> </Row> </SideSubHeading> <SideSubHeading ID="79" Index="1" Name="SSH4(2)"> <ChartProperties>TYP=TABLE;NFT=#,###</ChartProperties> <Headers></Headers> <Row Idx="6" Oth="N" Tot="N"> <Caption>Pieces | Ths. EUR</Caption> <FI ID="B24458" DIM="18380" CPID="24458" SPTY="0" TGID="0" Vis="Y" NFT="0">Pieces | Ths. EUR</FI> </Row> <Row Idx="7" Oth="N" Tot="N"> <Caption>Growth +/- %</Caption> <FI ID="B24960" DIM="18380" CPID="24960" SPTY="0" TGID="0" Vis="Y" NFT="0.0">Growth +/- %</FI> </Row> </SideSubHeading> </SideHeading> <Components> <Component ID="19655" Typ="ATT">DomainProductgroup</Component> <Component ID="7" Typ="ATT">Country</Component> <Component ID="22292" Typ="ATT">ReportingChannel</Component> <Component ID="4479" Typ="FEA">TYPE OF CARD</Component> <Component ID="609" Typ="FIG">Sales Piece/Litre/Kilos</Component> <Component ID="5" Typ="ATT">Period</Component> <Component ID="3061" Typ="FIG">Sales Ths. Value EUR</Component> <Component ID="24458" Typ="CLC">Calculation</Component> <Component ID="24960" Typ="CLC">Calculation</Component> </Components> <Data> <DC x="0" y="0" st="1">14.175640</DC> <DC x="1" y="0" st="1">11.277030</DC> <DC x="2" y="0" st="1">9.069130</DC> <DC x="3" y="0" st="1">8.289860</DC> <DC x="4" y="0" st="1">6.837900</DC> <DC x="5" y="0" st="1">20.392860</DC> <DC x="6" y="0" st="1">7.560400</DC> <DC x="7" y="0" st="1">7.258330</DC> <DC x="8" y="0" st="1">6.759000</DC> <DC x="9" y="0" st="1">11.187840</DC> <DC x="10" y="0" st="1">7.434610</DC> <DC x="1" y="1" st="1">1.255300</DC> . . </Data> </Sheet> </Sheets> <?xml version="1.0" encoding="UTF-8"?> <Sheets> <Sheet ID="PRJ 81939 - RG 1486115 - RP 5333481 - ID 240819919" Name="TYPE 00 (RR7)" PRJ="" RG="" RP="5333481"> <General> <ReportName>TYPE 00 (RR7)</ReportName> <ReportgroupName></ReportgroupName> <ProjectName></ProjectName> <LayoutFile>\\msdev\data\deploy\Charting\Layouts\GfKRT_OfficialLayout.TXT</LayoutFile> <PicturePath>\\msdev\data\deploy\Charting\Pictures\</PicturePath> <PPTTemplateFile></PPTTemplateFile> <ChartProperties>OPA=CHART;LAY=GfKRT_OfficialLayout.TXT;STL=3D-1;HDL3=YEAR TO DATE</ChartProperties> <ChartType>DIAGRAM</ChartType> </General> <CurrentPeriod ID="20111099999030">OCTOBER 2011</CurrentPeriod> <FrameSet></FrameSet> <GlobalFilter> <FI ID="B32308" DIM="1" CPID="19655" SPTY="0" TGID="0" Vis="Y">MEMORY CARDS</FI> <FI ID="B13" DIM="2" CPID="7" SPTY="0" TGID="0" Vis="Y">Belgium</FI> <FI ID="B1010280" DIM="2" CPID="22292" SPTY="0" TGID="0" Vis="Y">Panelmarket</FI> <FI ID="G29764" DIM="1" CPID="4479" SPTY="0" TGID="0" Vis="Y">MEMORY STICK</FI> </GlobalFilter> <TopHeading ID="39645185" Name="TH1"> <ChartProperties></ChartProperties> <TopSubHeading ID="61" Index="0" Name="TSH1"> <ChartProperties>LEG=1;DIS2=0,0,0.8,0,0,0,0,0,0,LEG,0,0.8,0,0,0,0,0,0</ChartProperties> <Headers></Headers> <Column Idx="0" Oth="N" Tot="N"> Sales Pieces J-O10 <Caption>Sales Pieces J-O10</Caption> <FI ID="B609" DIM="18380" CPID="609" SPTY="0" TGID="0" Vis="Y" NFT="0">Sales Pieces</FI> <FI ID="G402506" DIM="3" CPID="5" SPTY="0" TGID="0" TGOP="1" Vis="Y">J-O10</FI> </Column> <Column Idx="1" Oth="N" Tot="N"> Sales Pieces J-O11 <Caption>Sales Pieces J-O11</Caption> <FI ID="B609" DIM="18380" CPID="609" SPTY="0" TGID="0" Vis="Y" NFT="0">Sales Pieces</FI> <FI ID="G482270" DIM="3" CPID="5" SPTY="0" TGID="0" TGOP="1" Vis="Y">J-O11</FI> </Column> <Column Idx="2" Oth="N" Tot="N"> Sales Pieces A11 <Caption>Sales Pieces A11</Caption> <FI ID="B609" DIM="18380" CPID="609" SPTY="0" TGID="0" Vis="Y" NFT="0">Sales Pieces</FI> <FI ID="G425353" DIM="3" CPID="5" SPTY="0" TGID="0" TGOP="1" Vis="Y">A11</FI> </Column> . . </TopSubHeading> </TopHeading> <SideHeading ID="40130549" Name="Mem. Stick"> <ChartProperties></ChartProperties> <SideSubHeading ID="78" Index="0" Name="SSH3"> <ChartProperties>TYP=COLUMN_STACKED_100</ChartProperties> <Headers></Headers> <Row Idx="0" Oth="N" Tot="N"> <Caption>MICRO</Caption> <FI ID="B623554" DIM="1" CPID="4479" SPTY="0" TGID="0" Vis="Y">MICRO</FI> </Row> <Row Idx="1" Oth="N" Tot="N"> <Caption>PRO</Caption> <FI ID="B218847" DIM="1" CPID="4479" SPTY="0" TGID="0" Vis="Y">PRO</FI> </Row> . . <Row Idx="5" Oth="Y" Tot="N"> <Caption>OTHERS</Caption> <Color>RGB255255255</Color> <Pattern>SOLID</Pattern> <FI ID="!1477204!218847!218848!57779!623554" DIM="1" CPID="4479" SPTY="0" TGID="0" TGOP="0" Vis="Y">OTHERS</FI> </Row> </SideSubHeading> <SideSubHeading ID="79" Index="1" Name="SSH4(2)"> <ChartProperties>TYP=TABLE;NFT=#,###</ChartProperties> <Headers></Headers> <Row Idx="6" Oth="N" Tot="N"> <Caption>Pieces | Ths. EUR</Caption> <FI ID="B24458" DIM="18380" CPID="24458" SPTY="0" TGID="0" Vis="Y" NFT="0">Pieces | Ths. EUR</FI> </Row> <Row Idx="7" Oth="N" Tot="N"> <Caption>Growth +/- %</Caption> <FI ID="B24960" DIM="18380" CPID="24960" SPTY="0" TGID="0" Vis="Y" NFT="0.0">Growth +/- %</FI> </Row> </SideSubHeading> </SideHeading> <Components> <Component ID="19655" Typ="ATT">DomainProductgroup</Component> <Component ID="7" Typ="ATT">Country</Component> <Component ID="22292" Typ="ATT">ReportingChannel</Component> <Component ID="4479" Typ="FEA">TYPE OF CARD</Component> <Component ID="609" Typ="FIG">Sales Piece/Litre/Kilos</Component> <Component ID="5" Typ="ATT">Period</Component> <Component ID="3061" Typ="FIG">Sales Ths. Value EUR</Component> <Component ID="24458" Typ="CLC">Calculation</Component> <Component ID="24960" Typ="CLC">Calculation</Component> </Components> <Data> <DC x="0" y="0" st="1">14.175640</DC> <DC x="1" y="0" st="1">11.277030</DC> <DC x="2" y="0" st="1">9.069130</DC> <DC x="3" y="0" st="1">8.289860</DC> <DC x="4" y="0" st="1">6.837900</DC> <DC x="5" y="0" st="1">20.392860</DC> <DC x="6" y="0" st="1">7.560400</DC> <DC x="7" y="0" st="1">7.258330</DC> <DC x="8" y="0" st="1">6.759000</DC> <DC x="9" y="0" st="1">11.187840</DC> <DC x="10" y="0" st="1">7.434610</DC> <DC x="1" y="1" st="1">1.255300</DC> . . </Data> </Sheet> </Sheets> <?xml version="1.0" encoding="UTF-8"?> <Sheets> <Sheet ID="PRJ 81939 - RG 1486115 - RP 5333481 - ID 240819919" Name="TYPE 00 (RR7)" PRJ="" RG="" RP="5333481"> <General> <ReportName>TYPE 00 (RR7)</ReportName> <ReportgroupName></ReportgroupName> <ProjectName></ProjectName> <LayoutFile>\\msdev\data\deploy\Charting\Layouts\GfKRT_OfficialLayout.TXT</LayoutFile> <PicturePath>\\msdev\data\deploy\Charting\Pictures\</PicturePath> <PPTTemplateFile></PPTTemplateFile> <ChartProperties>OPA=CHART;LAY=GfKRT_OfficialLayout.TXT;STL=3D-1;HDL3=YEAR TO DATE</ChartProperties> <ChartType>DIAGRAM</ChartType> </General> <CurrentPeriod ID="20111099999030">OCTOBER 2011</CurrentPeriod> <FrameSet></FrameSet> <GlobalFilter> <FI ID="B32308" DIM="1" CPID="19655" SPTY="0" TGID="0" Vis="Y">MEMORY CARDS</FI> <FI ID="B13" DIM="2" CPID="7" SPTY="0" TGID="0" Vis="Y">Belgium</FI> <FI ID="B1010280" DIM="2" CPID="22292" SPTY="0" TGID="0" Vis="Y">Panelmarket</FI> <FI ID="G29764" DIM="1" CPID="4479" SPTY="0" TGID="0" Vis="Y">MEMORY STICK</FI> </GlobalFilter> <TopHeading ID="39645185" Name="TH1"> <ChartProperties></ChartProperties> <TopSubHeading ID="61" Index="0" Name="TSH1"> <ChartProperties>LEG=1;DIS2=0,0,0.8,0,0,0,0,0,0,LEG,0,0.8,0,0,0,0,0,0</ChartProperties> <Headers></Headers> <Column Idx="0" Oth="N" Tot="N"> Sales Pieces J-O10 <Caption>Sales Pieces J-O10</Caption> <FI ID="B609" DIM="18380" CPID="609" SPTY="0" TGID="0" Vis="Y" NFT="0">Sales Pieces</FI> <FI ID="G402506" DIM="3" CPID="5" SPTY="0" TGID="0" TGOP="1" Vis="Y">J-O10</FI> </Column> <Column Idx="1" Oth="N" Tot="N"> Sales Pieces J-O11 <Caption>Sales Pieces J-O11</Caption> <FI ID="B609" DIM="18380" CPID="609" SPTY="0" TGID="0" Vis="Y" NFT="0">Sales Pieces</FI> <FI ID="G482270" DIM="3" CPID="5" SPTY="0" TGID="0" TGOP="1" Vis="Y">J-O11</FI> </Column> <Column Idx="2" Oth="N" Tot="N"> Sales Pieces A11 <Caption>Sales Pieces A11</Caption> <FI ID="B609" DIM="18380" CPID="609" SPTY="0" TGID="0" Vis="Y" NFT="0">Sales Pieces</FI> <FI ID="G425353" DIM="3" CPID="5" SPTY="0" TGID="0" TGOP="1" Vis="Y">A11</FI> </Column> . . </TopSubHeading> </TopHeading> <SideHeading ID="40130549" Name="Mem. Stick"> <ChartProperties></ChartProperties> <SideSubHeading ID="78" Index="0" Name="SSH3"> <ChartProperties>TYP=COLUMN_STACKED_100</ChartProperties> <Headers></Headers> <Row Idx="0" Oth="N" Tot="N"> <Caption>MICRO</Caption> <FI ID="B623554" DIM="1" CPID="4479" SPTY="0" TGID="0" Vis="Y">MICRO</FI> </Row> <Row Idx="1" Oth="N" Tot="N"> <Caption>PRO</Caption> <FI ID="B218847" DIM="1" CPID="4479" SPTY="0" TGID="0" Vis="Y">PRO</FI> </Row> . . <Row Idx="5" Oth="Y" Tot="N"> <Caption>OTHERS</Caption> <Color>RGB255255255</Color> <Pattern>SOLID</Pattern> <FI ID="!1477204!218847!218848!57779!623554" DIM="1" CPID="4479" SPTY="0" TGID="0" TGOP="0" Vis="Y">OTHERS</FI> </Row> </SideSubHeading> <SideSubHeading ID="79" Index="1" Name="SSH4(2)"> <ChartProperties>TYP=TABLE;NFT=#,###</ChartProperties> <Headers></Headers> <Row Idx="6" Oth="N" Tot="N"> <Caption>Pieces | Ths. EUR</Caption> <FI ID="B24458" DIM="18380" CPID="24458" SPTY="0" TGID="0" Vis="Y" NFT="0">Pieces | Ths. EUR</FI> </Row> <Row Idx="7" Oth="N" Tot="N"> <Caption>Growth +/- %</Caption> <FI ID="B24960" DIM="18380" CPID="24960" SPTY="0" TGID="0" Vis="Y" NFT="0.0">Growth +/- %</FI> </Row> </SideSubHeading> </SideHeading> <Components> <Component ID="19655" Typ="ATT">DomainProductgroup</Component> <Component ID="7" Typ="ATT">Country</Component> <Component ID="22292" Typ="ATT">ReportingChannel</Component> <Component ID="4479" Typ="FEA">TYPE OF CARD</Component> <Component ID="609" Typ="FIG">Sales Piece/Litre/Kilos</Component> <Component ID="5" Typ="ATT">Period</Component> <Component ID="3061" Typ="FIG">Sales Ths. Value EUR</Component> <Component ID="24458" Typ="CLC">Calculation</Component> <Component ID="24960" Typ="CLC">Calculation</Component> </Components> <Data> <DC x="0" y="0" st="1">14.175640</DC> <DC x="1" y="0" st="1">11.277030</DC> <DC x="2" y="0" st="1">9.069130</DC> <DC x="3" y="0" st="1">8.289860</DC> <DC x="4" y="0" st="1">6.837900</DC> <DC x="5" y="0" st="1">20.392860</DC> <DC x="6" y="0" st="1">7.560400</DC> <DC x="7" y="0" st="1">7.258330</DC> <DC x="8" y="0" st="1">6.759000</DC> <DC x="9" y="0" st="1">11.187840</DC> <DC x="10" y="0" st="1">7.434610</DC> <DC x="1" y="1" st="1">1.255300</DC> . . </Data> </Sheet> </Sheets> <?xml version="1.0" encoding="UTF-8"?> <Sheets> <Sheet ID="PRJ 81939 - RG 1486115 - RP 5333481 - ID 240819919" Name="TYPE 00 (RR7)" PRJ="" RG="" RP="5333481"> <General> <ReportName>TYPE 00 (RR7)</ReportName> <ReportgroupName></ReportgroupName> <ProjectName></ProjectName> <LayoutFile>\\msdev\data\deploy\Charting\Layouts\GfKRT_OfficialLayout.TXT</LayoutFile> <PicturePath>\\msdev\data\deploy\Charting\Pictures\</PicturePath> <PPTTemplateFile></PPTTemplateFile> <ChartProperties>OPA=CHART;LAY=GfKRT_OfficialLayout.TXT;STL=3D-1;HDL3=YEAR TO DATE</ChartProperties> <ChartType>DIAGRAM</ChartType> </General> <CurrentPeriod ID="20111099999030">OCTOBER 2011</CurrentPeriod> <FrameSet></FrameSet> <GlobalFilter> <FI ID="B32308" DIM="1" CPID="19655" SPTY="0" TGID="0" Vis="Y">MEMORY CARDS</FI> <FI ID="B13" DIM="2" CPID="7" SPTY="0" TGID="0" Vis="Y">Belgium</FI> <FI ID="B1010280" DIM="2" CPID="22292" SPTY="0" TGID="0" Vis="Y">Panelmarket</FI> <FI ID="G29764" DIM="1" CPID="4479" SPTY="0" TGID="0" Vis="Y">MEMORY STICK</FI> </GlobalFilter> <TopHeading ID="39645185" Name="TH1"> <ChartProperties></ChartProperties> <TopSubHeading ID="61" Index="0" Name="TSH1"> <ChartProperties>LEG=1;DIS2=0,0,0.8,0,0,0,0,0,0,LEG,0,0.8,0,0,0,0,0,0</ChartProperties> <Headers></Headers> <Column Idx="0" Oth="N" Tot="N"> Sales Pieces J-O10 <Caption>Sales Pieces J-O10</Caption> <FI ID="B609" DIM="18380" CPID="609" SPTY="0" TGID="0" Vis="Y" NFT="0">Sales Pieces</FI> <FI ID="G402506" DIM="3" CPID="5" SPTY="0" TGID="0" TGOP="1" Vis="Y">J-O10</FI> </Column> <Column Idx="1" Oth="N" Tot="N"> Sales Pieces J-O11 <Caption>Sales Pieces J-O11</Caption> <FI ID="B609" DIM="18380" CPID="609" SPTY="0" TGID="0" Vis="Y" NFT="0">Sales Pieces</FI> <FI ID="G482270" DIM="3" CPID="5" SPTY="0" TGID="0" TGOP="1" Vis="Y">J-O11</FI> </Column> <Column Idx="2" Oth="N" Tot="N"> Sales Pieces A11 <Caption>Sales Pieces A11</Caption> <FI ID="B609" DIM="18380" CPID="609" SPTY="0" TGID="0" Vis="Y" NFT="0">Sales Pieces</FI> <FI ID="G425353" DIM="3" CPID="5" SPTY="0" TGID="0" TGOP="1" Vis="Y">A11</FI> </Column> . . </TopSubHeading> </TopHeading> <SideHeading ID="40130549" Name="Mem. Stick"> <ChartProperties></ChartProperties> <SideSubHeading ID="78" Index="0" Name="SSH3"> <ChartProperties>TYP=COLUMN_STACKED_100</ChartProperties> <Headers></Headers> <Row Idx="0" Oth="N" Tot="N"> <Caption>MICRO</Caption> <FI ID="B623554" DIM="1" CPID="4479" SPTY="0" TGID="0" Vis="Y">MICRO</FI> </Row> <Row Idx="1" Oth="N" Tot="N"> <Caption>PRO</Caption> <FI ID="B218847" DIM="1" CPID="4479" SPTY="0" TGID="0" Vis="Y">PRO</FI> </Row> . . <Row Idx="5" Oth="Y" Tot="N"> <Caption>OTHERS</Caption> <Color>RGB255255255</Color> <Pattern>SOLID</Pattern> <FI ID="!1477204!218847!218848!57779!623554" DIM="1" CPID="4479" SPTY="0" TGID="0" TGOP="0" Vis="Y">OTHERS</FI> </Row> </SideSubHeading> <SideSubHeading ID="79" Index="1" Name="SSH4(2)"> <ChartProperties>TYP=TABLE;NFT=#,###</ChartProperties> <Headers></Headers> <Row Idx="6" Oth="N" Tot="N"> <Caption>Pieces | Ths. EUR</Caption> <FI ID="B24458" DIM="18380" CPID="24458" SPTY="0" TGID="0" Vis="Y" NFT="0">Pieces | Ths. EUR</FI> </Row> <Row Idx="7" Oth="N" Tot="N"> <Caption>Growth +/- %</Caption> <FI ID="B24960" DIM="18380" CPID="24960" SPTY="0" TGID="0" Vis="Y" NFT="0.0">Growth +/- %</FI> </Row> </SideSubHeading> </SideHeading> <Components> <Component ID="19655" Typ="ATT">DomainProductgroup</Component> <Component ID="7" Typ="ATT">Country</Component> <Component ID="22292" Typ="ATT">ReportingChannel</Component> <Component ID="4479" Typ="FEA">TYPE OF CARD</Component> <Component ID="609" Typ="FIG">Sales Piece/Litre/Kilos</Component> <Component ID="5" Typ="ATT">Period</Component> <Component ID="3061" Typ="FIG">Sales Ths. Value EUR</Component> <Component ID="24458" Typ="CLC">Calculation</Component> <Component ID="24960" Typ="CLC">Calculation</Component> </Components> <Data> <DC x="0" y="0" st="1">14.175640</DC> <DC x="1" y="0" st="1">11.277030</DC> <DC x="2" y="0" st="1">9.069130</DC> <DC x="3" y="0" st="1">8.289860</DC> <DC x="4" y="0" st="1">6.837900</DC> <DC x="5" y="0" st="1">20.392860</DC> <DC x="6" y="0" st="1">7.560400</DC> <DC x="7" y="0" st="1">7.258330</DC> <DC x="8" y="0" st="1">6.759000</DC> <DC x="9" y="0" st="1">11.187840</DC> <DC x="10" y="0" st="1">7.434610</DC> <DC x="1" y="1" st="1">1.255300</DC> . . </Data> </Sheet> </Sheets> GfK Retail and Technology 11/2011 MEMORY CARDS Sales Pieces,Sales Ths. Value EUR YEAR TO DATE Belgium Panelmarket © by GfK-RT, www.gfkrt.com PRJ 81939 - RG 1486115 - RP 5333481 - ID 241337309 J-O10 J-O11 A11 M11 J11 J11 A11 S11 O11 J-O10 J-O11 A11 M11 J11 J11 A11 S11 O11 Sales Pieces Sales Ths. Value EUR 1.301.673 1.242.214 107.767 142.101 128.938 189.440 111.323 98.304 107.354 23.537 22.931 2.017 2.628 2.410 3.534 2.026 1.798 1.967 -9 -5 -2 -3 -4 -10 -5 -8 4 -3 3 -1 -1 -4 -10 -5 -8 Pieces | Ths. EUR Pieces | Ths. EUR Growth +/- % Growth +/- % 11,3 4,1 3,1 25,6 55,9 9,1 3,8 2,9 29,3 55,1 9,6 3,9 2,9 28,6 55 7,9 3,1 2,4 28,5 58,2 7,6 3,2 2,4 33,1 53,7 7,2 2,3 29,2 59,2 9 3 3,8 30,4 53,8 10 4,2 3,2 29,6 53 9,2 3,6 3,1 29,2 54,8 9,1 3,4 3 23,9 60,5 7,3 2,9 2,8 24,7 62,4 7,6 2,8 3 23,5 63,1 6,3 2,3 2,3 24,3 64,9 6,2 2,3 28,2 61,2 5,3 24,7 66 7,1 3,6 25 62,1 8,5 3,7 3,2 23,5 61,2 7,6 2,5 2,9 23,9 63,1 CES MassMerch. CS SH OER/TCR GfK Retail and Technology 11/2011 MEMORY CARDS Sales Pieces YEAR TO DATE Belgium Panelmarket © by GfK-RT, www.gfkrt.com PRJ 81939 - RG 1486115 - RP 5333485 - ID 241338234 J-O10 J-O11 J-O10 J-O11 J-O10 J-O11 J-O10 J-O11 J-O10 J-O11 Total COMPACT FLASH MEMORY STICK SD CARD/SD HC XD CARD 1.301.673 1.242.214 42.477 28.398 133.623 69.113 1.117.708 1.140.386 7.260 3.919 100 100 3 2 10 6 86 92 1 -9 -5 -33 -33 -35 -48 -3 2 -56 -46 Absolute Absolute Share Share Growth +/- % Growth +/- % 6,0 3,0 8,0 50,2 8,0 5,4 4,3 5,0 4,4 3,8 4,7 3,2 6,6 51,8 6,8 4,6 5,2 4,2 2,9 2,7 64,6 5,7 11,1 3,9 4,5 2,7 2,9 2,9 70,1 4,9 5,8 5,6 4,2 57,2 39,9 38,7 59,1 6,3 3,4 2,5 51,1 8,9 5,9 4,9 5,6 5,0 3,7 5,1 3,4 4,9 51,1 7,2 4,9 5,5 4,5 3,1 74,7 20,1 4,7 93,0 3,7 2,6 DANE ELEC DURACELL EMTEC INTEGRAL KINGSTON LEXAR PANASONIC PNY TECHNOLOG. SANDISK SONY TAKEMS TDK TRANSCEND TRAXDATA UNBRANDED TRADEBRANDS & EXCL. OTHERS GfK Retail and Technology 11/2011 MEMORY CARDS Sales Ths. Value EUR YEAR TO DATE Belgium Panelmarket © by GfK-RT, www.gfkrt.com PRJ 81939 - RG 1486115 - RP 5333487 - ID 241338259 J-O10 J-O11 J-O10 J-O11 J-O10 J-O11 J-O10 J-O11 J-O10 J-O11 J-O10 J-O11 J-O10 J-O11 Total <€5 €5<€10 €10<€15 €15<€20 €20<€25 >=€25 23.537 22.931 29 29 3.087 2.798 4.877 4.591 3.421 3.554 2.393 2.532 9.729 9.427 100 100 13 12 21 20 15 16 10 11 41 41 4 -3 -75 1 -27 -9 18 -6 -5 4 18 6 13 -3 Absolute Absolute Share Share Growth +/- % Growth +/- % 5,7 2,4 10,7 55,5 7,4 4,3 2,4 3,9 3,3 3,4 2,8 2,8 8,0 58,4 7,1 3,6 3,5 3,3 12,5 4,5 3,6 24,4 42,5 5,7 7,6 16,5 6,0 16,3 27,3 12,3 2,7 5,1 6,4 2,8 46,9 10,1 6,6 6,5 7,3 5,6 4,5 6,4 2,5 3,0 3,7 41,6 4,3 7,0 9,5 6,8 5,4 4,9 4,1 6,0 51,5 9,4 3,8 5,4 4,6 4,9 2,6 4,8 4,1 7,8 55,5 7,2 3,1 4,1 3,3 2,5 3,8 5,4 4,3 15,0 47,4 4,4 4,3 5,8 4,0 2,7 4,0 3,9 3,0 5,3 50,8 12,2 2,7 3,9 4,4 3,8 13,4 54,3 12,7 4,1 2,5 4,2 3,6 10,9 62,5 2,7 6,0 4,2 3,2 7,0 13,9 63,5 5,2 3,7 3,7 9,7 66,7 6,3 3,0 DANE ELEC DURACELL EMTEC INTEGRAL KINGSTON LEXAR PANASONIC PNY TECHNOLOG. SANDISK SONY TAKEMS TDK TRANSCEND TRAXDATA UNBRANDED TRADEBRANDS & EXCL. OTHERS GfK Retail and Technology 11/2011 MEMORY CARDS Sales Pieces,Sales Ths. Value EUR YEAR TO DATE Belgium Panelmarket MEMORY STICK © by GfK-RT, www.gfkrt.com PRJ 81939 - RG 1486115 - RP 5333481 - ID 240819919 J-O10 J-O11 A11 M11 J11 J11 A11 S11 O11 J-O10 J-O11 A11 M11 J11 J11 A11 S11 O11 Sales Pieces Sales Ths. Value EUR 133.623 69.113 6.168 6.948 6.834 11.775 5.655 4.070 4.572 3.231 1.621 149 168 164 240 135 101 111 -35 -48 -46 -50 -42 -43 -47 -48 -43 -38 -50 -48 -52 -43 -50 -47 -46 -42 Pieces | Ths. EUR Pieces | Ths. EUR Growth +/- % Growth +/- % 83,3 14,2 3,7 83,7 11,3 3,7 87 9,1 4,8 86,7 8,3 3,5 83,1 6,5 6,8 2,8 76,5 20,4 3,4 88 7,6 3,8 88 7,3 3 89,8 6,8 3,7 84,5 11,2 7,9 83,5 7,4 8,1 84,4 7,3 8,7 84,1 7,1 7,8 81,6 5 5,5 6,3 85,7 7,7 7,1 86 6 7,7 84,3 7 6,3 87,6 5,7 MICRO PRO PRO DUO STANDARD PRO-HG DUO OTHERS