perform analysis and how to use data to optimize product features and drive platform growth. Piyawat Amnuayphoncharoen (Trust) Data Analyst, LINE Thailand Using Data to Drive Platform Growth
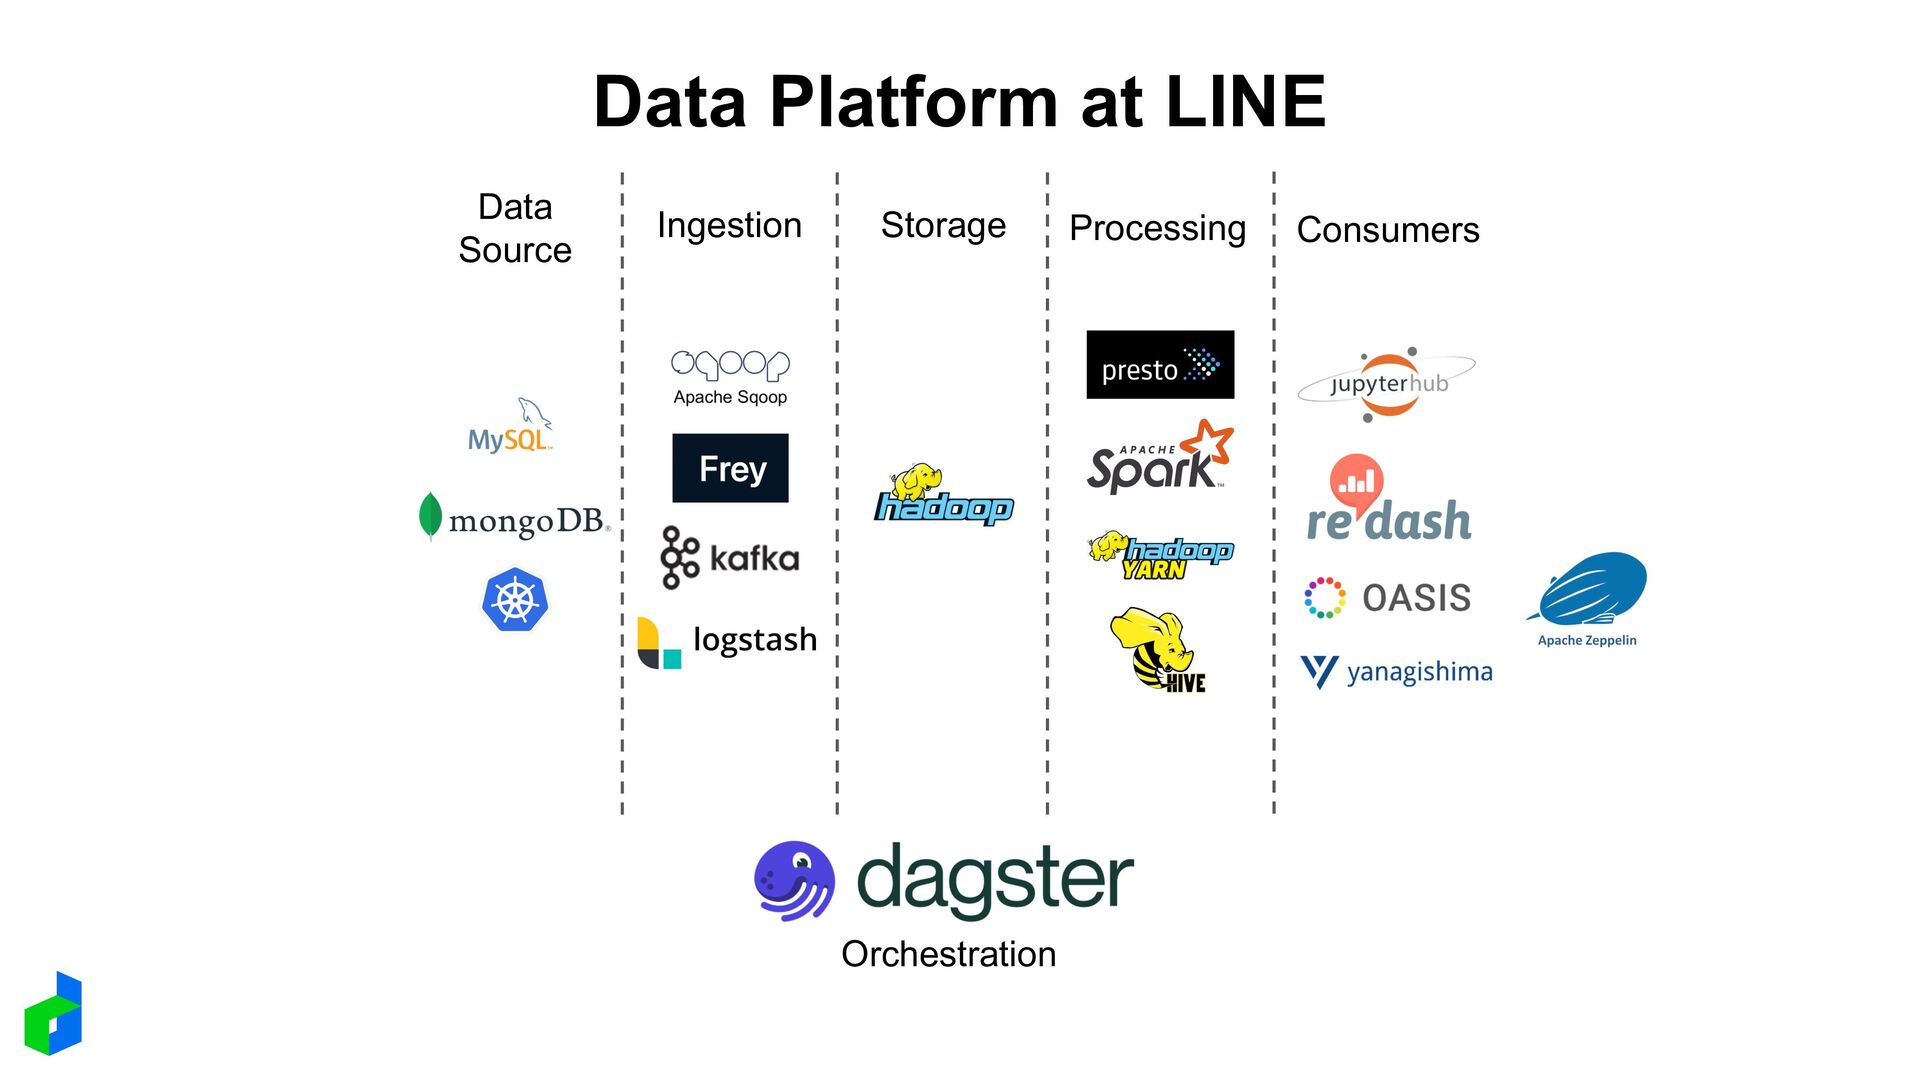
from different sources? ◦ What are steps needed to create efficient data platform? ➢ How to use data to optimize product features? ◦ How to turn data into insights? ◦ What should be aware when interpreting A/B testing results? Agenda
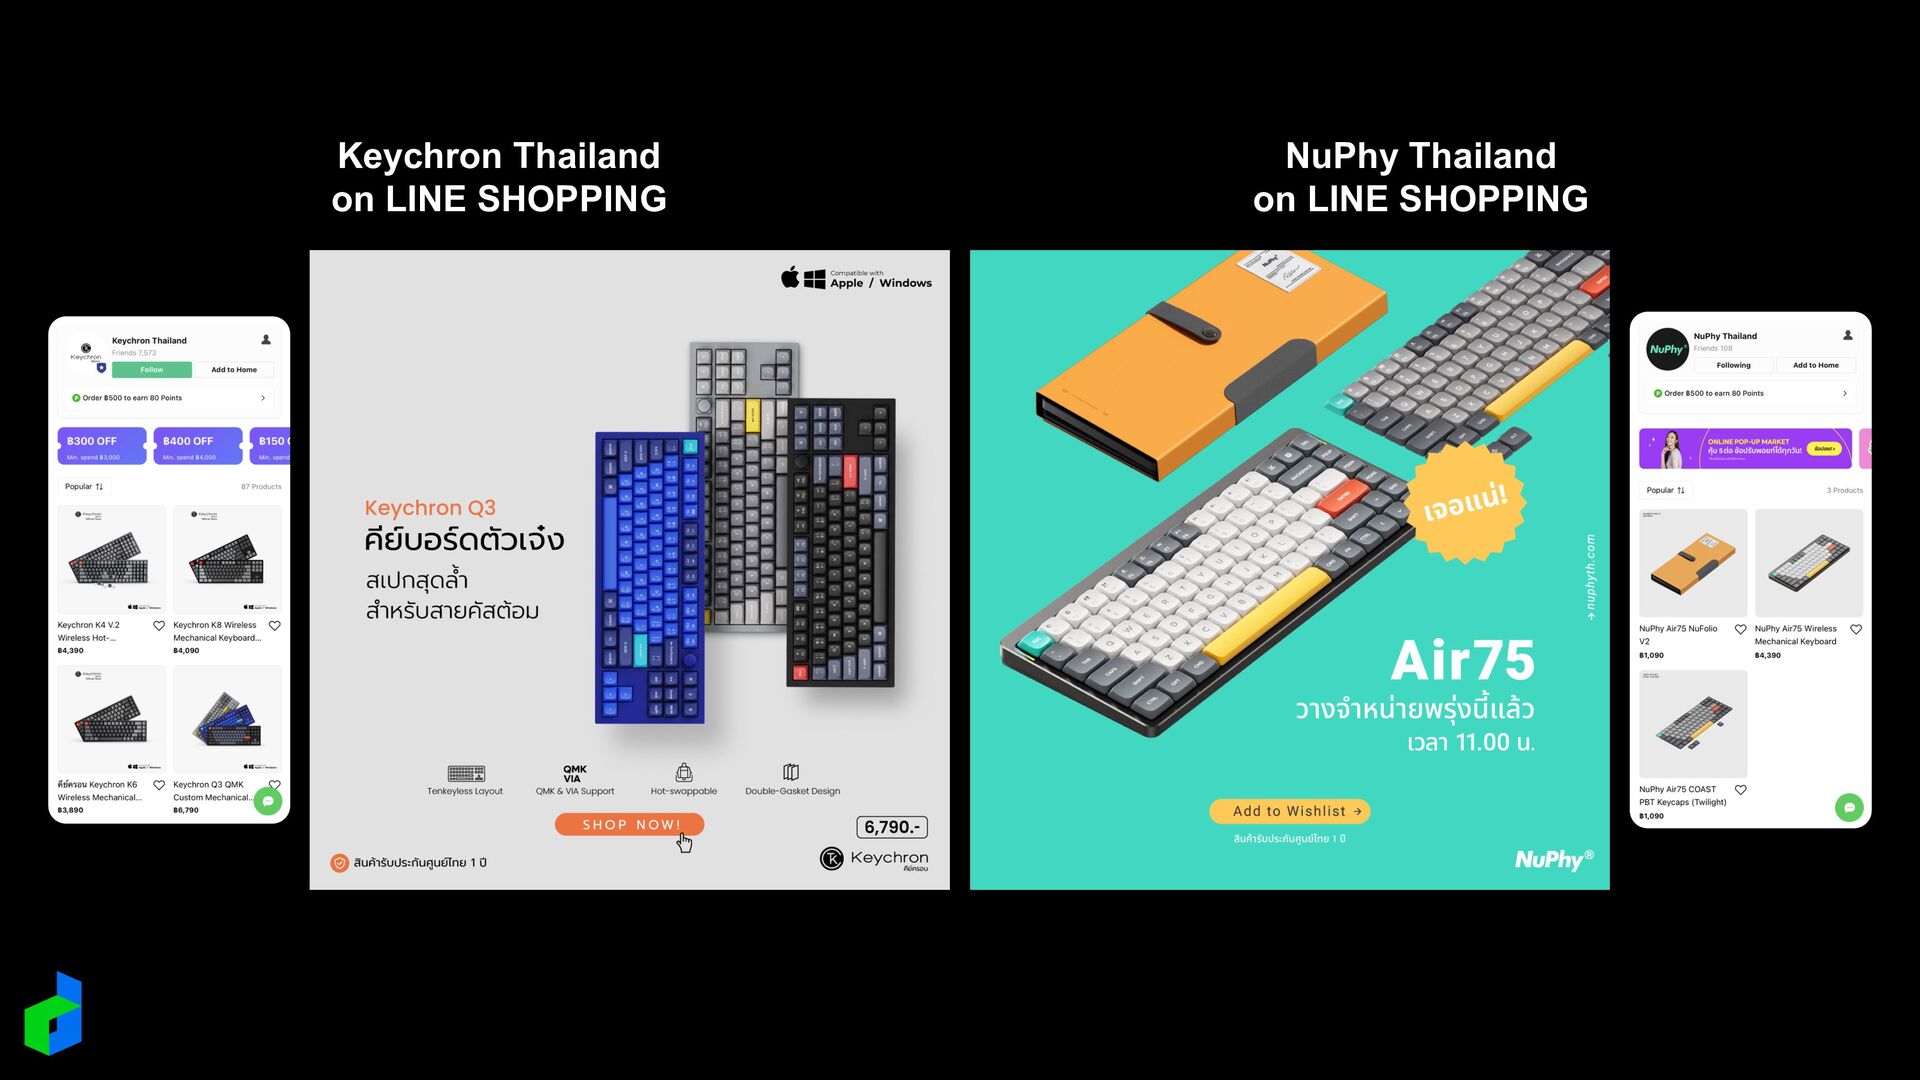
products via storefront. - Manage stocks and orders from both sources in 1 place. - Send out new product launch or promotion using broadcast messages. - Build their own brand. - Create fan base using LINE Official Account. Buyers - Discover brands they love. - Follow or Add Friend with shops to get promotion and follow their contents. - Exclusive promotion on LINE SHOPPING : LINE POINTS / Coupon / LINE MAN Discount
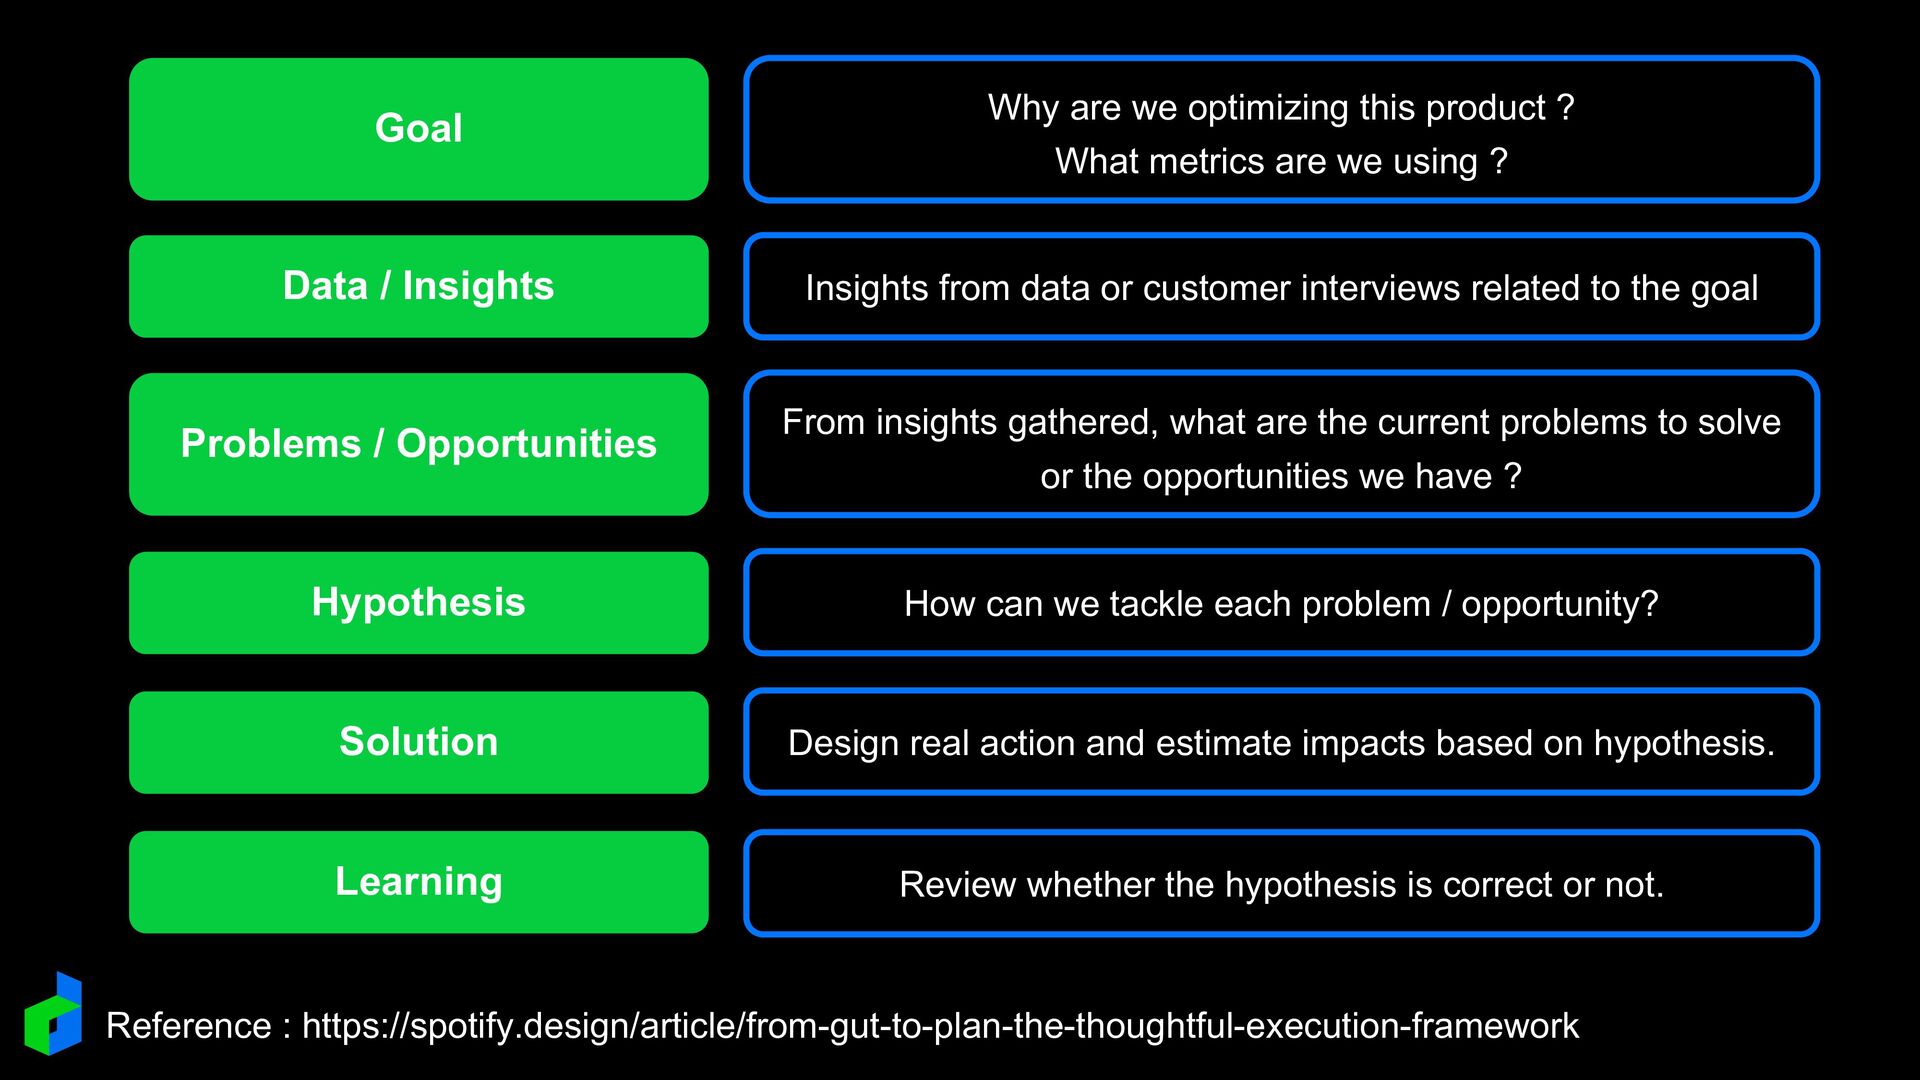
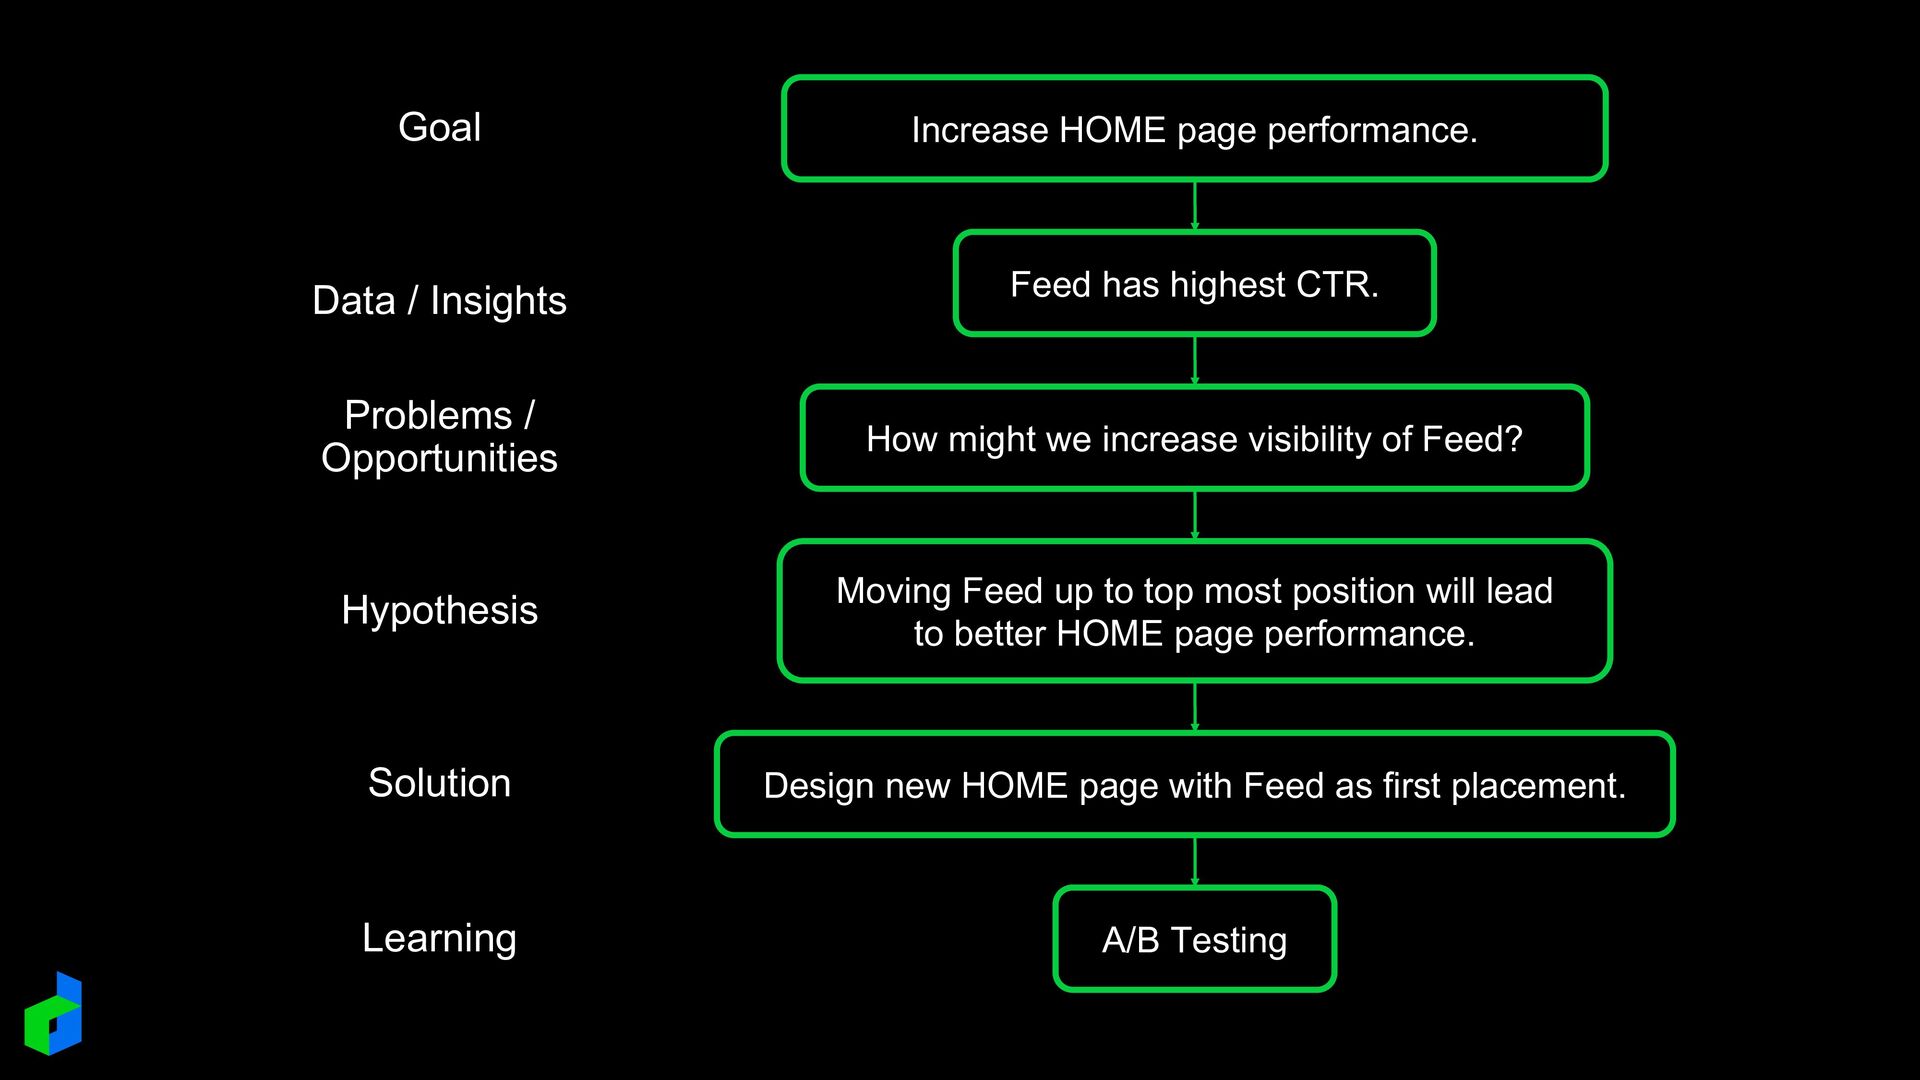
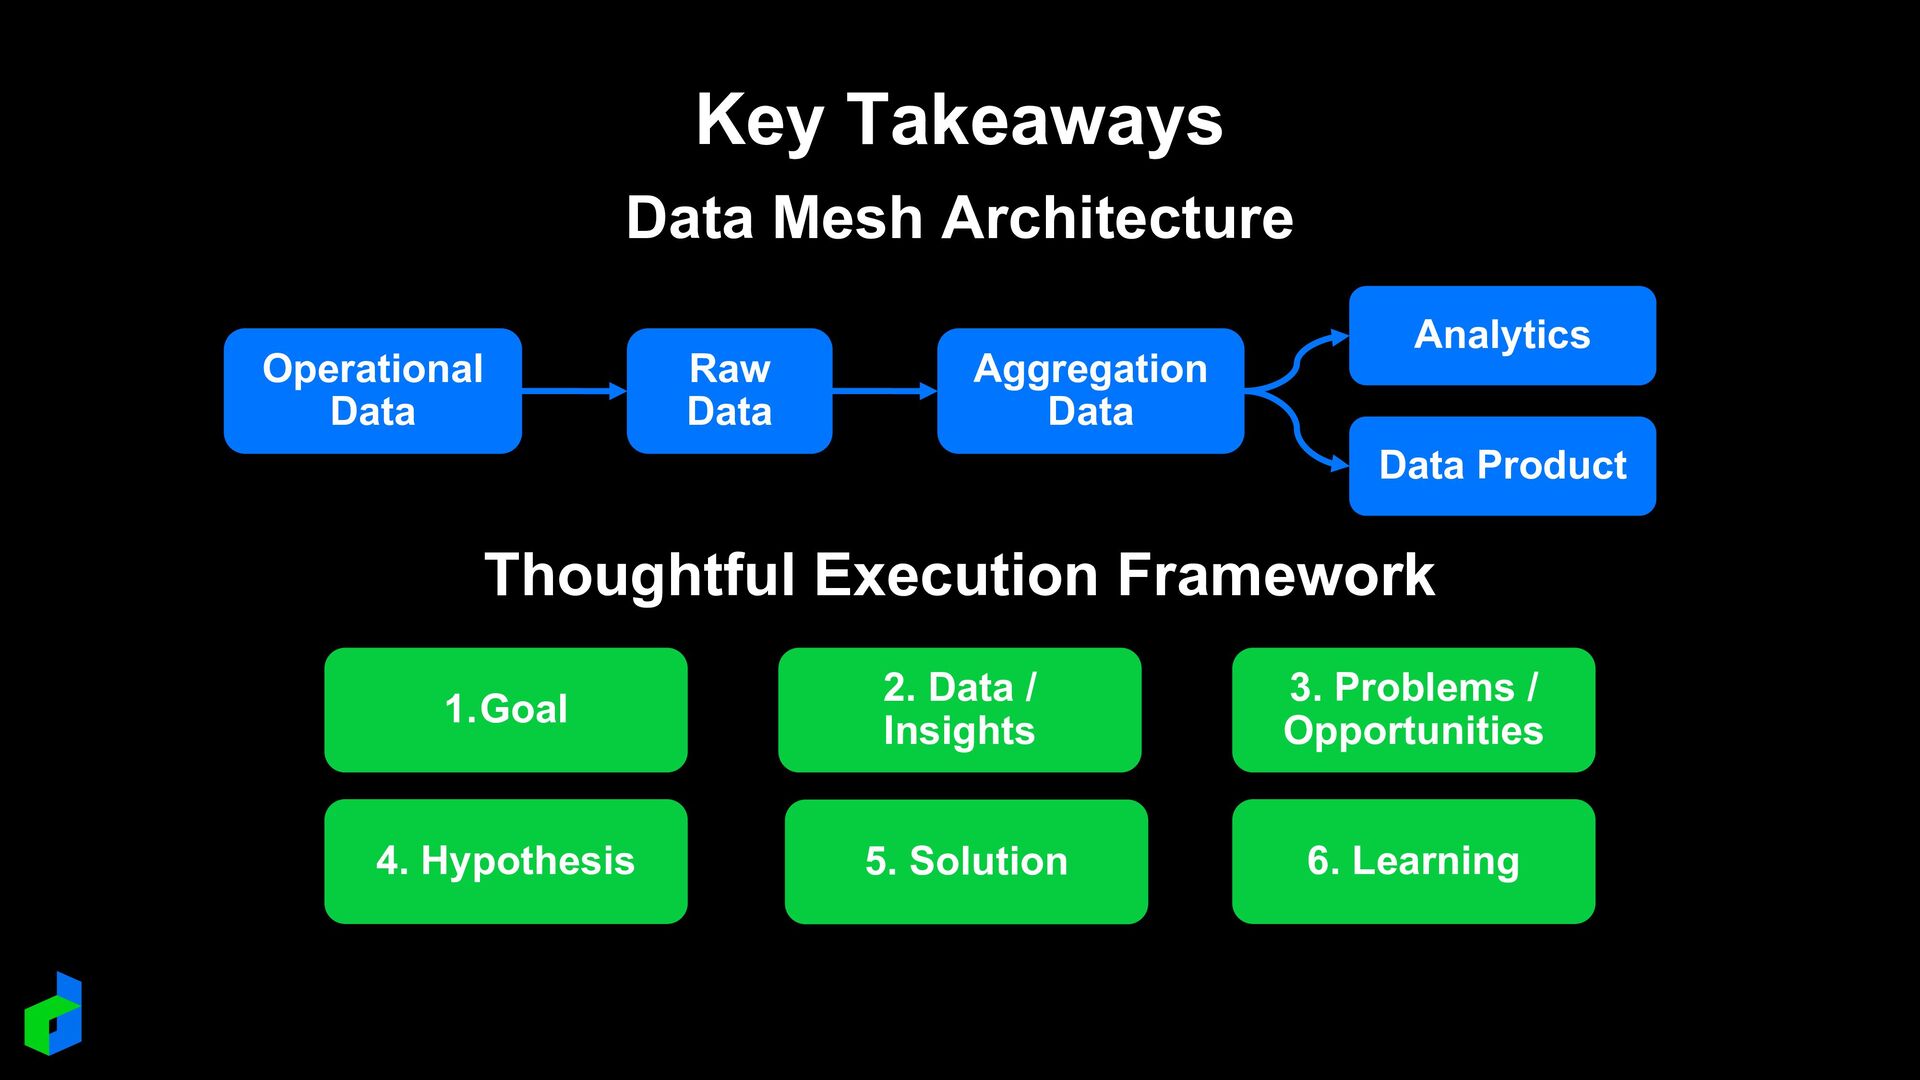
Hypothesis Solution Learning Why are we optimizing this product ? What metrics are we using ? Insights from data or customer interviews related to the goal From insights gathered, what are the current problems to solve or the opportunities we have ? How can we tackle each problem / opportunity? Design real action and estimate impacts based on hypothesis. Review whether the hypothesis is correct or not.
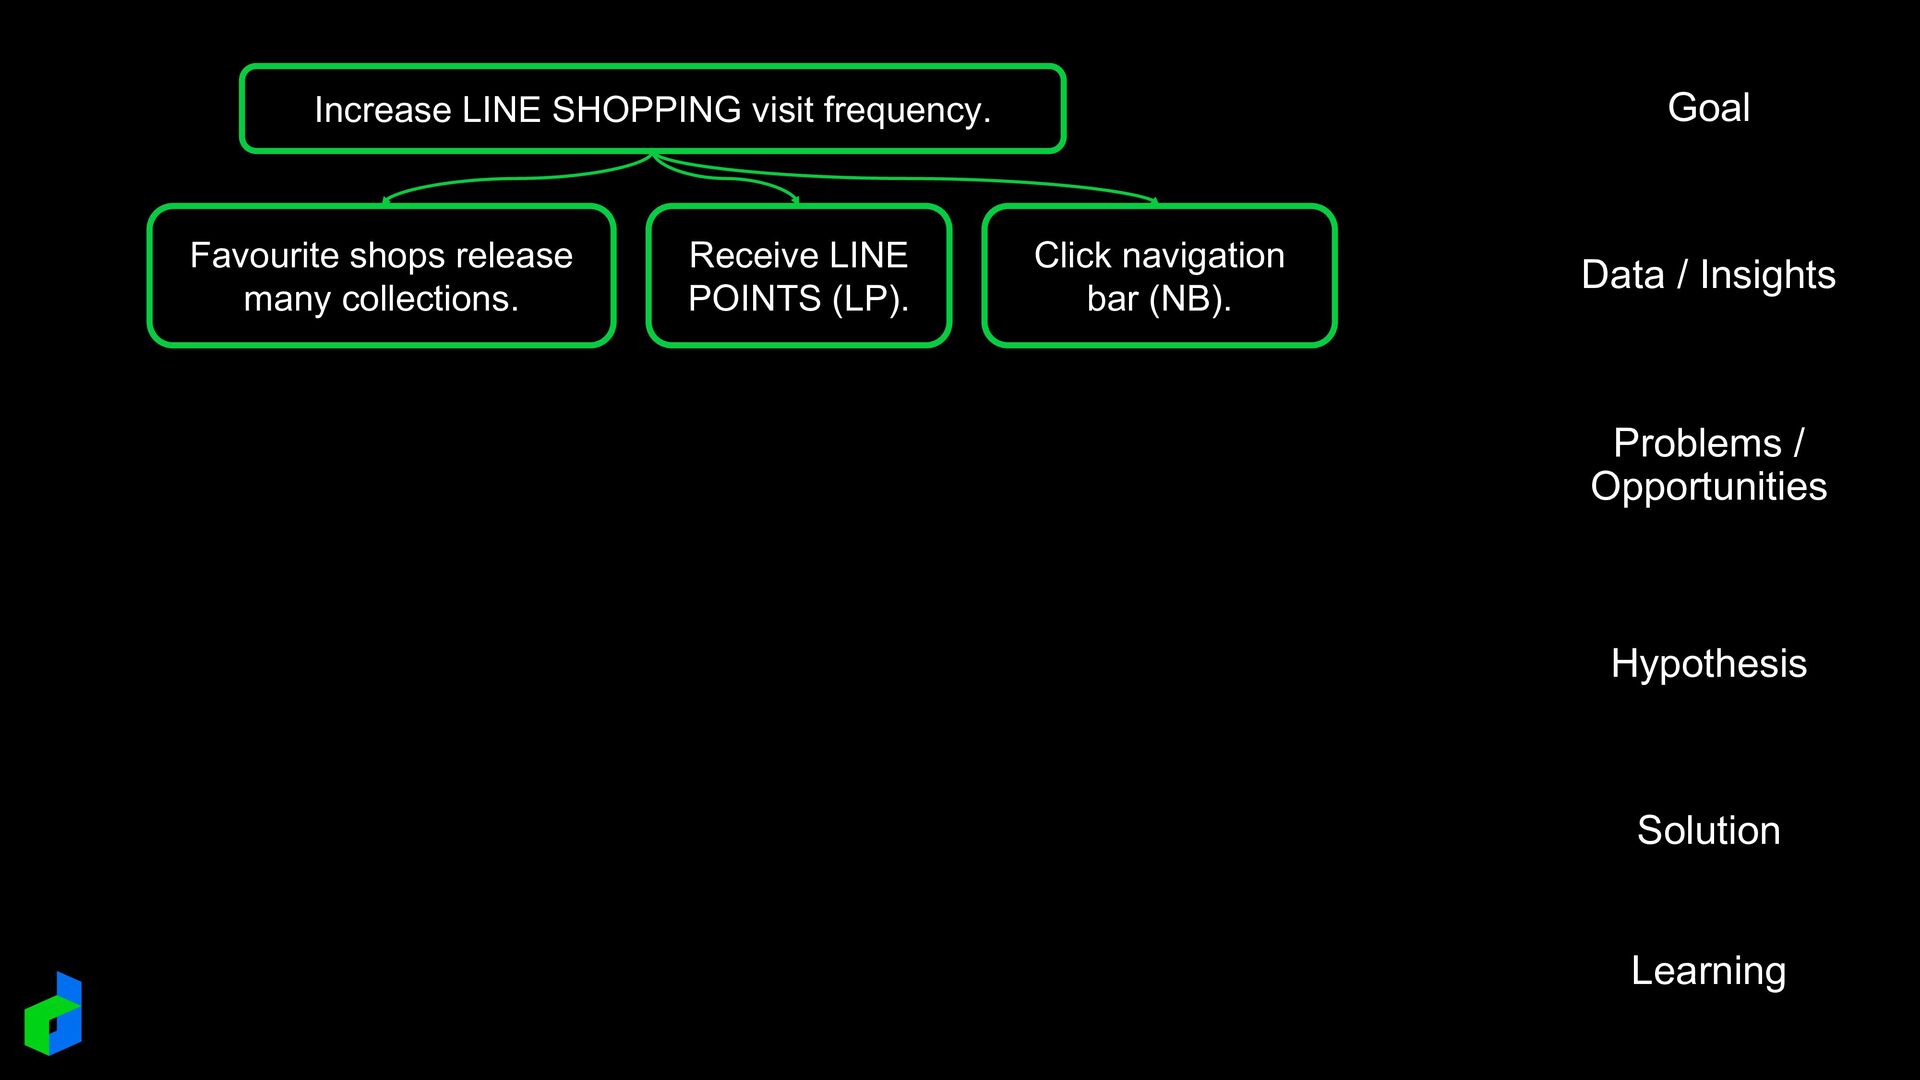
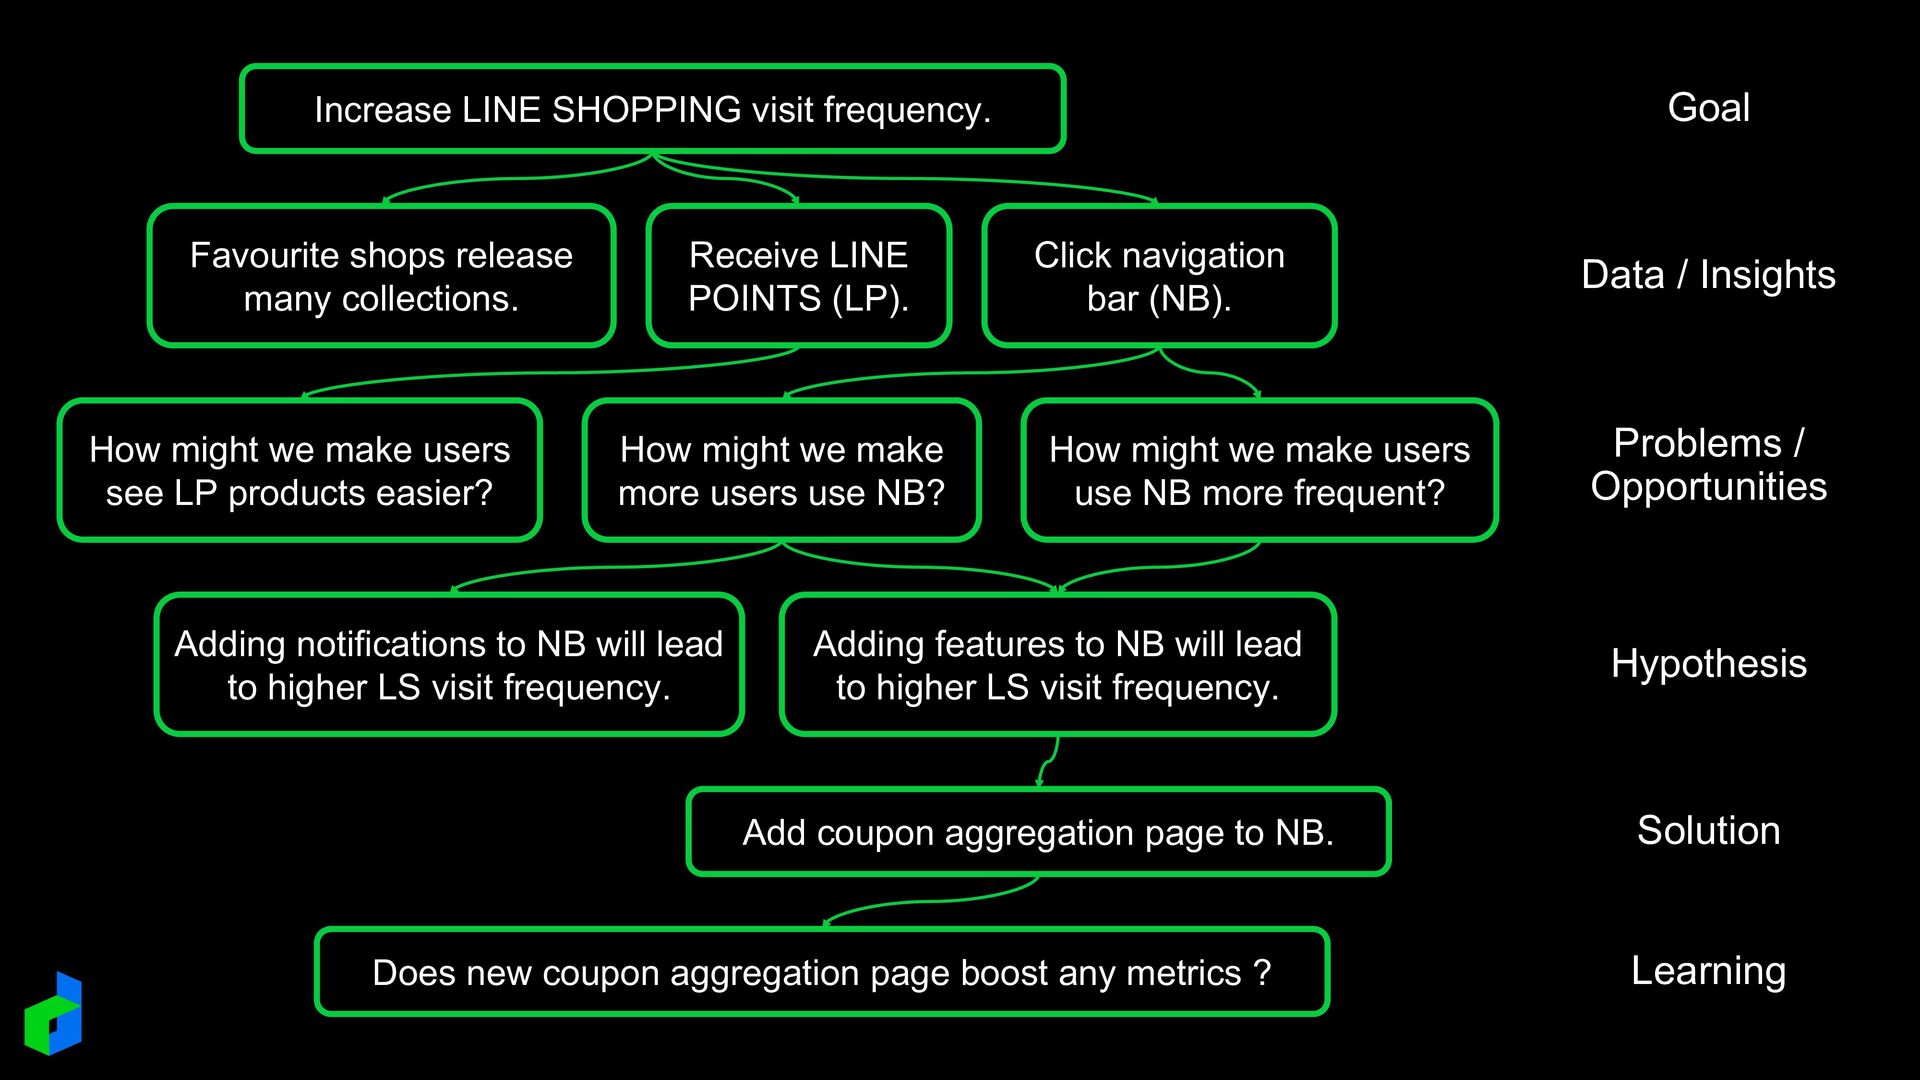
Increase LINE SHOPPING visit frequency. Click navigation bar (NB). Receive LINE POINTS (LP). Favourite shops release many collections. How might we make more users use NB? How might we make users use NB more frequent? How might we make users see LP products easier? Adding features to NB will lead to higher LS visit frequency. Adding notifications to NB will lead to higher LS visit frequency. Add coupon aggregation page to NB. Does new coupon aggregation page boost any metrics ?
Increase HOME page performance. Feed has highest CTR. How might we increase visibility of Feed? Moving Feed up to top most position will lead to better HOME page performance. Design new HOME page with Feed as first placement. A/B Testing
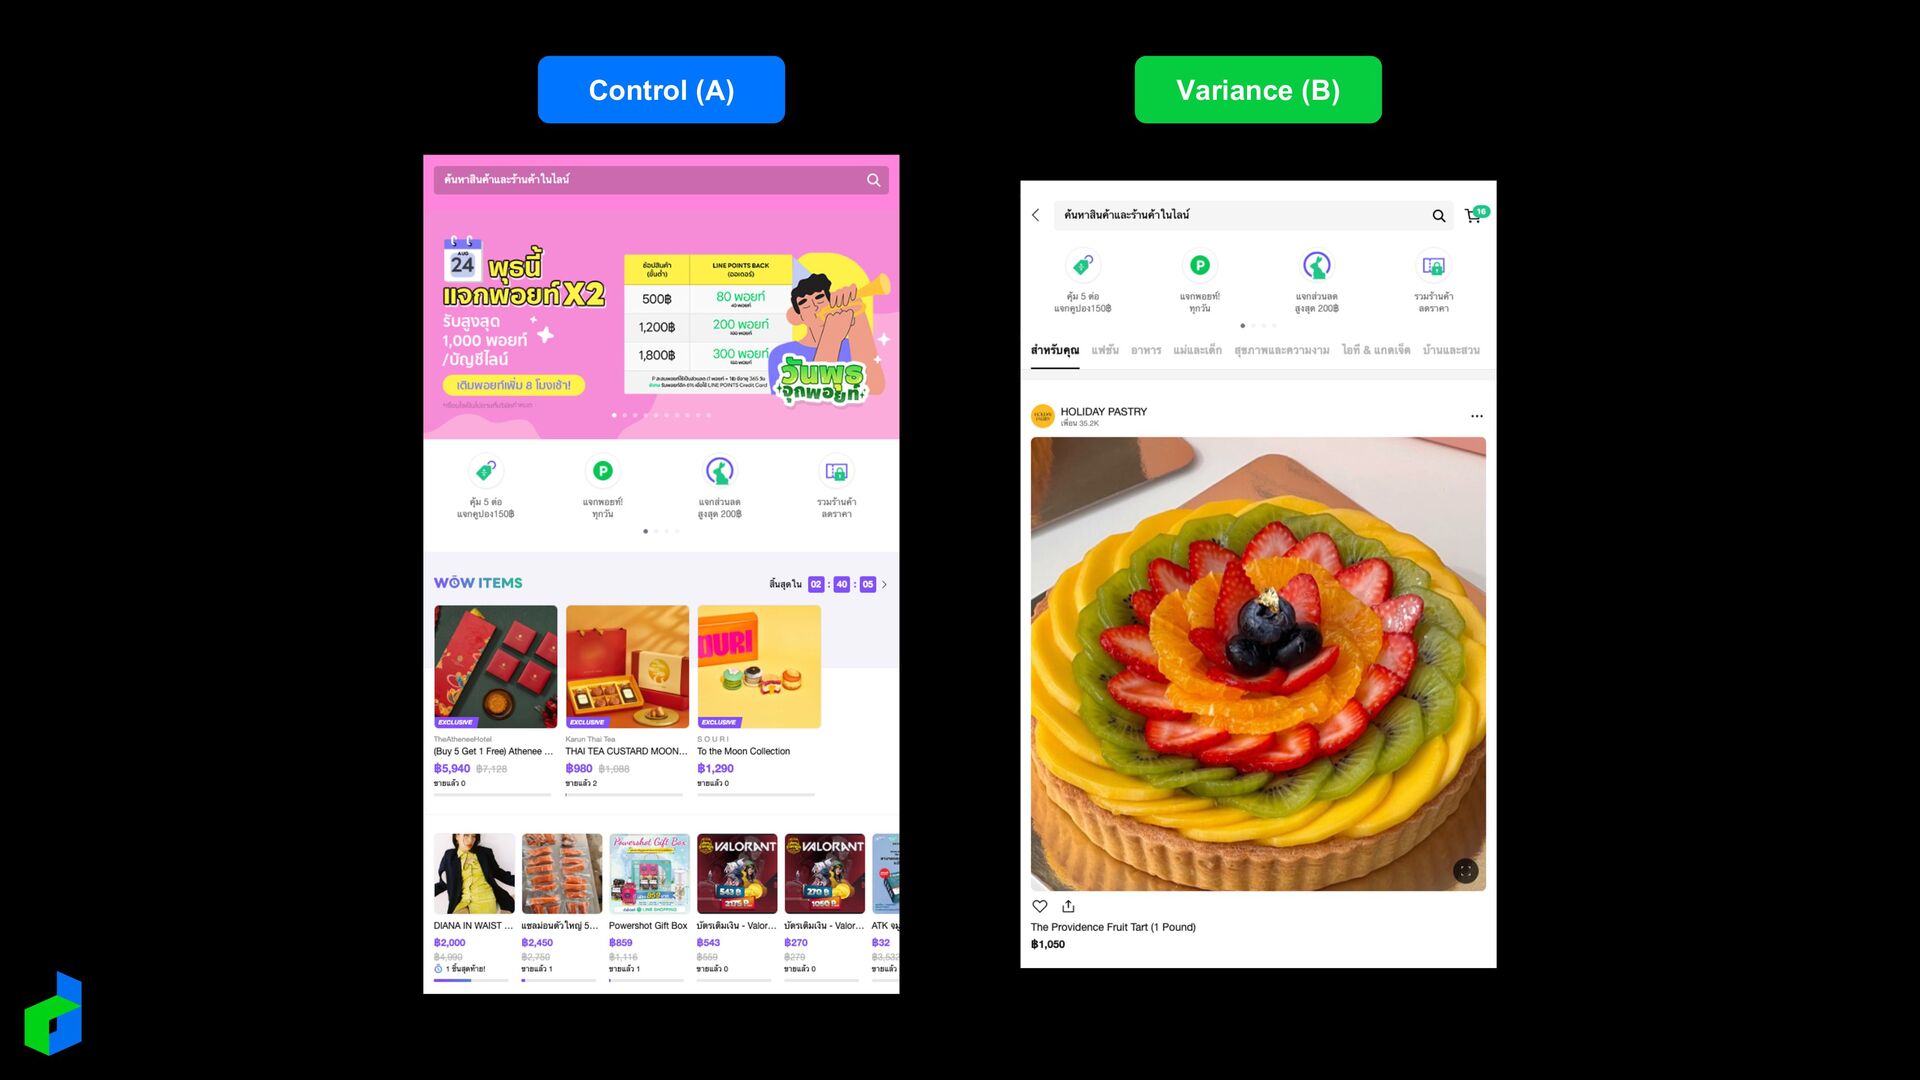
Add to Cart Rate increases 4%. - GMV increases 20%. Cons : - Shop Visit decreases 8%. - Time Spend decreases 8%. Key Findings : - CTR and CVR of Design A is higher or equal in promotion day. - Top Banner and Collection that were removed has high Shop Visit. - Business team has no placement to promote campaigns using Design B. A/B Testing Analysis Steps 1.Basic Analysis : Define Winners 2.Secondary Metrics Analysis 3.Audience Breakdown Analysis Reference : https://www.dynamicyield.com/lesson/ab-testing-analysis
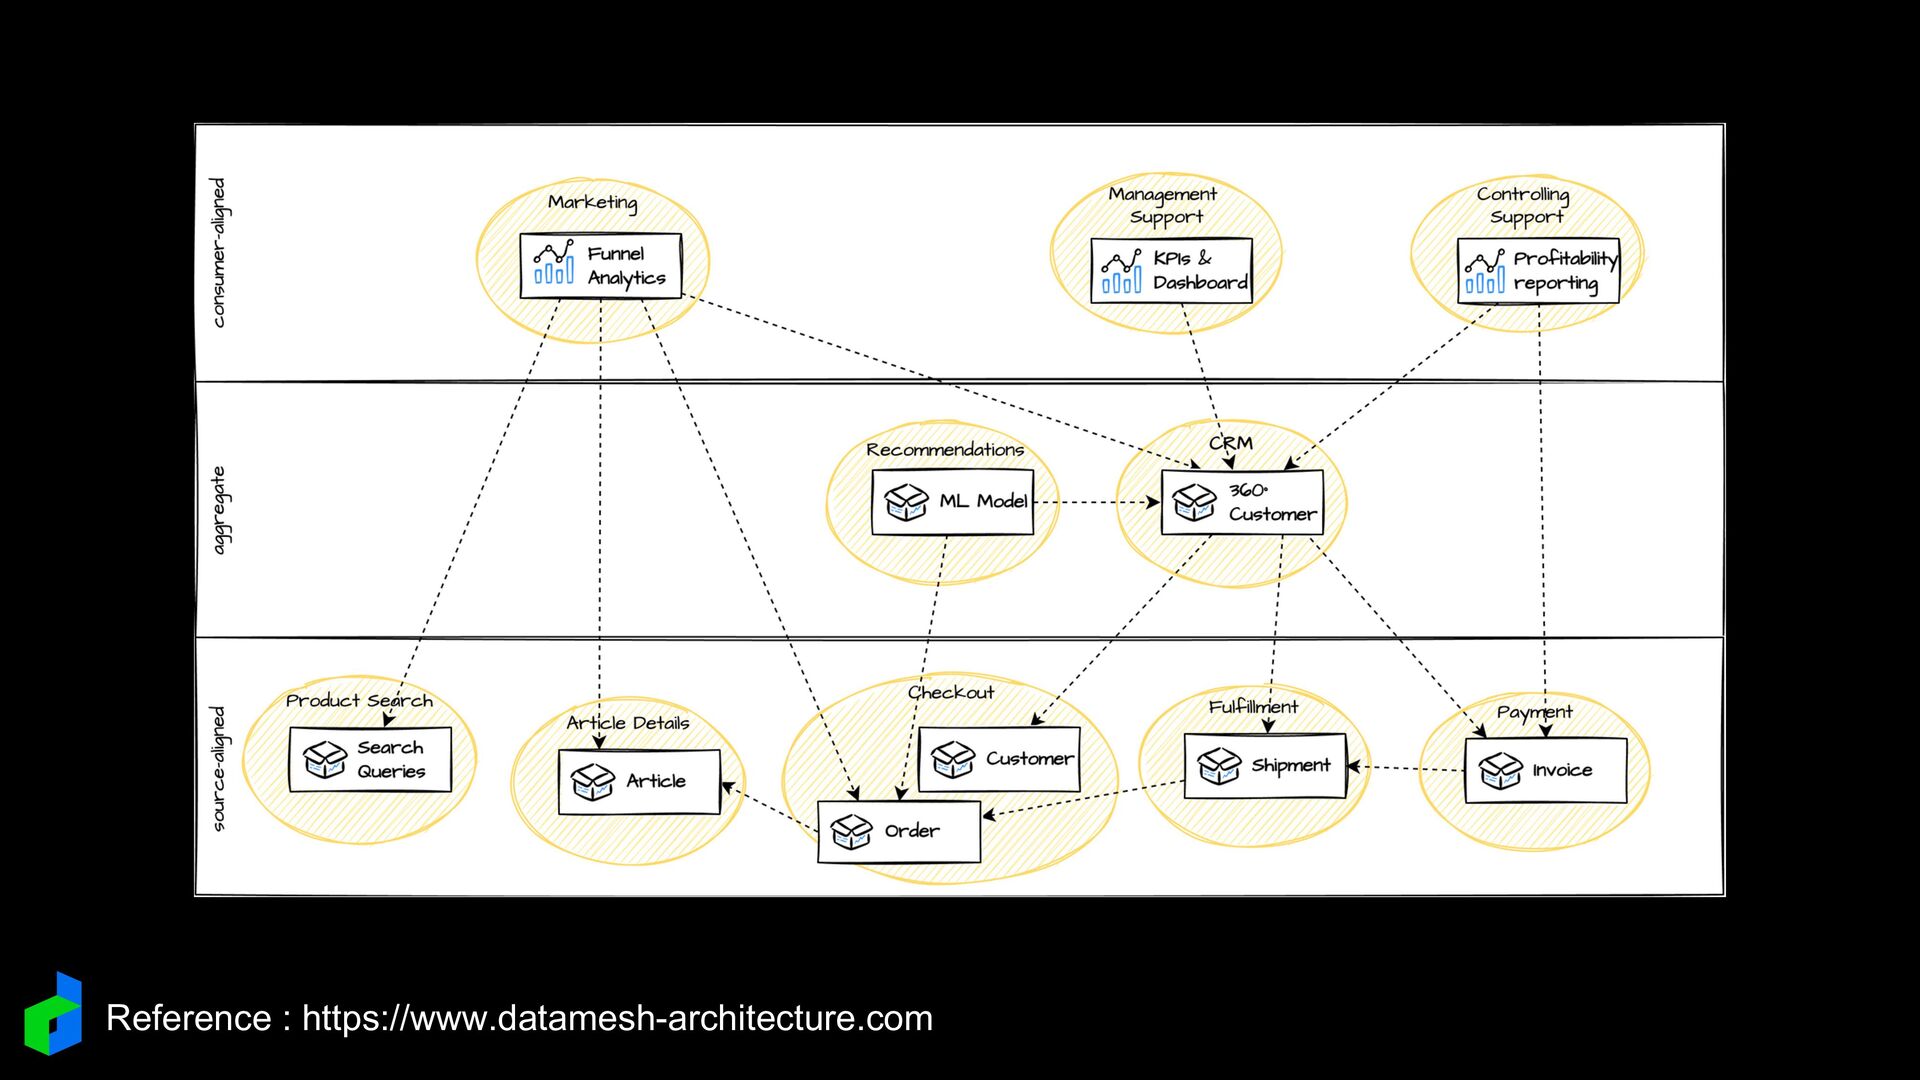
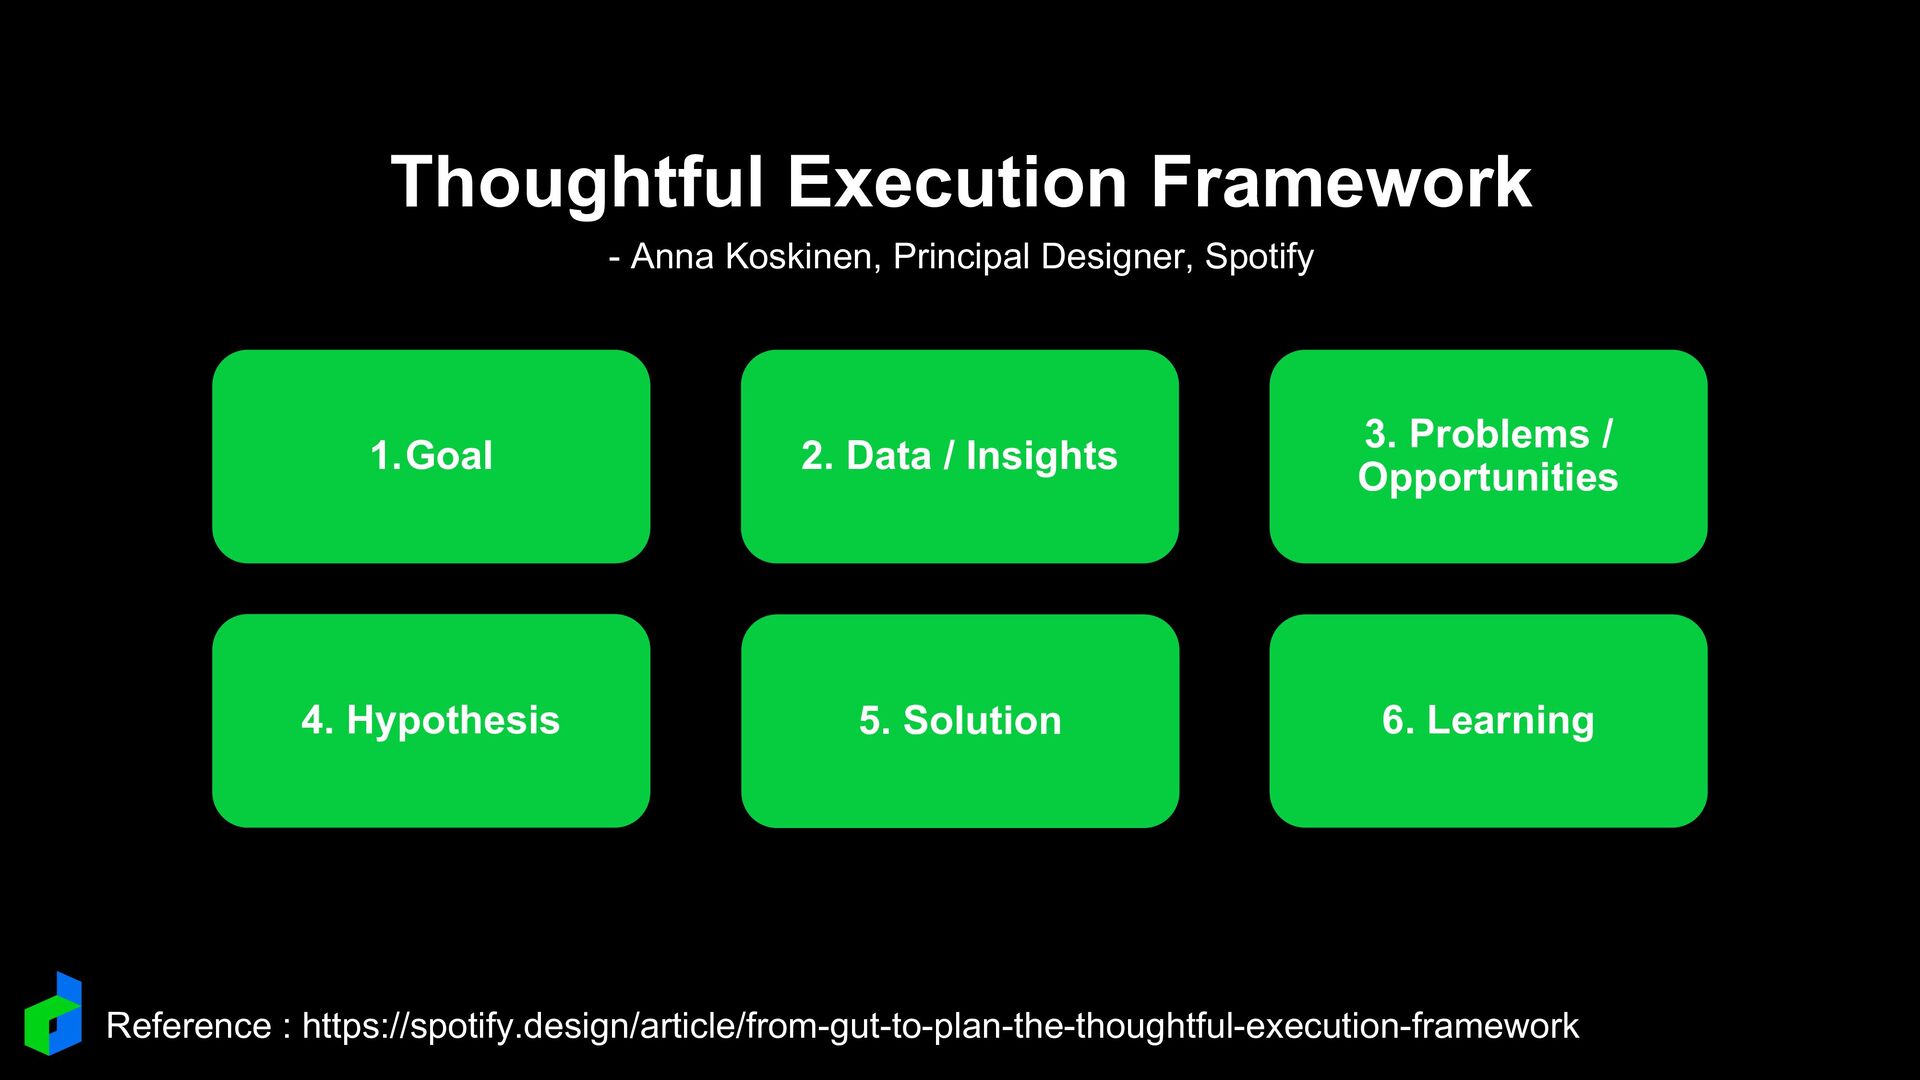
3. Problems / Opportunities 4. Hypothesis 5. Solution 6. Learning Data Mesh Architecture Operational Data Raw Data Aggregation Data Analytics Data Product