Upgrade to Pro — share decks privately, control downloads, hide ads and more …

MapGive Virtual Mapathon: Mapping For Global Health

MapGive Virtual Mapathon: Mapping For Global Health

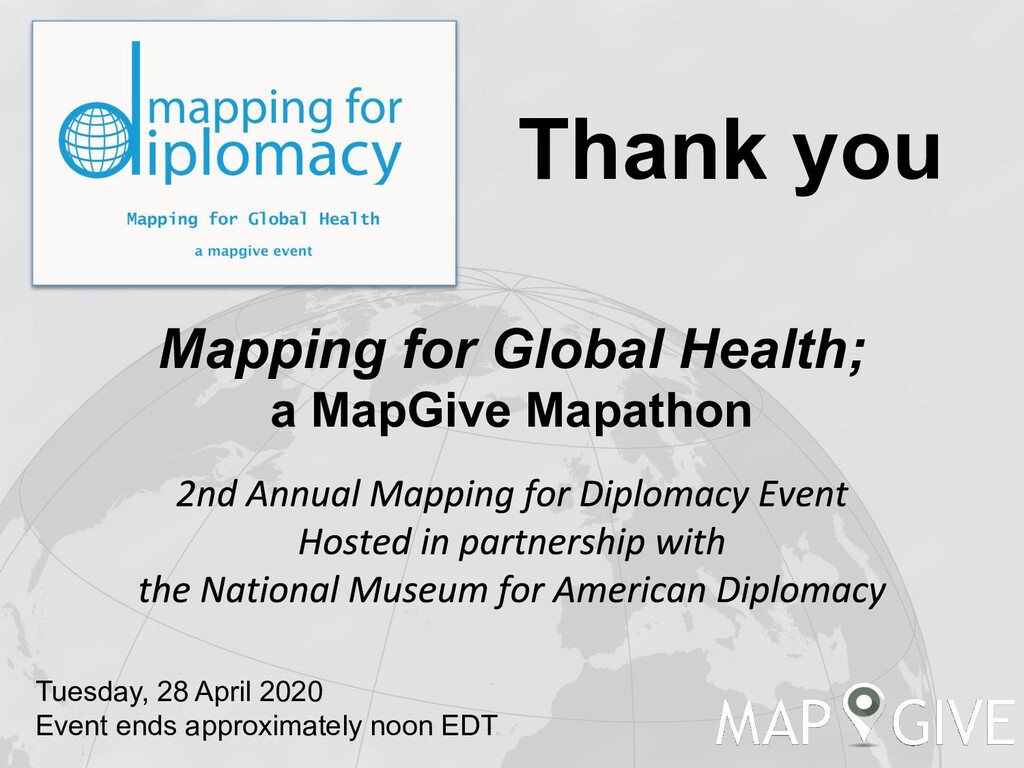
The MapGive team held their second annual Mapping for Diplomacy event in partnership with the National Museum for American Diplomacy - a virtual MapGive Mapathon focused on "Mapping for Global Health."

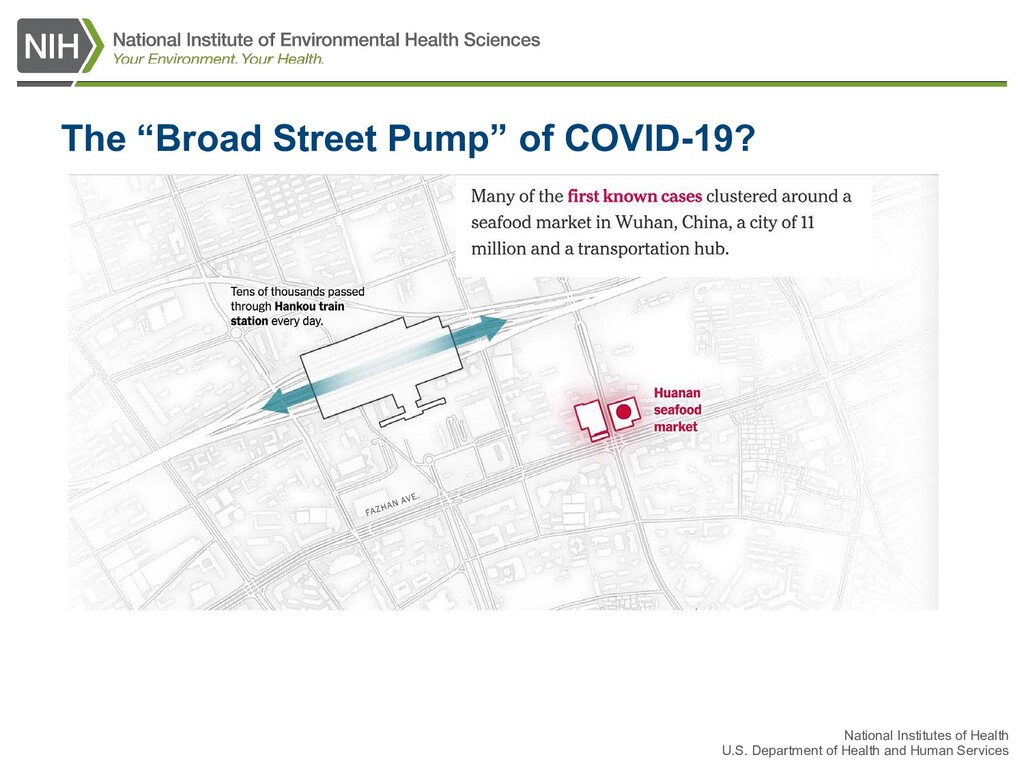
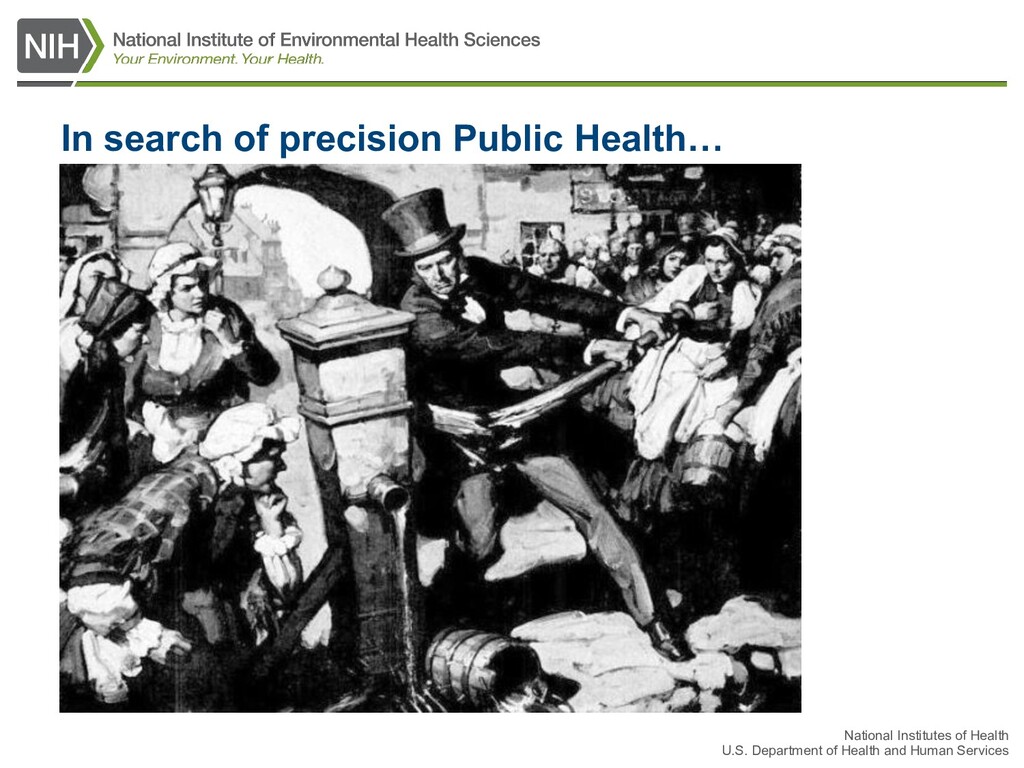
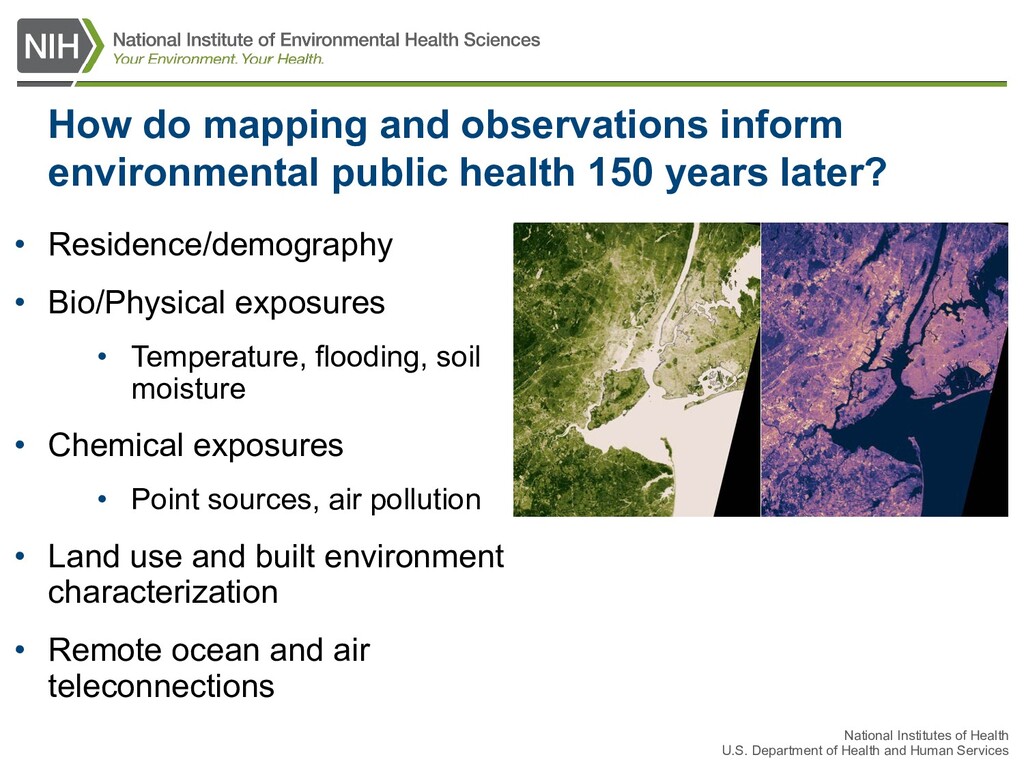
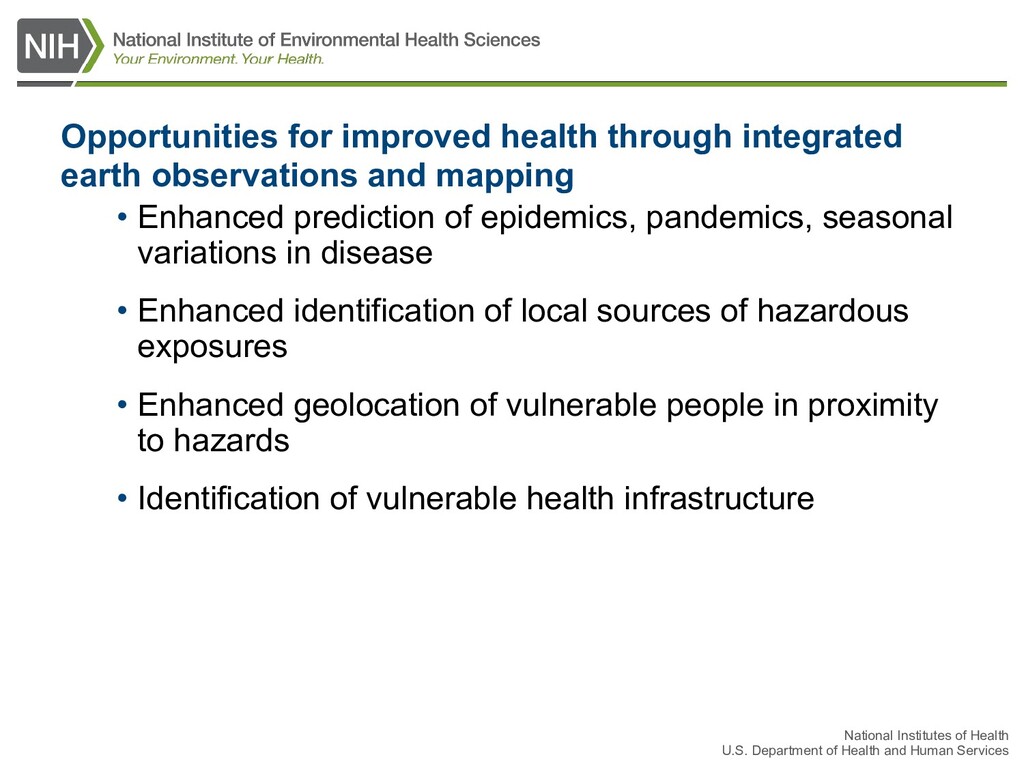
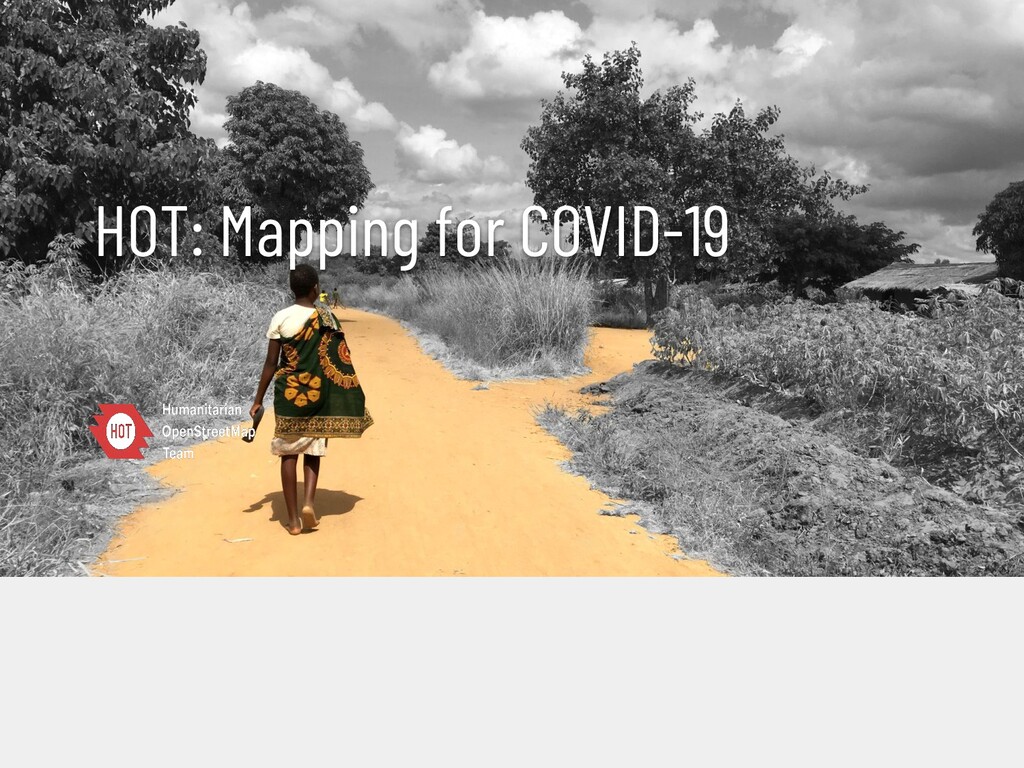
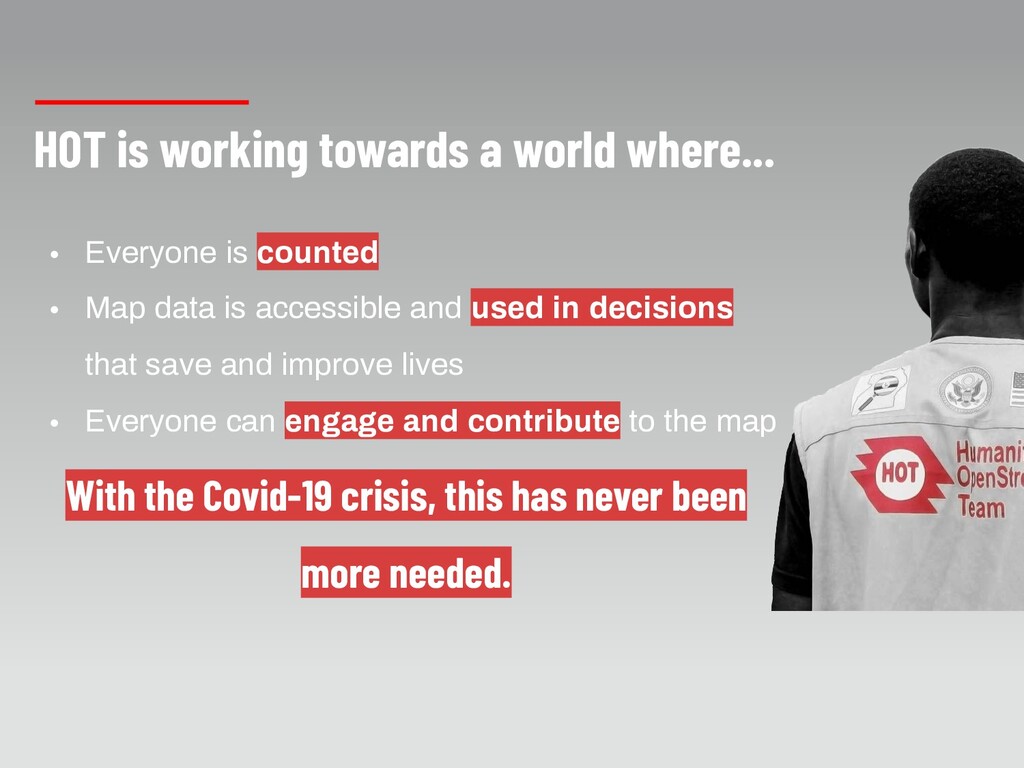
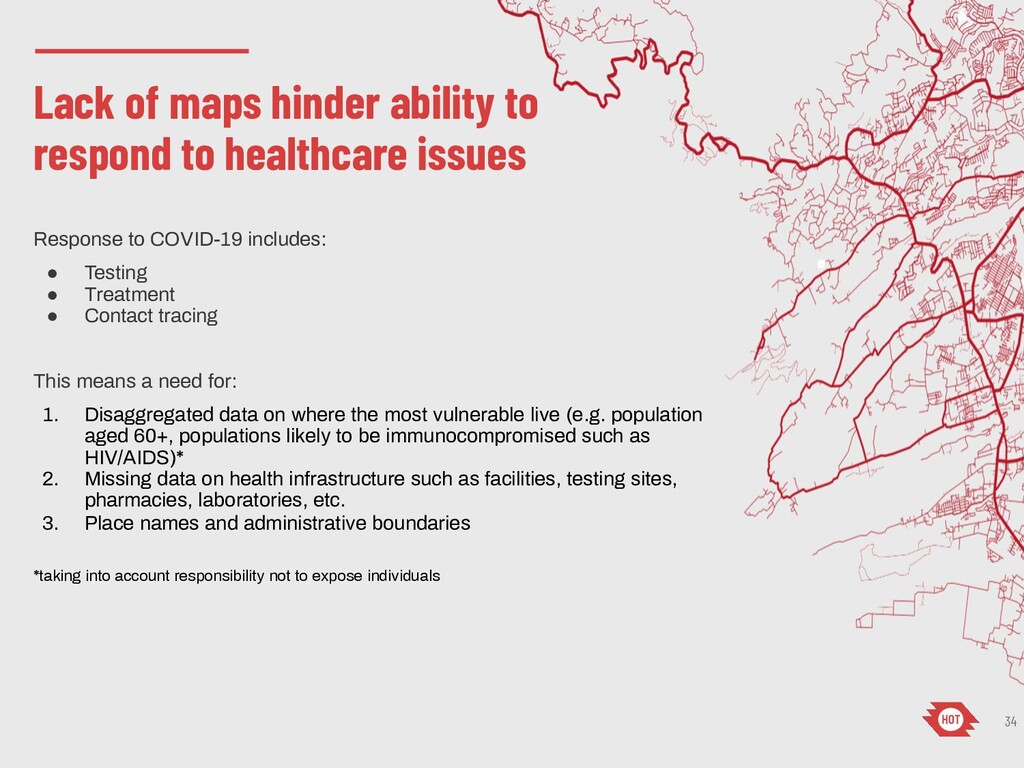
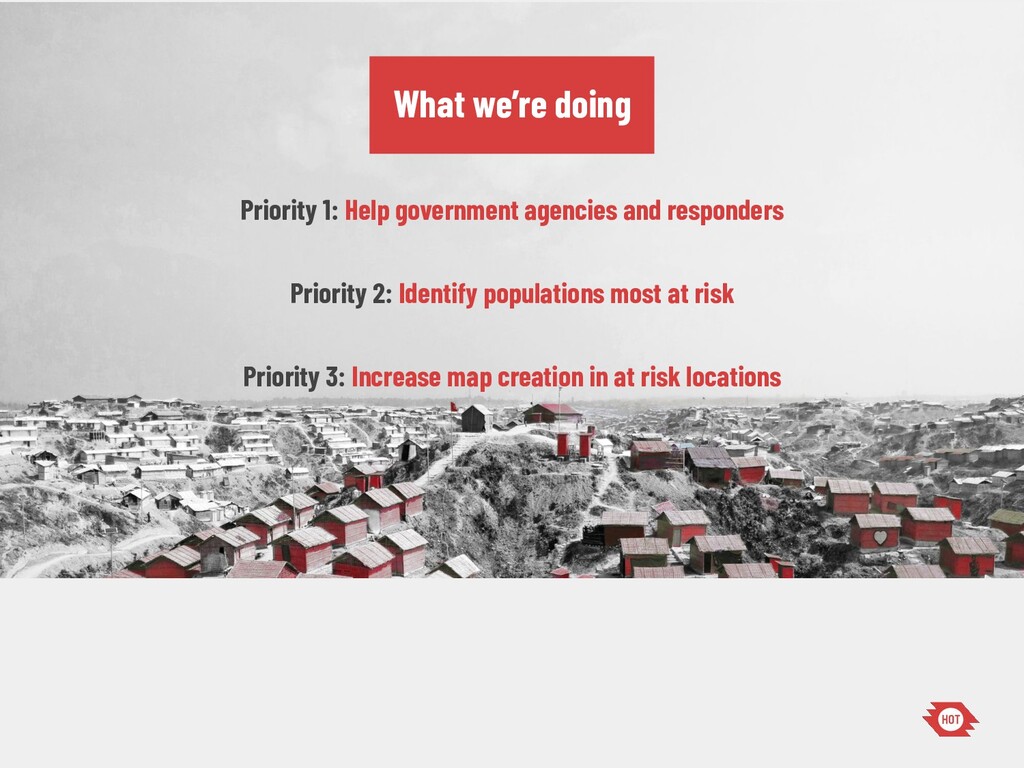
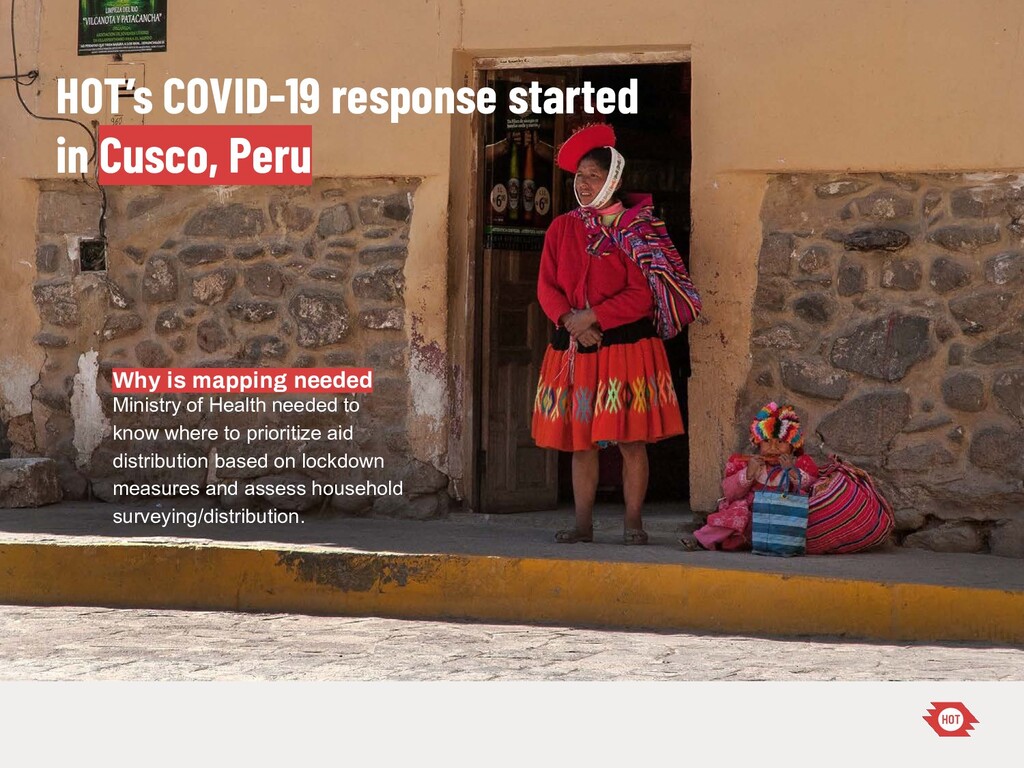
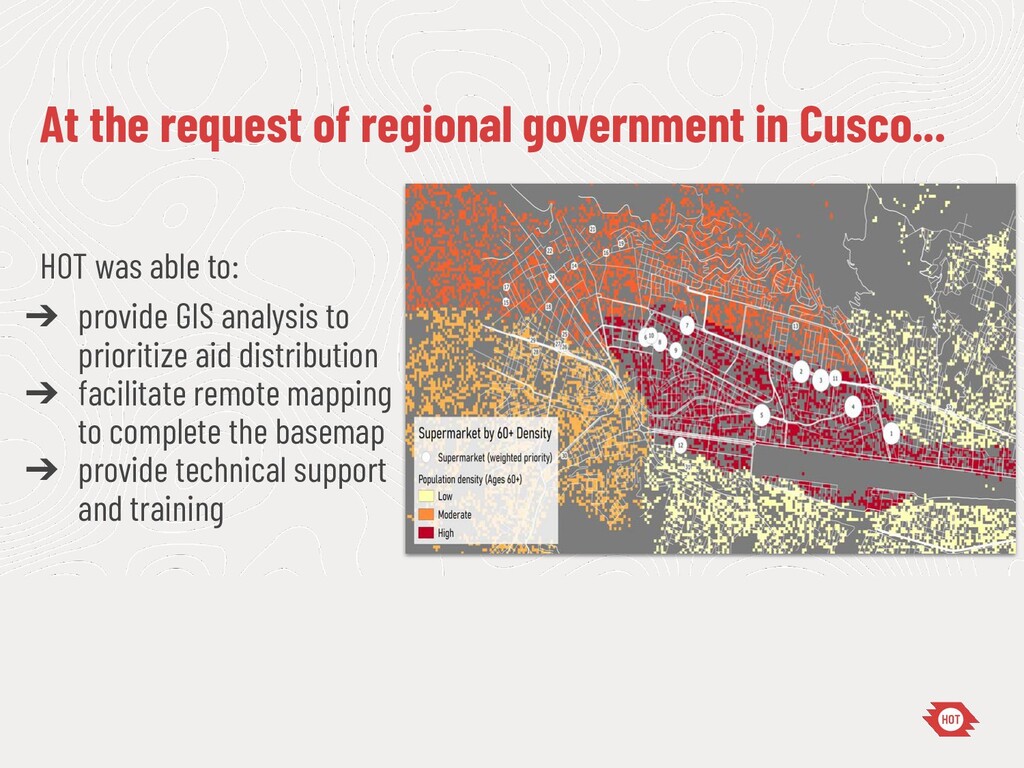
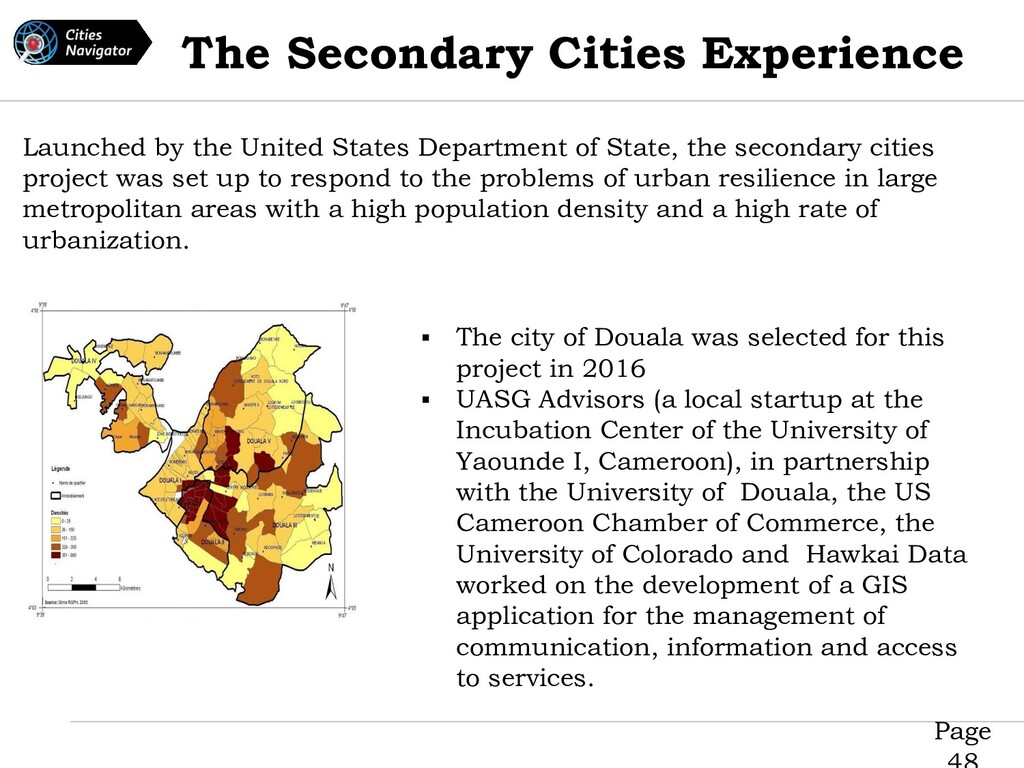
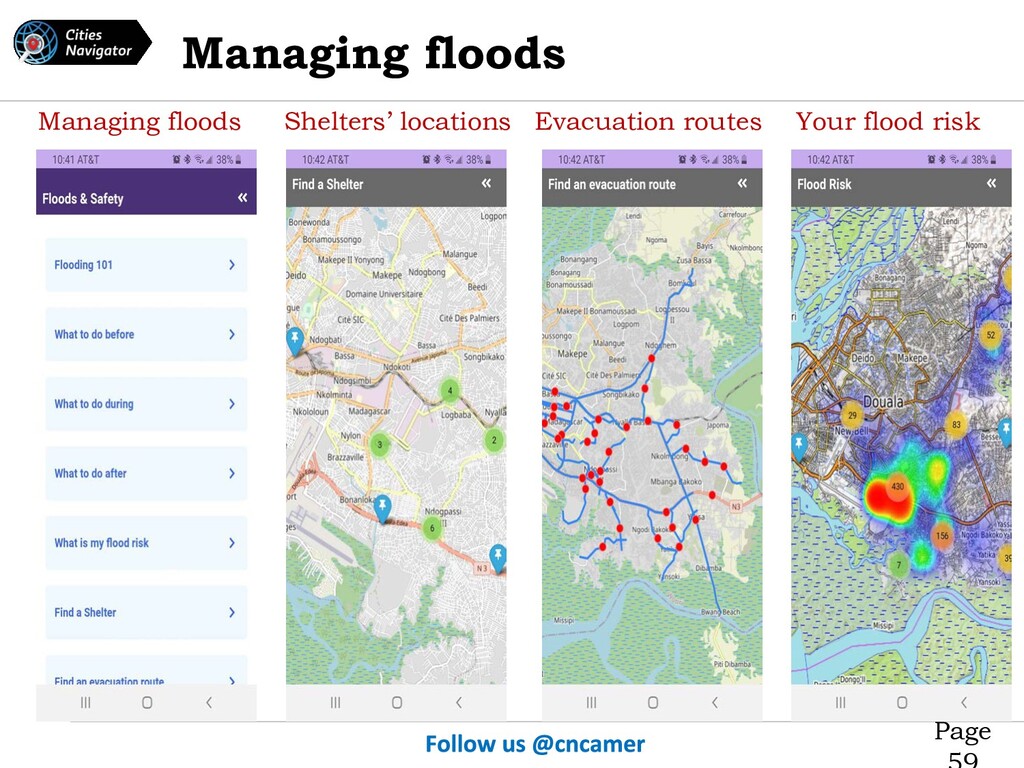
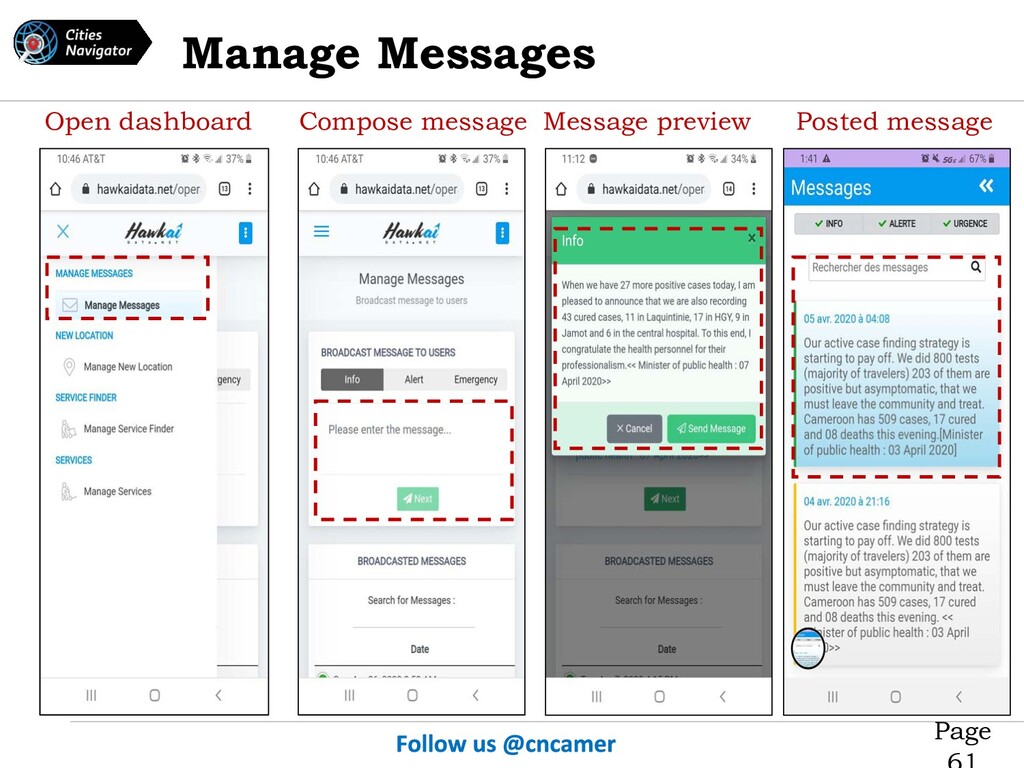
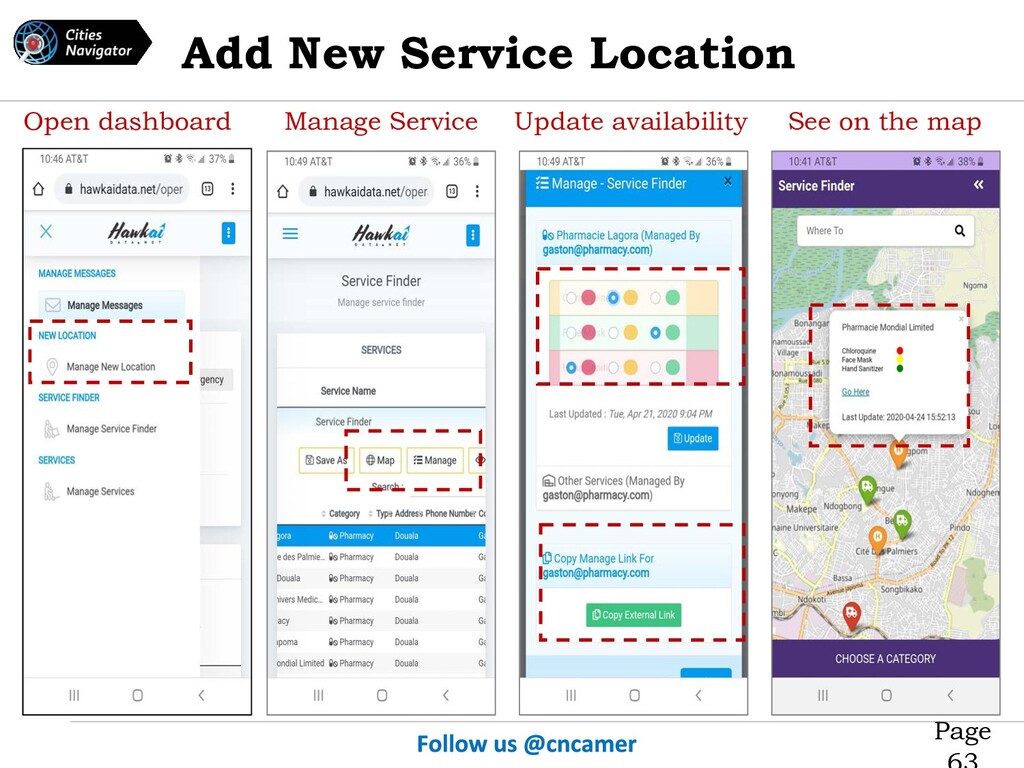
The mapathon hosted two speakers focused on how mapping can support epidemiology and policy decision making, and two other speakers who discussed using open data at the local level in support of COVID-19 response and other public health efforts (Humanitarian OpenStreetMap Team and 2C Alum from Douala, Cameroon). The mapping project focused on the Greater Gaborone area of Botswana; participants added 3600 new buildings to the map and completed about 30% of the project.

MapGive

April 28, 2020
Tweet

More Decks by MapGive

Other Decks in How-to & DIY

Transcript

  1. Mapping for Global Health; a MapGive Mapathon Tuesday, 28 April

    2020 Event begins at 10:00 AM EDT Welcome
  2. Get acquainted with WebEx Events, while we give others a

    five extra minutes to join. Welcome Mapping for Global Health; a MapGive Mapathon
  3. HEALTH MAPPING AND FOREIGN POLICY Joshua Glasser Foreign Affairs Officer

    Office of International Health and Biodefense U.S. Department of State
  4. WHY MAP PUBLIC HEALTH? ▶ Public health is concerned with

    both risks and outcomes for populations ▶ RISKS (e.g., flooding, extreme heat, mosquito infestation) are mappable ▶ So are OUTCOMES (e.g., life expectancy, disease clusters) ▶ Maps often show these patterns much more cleanly and intuitively than other data visualization or communication tools
  5. WHY USE HEALTH MAPS IN FOREIGN POLICY? ▶ Risk maps

    help predict areas of concern and target resources where need is greatest ▶ Allocation and prioritization ▶ Key in addressing issues such as dengue where control options are available but invasive ▶ Outcome maps help identify where different populations are on the outbreak curve – ▶ Monitoring and forecasting ▶ Key in COVID-19 because different regions are going through the phases at different times
  6. WATCH FOR! ▶ It’s critical for the mapmaker to decide

    early on a target audience and analytic goal ▶ Otherwise, the map gets too “busy” ▶ True for all maps but doubly so for policy ▶ In foreign policy especially: ▶ Policy makers not usually steeped in technical details ▶ Minimal time to analyze ▶ May be making high profile decisions
  7. BEGIN WITH THE END IN MIND ▶ The mapmaker should

    consider at the outset: ▶ Who they *want* to read the map (and who *will* read it) ▶ What data they want to convey ▶ How to convey it parsimoniously and completely
  8. National Institutes of Health • U.S. Department of Health and

    Human Services Mapping for Public Health: Past, present and future John Balbus, MD, MPH Senior Advisor for Public Health, National Institute of Environmental Health Sciences Director, NIEHS-WHO Collaborating Centre for Environmental Health Sciences MapGive Mapation Washington, DC April 29, 2020
  9. National Institutes of Health U.S. Department of Health and Human

    Services © Can Stock Photo Inc. / stanciuc
  10. National Institutes of Health U.S. Department of Health and Human

    Services John Snow, Cholera and the Origins of Epidemiology • Dr. John Snow (1813-1858) • August, 1854: explosive outbreak of cholera in Soho District of London • Snow mapped cases and noted sources of water by door to door survey • Data collected: – Deaths, with time of onset of symptoms – Water source – Perceived impurities in the water
  11. National Institutes of Health U.S. Department of Health and Human

    Services “Epidemic Curve”- Broad Street Pump, 1854 http://sphweb.bumc.bu.edu/otlt/MPH-Modules/EP/EP713_DescriptiveEpi/EpidemicCurve_Cholera.gif
  12. National Institutes of Health U.S. Department of Health and Human

    Services The “Broad Street Pump” of COVID-19?
  13. National Institutes of Health U.S. Department of Health and Human

    Services Epidemic Curves from Wuhan, 2020 https://www.nejm.org/doi/full/10.1056/NEJMoa200131 6 https://www.economist.com/graphic-detail/2020/02/12/a-ray-of-h ope-in-the-coronavirus-curve
  14. National Institutes of Health U.S. Department of Health and Human

    Services Combining Remote Sensing and Ground Truthing https://www.politico.eu/interactive/the-global-effort-to-ex pand-healthcare-facilities-seen-from-space/
  15. National Institutes of Health U.S. Department of Health and Human

    Services New York, Sao Paolo, Cape Town, Lagos- Temporary Health Facilities
  16. National Institutes of Health U.S. Department of Health and Human

    Services In search of precision Public Health… *
  17. National Institutes of Health U.S. Department of Health and Human

    Services How do mapping and observations inform environmental public health 150 years later? • Residence/demography • Bio/Physical exposures • Temperature, flooding, soil moisture • Chemical exposures • Point sources, air pollution • Land use and built environment characterization • Remote ocean and air teleconnections
  18. National Institutes of Health U.S. Department of Health and Human

    Services Opportunities for improved health through integrated earth observations and mapping • Enhanced prediction of epidemics, pandemics, seasonal variations in disease • Enhanced identification of local sources of hazardous exposures • Enhanced geolocation of vulnerable people in proximity to hazards • Identification of vulnerable health infrastructure
  19. National Institutes of Health • U.S. Department of Health and

    Human Services http://www.niehs.nih.gov/geh
  20. HOT is working towards a world where... • Everyone is

    counted • Map data is accessible and used in decisions that save and improve lives • Everyone can engage and contribute to the map With the Covid-19 crisis, this has never been more needed.
  21. 34 Lack of maps hinder ability to respond to healthcare

    issues Response to COVID-19 includes: • Testing • Treatment • Contact tracing This means a need for: 1. Disaggregated data on where the most vulnerable live (e.g. population aged 60+, populations likely to be immunocompromised such as HIV/AIDS)* 2. Missing data on health infrastructure such as facilities, testing sites, pharmacies, laboratories, etc. 3. Place names and administrative boundaries *taking into account responsibility not to expose individuals
  22. Priority 1: Help government agencies and responders Priority 2: Identify

    populations most at risk Priority 3: Increase map creation in at risk locations What we’re doing
  23. HOT’s COVID-19 response started in Cusco, Peru Why is mapping

    needed Ministry of Health needed to know where to prioritize aid distribution based on lockdown measures and assess household surveying/distribution.
  24. HOT was able to: ➔ provide GIS analysis to prioritize

    aid distribution ➔ facilitate remote mapping to complete the basemap ➔ provide technical support and training At the request of regional government in Cusco...
  25. Supporting COVID-19 response in Gaborone, Botswana Why is mapping needed

    Botswana Institute of Geomatics is requesting basemap completion for their COVID response dashboard used by the Government of Botswana. Critical to public health Completing the map in Botswana will help fight ongoing health crises incl. malaria & HIV/AIDS
  26. THANK YOU FOR MAPPING! Feel free to continue mapping on

    your own and reach out to [email protected] with any questions!
  27. Cities Navigator Your city at your fingertips Cities Navigator A

    platform to improve communication, access to information, essential products and services during emergencies Dr. Gaston Mbonglou Follow us
  28. Page ▪ The Secondary Cities experience ▪ The Cameroon Challenge

    ▪ The Solution ▪ The Douala Model ▪ The Cities Navigator platform Sommaire
  29. Page The Secondary Cities Experience Launched by the United States

    Department of State, the secondary cities project was set up to respond to the problems of urban resilience in large metropolitan areas with a high population density and a high rate of urbanization. ▪ The city of Douala was selected for this project in 2016 ▪ UASG Advisors (a local startup at the Incubation Center of the University of Yaounde I, Cameroon), in partnership with the University of Douala, the US Cameroon Chamber of Commerce, the University of Colorado and Hawkai Data worked on the development of a GIS application for the management of communication, information and access to services.
  30. Page The Cameroon Challenge an Impact on Douala …. It

    comes down to three (3) things: Streamlined communication to ensure citizens are secure and have access to reliable information that enable them to be prepared and deal with the impact of the emergency at hand Keep cities running during periods of reduced mobility/confinement to mitigate the impact of the emergency Ensure ease of access to essential services and products Managing emergencies in cities with rapid urbanization and population growth rate Population growth 2002:17,4 millions 2019:~25,88 millions Rate of urbanization 2019: 56,37% 2050: 70% [Worldbank-2019]
  31. Page … The Solution … It is about the 3

    Pillars: Information, Communication, Access to Services & Products Provide reliable information at the national, regional and local levels Communicate in real time at the national, regional and local levels Facilitate access to essential services and products.
  32. Page The Douala Model Communication Education Shelter and Services Health

    and Medical Water & Sanitation Road Network Energy Religious Open Space Solid Waste Shopping Government Public safety Transportation Resiliency Management & Services Apps In-depth data collection Data organization
  33. Page The Douala Model Collect data, build the foundation for

    a “digital City” and stimulate innovation for incubators and startups to create service apps. Transport ▪ Navigation ▪ Accident analysis ▪ Urban transit Utilities Planning / mapping of Telecommunication networks Water network Energy distribution City management ▪ Urban planning ▪ Garbage collection ▪ Disaster Management Health ▪ Map of hospitals ▪ Diseases map Business et finances ▪ Business location map ▪ Points of Interest Education ▪ Map of schools ▪ Map of colleges Police et Firefighters ▪ Crime Map ▪ Accidents map 2C/ OC Resiliency Management & Services Apps
  34. Page Cities Navigator Platform Information, Communication, Access to Services and

    Products Emergency management – Help citizens prepare for crises like flooding or pandemics like COVID-19 – Share steps and actions to help citizens prepare and navigate through an emergency. Navigation et Simulation Integrated navigation, simulation of emergency routes, mapping of shelters and other information based on the different categories of human geography. Communication Intuitive interface to launch alerts and messages to the population at the national, regional and city levels. Access to the app is free and it works on Android and IOS devices. Cartographie de services Unique capabilities that allow companies and service providers like hospitals, pharmacies, service stations, etc. to display the availability of their services or products in real time on a city map… leveraging OSM.
  35. Page Launch the app View app menu Select your city

    Save profile info Getting Started – Setup your City & Profile
  36. Page Open dashboard Add a new location New location info

    Location on the map Add New Service Location
  37. Page The Secondary Cities Experience The Cities Navigator platform is

    an enabling tool for governments and cities during emergencies! Business Intelligence (Realtime data capture, reports and stats across 14 categories of Human Geography) Communication Mast Antenna POS Education K-12, Colleges Privat/Public Shelter (Y/N) Students Tuition Success rate Shelter and Services Type Privat/Public Capacity Power Water Street access Health & Medical Privat/Pu blic Diseases Beds Specializati ons Doctors Nurses Pharmacies Pharmacist s Products/S vc Water & Sanitation Wells Privat/Public Energy Mast Type Religious Church Capacity Shelter (Y/N) Solid Waste Trash Collection Shopping Type Product availability Public safety Police station Staff Cars on street Potholes Street lights Accidents
  38. Mapping for Global Health; a MapGive Mapathon Tuesday, 28 April

    2020 Event ends approximately noon EDT Thank you