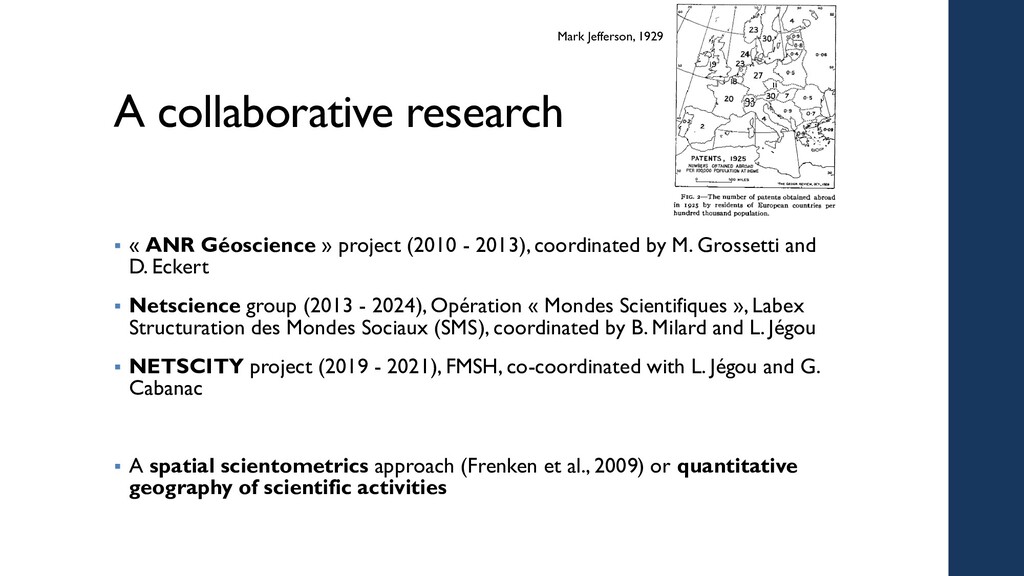
- 2013), coordinated by M. Grossetti and D. Eckert Netscience group (2013 - 2024), Opération « Mondes Scientifiques », Labex Structuration des Mondes Sociaux (SMS), coordinated by B. Milard and L. Jégou NETSCITY project (2019 - 2021), FMSH, co-coordinated with L. Jégou and G. Cabanac A spatial scientometrics approach (Frenken et al., 2009) or quantitative geography of scientific activities Mark Jefferson, 1929
collectives, communities or research movements disciplines the scientific activity Geographic spaces local systems national systems of research circulation spaces or diaspora the macro-regions and the world
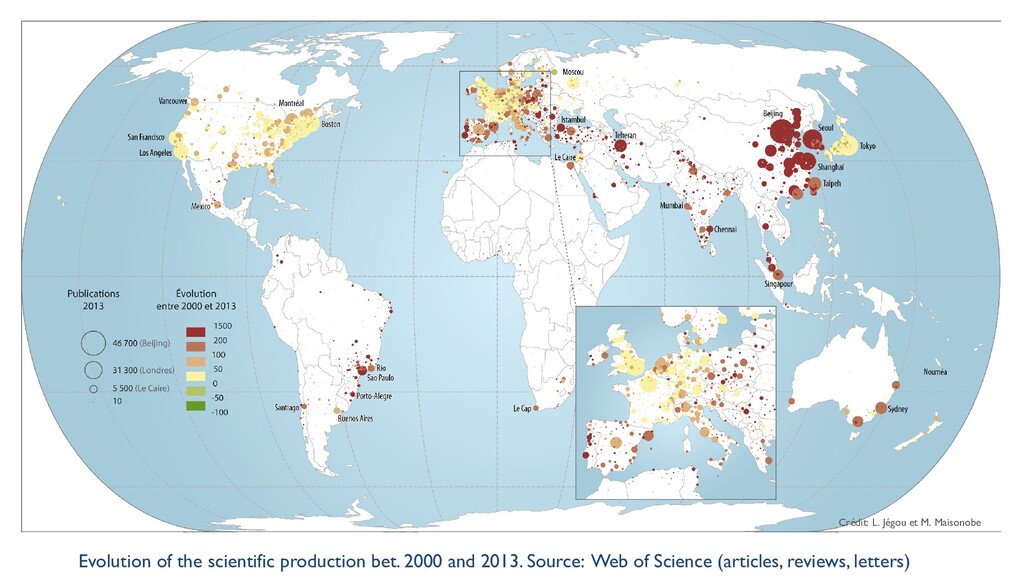
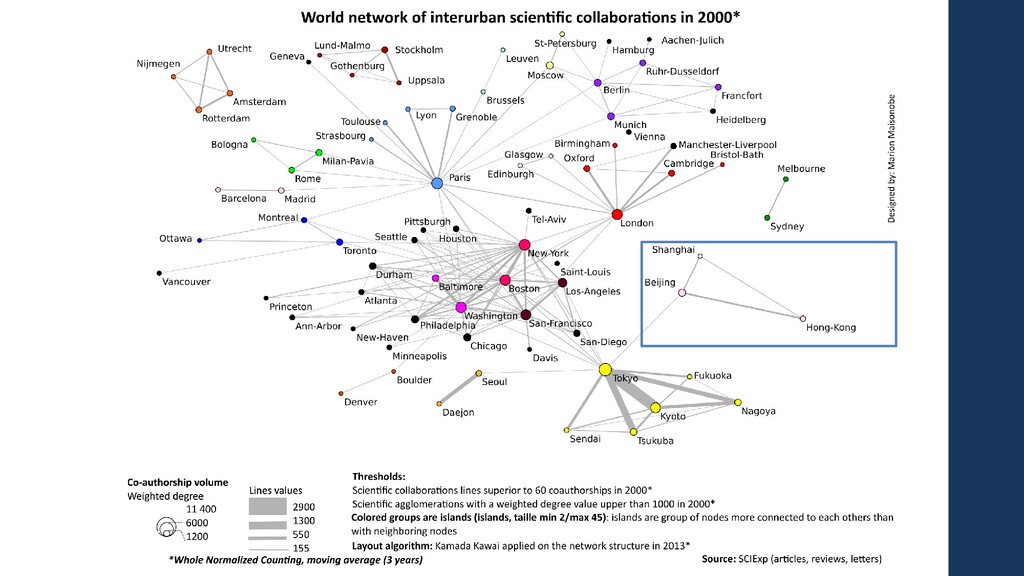
The spatial deconcentration of research activity (production, collaboration, visibility) The densification of the world network of collaboration between cities
roles of universities Belief in a tendency for spontaneous concentration of research forces in places of scientific excellence (invisible hand). Over the last decade, do we assist to a concentration of: 1. World scientific production? (production share of the main hubs) 2. Scientific collaborations? (centrality of the main hubs) 3. Scientific visibility? (share of citations received by the main hubs)
of publications/urban area/year • 2. Scientific collaboration Number of scientific co-authorships between urban areas/year 3. Scientific visibility Number of citations (3-year windows)/urban area/year
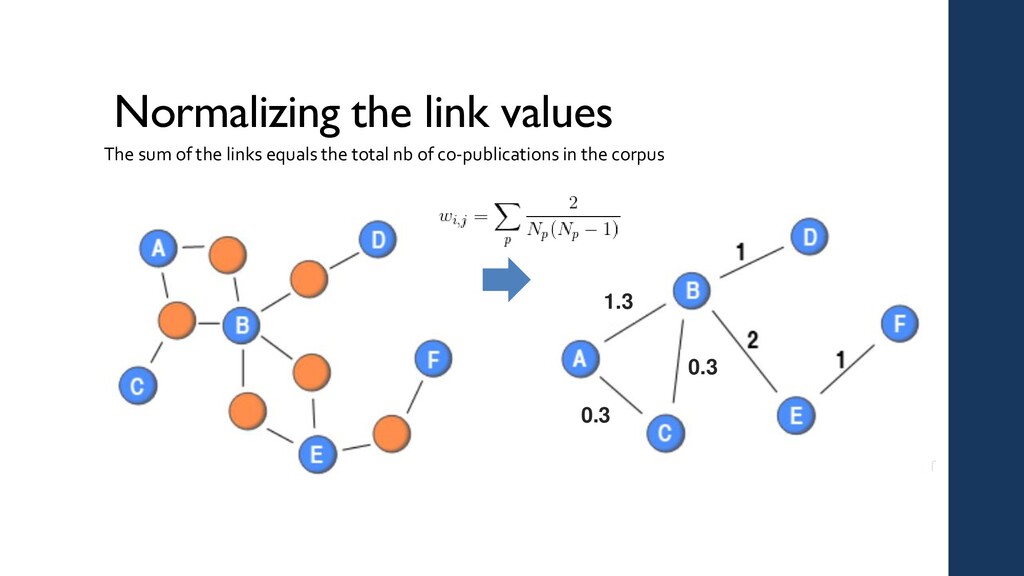
publication data (Clarivates Analytics – OST/HCERES) clustered by urban areas (Maisonobe et al., 2018) 19 millions of publications between 1999 and 2014 • Whole normalized counting (Gauffriau et al., 2008) and 3-year average • Number of publications and co-authorship links between 1999 and 2014 + citations received by all the 1999-2011 publications over a three-year window for 2011 publications, we looked at the number of citations received as of 2014 (the last year considered by this study)
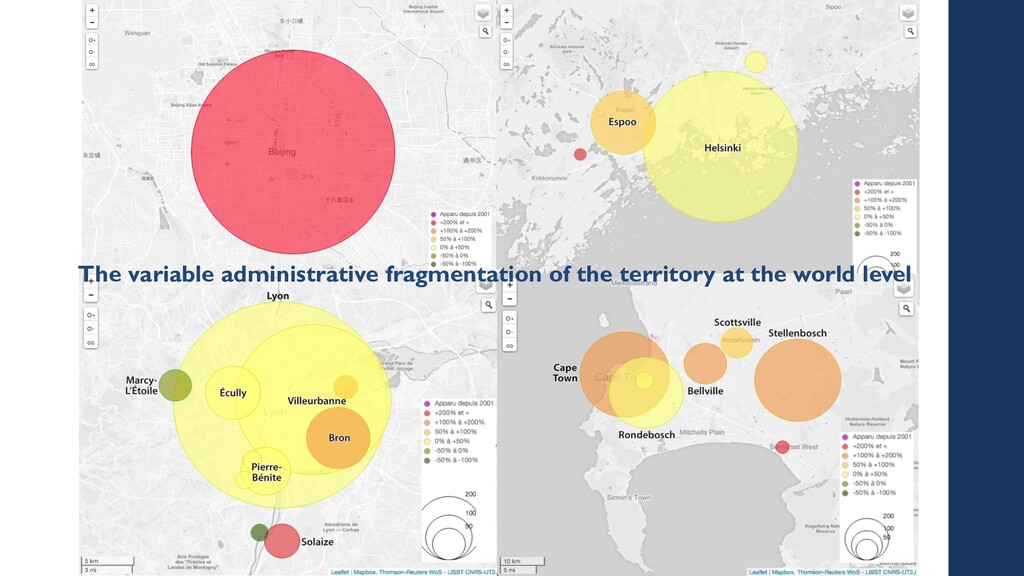
scale and at the urban area resolution level Localising the municipalities from which researchers are signing their publications Building urban areas’ perimeters using the distribution of population density Washington - Baltimore
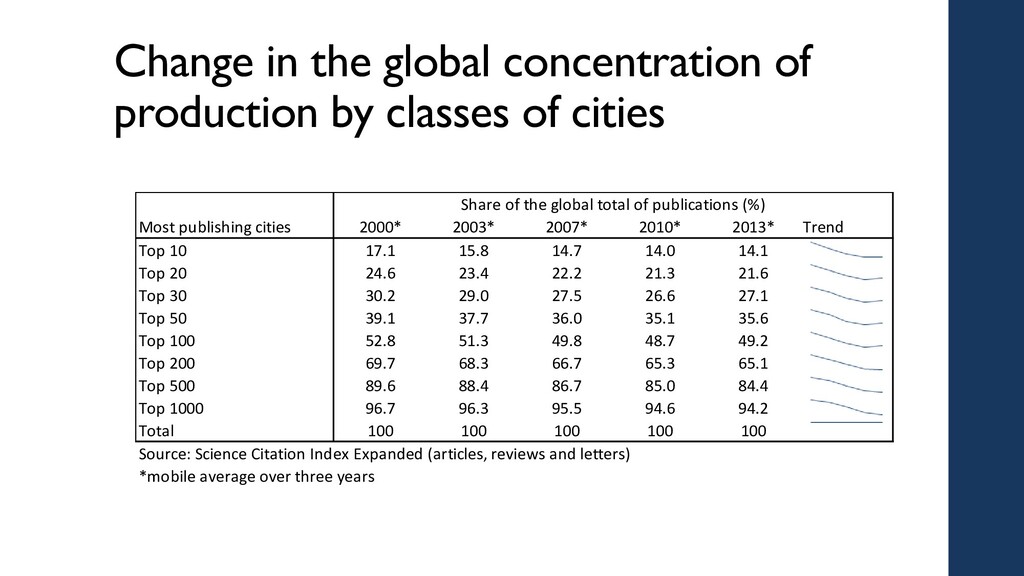
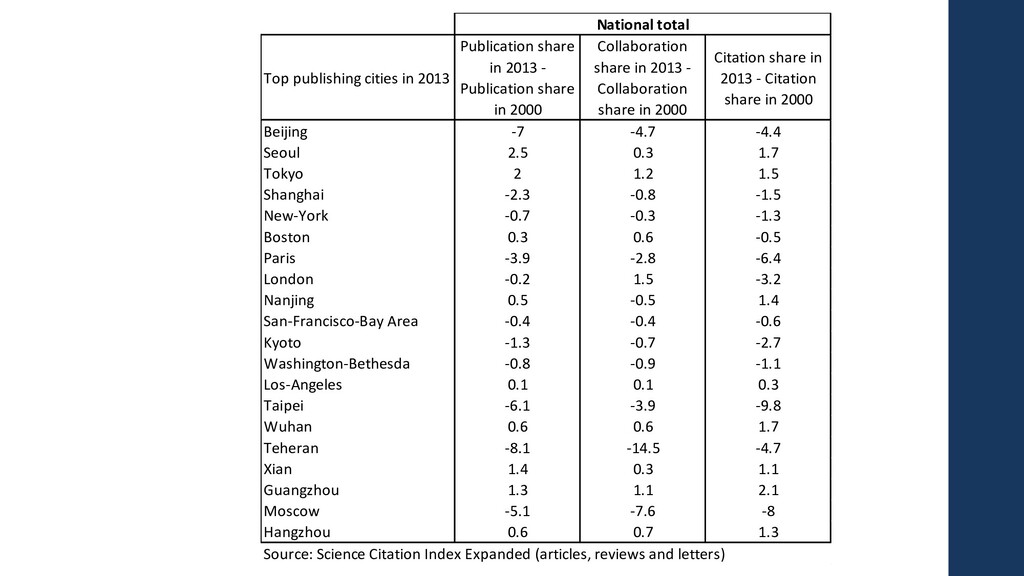
cities Most publishing cities 2000* 2003* 2007* 2010* 2013* Trend Top 10 17.1 15.8 14.7 14.0 14.1 Top 20 24.6 23.4 22.2 21.3 21.6 Top 30 30.2 29.0 27.5 26.6 27.1 Top 50 39.1 37.7 36.0 35.1 35.6 Top 100 52.8 51.3 49.8 48.7 49.2 Top 200 69.7 68.3 66.7 65.3 65.1 Top 500 89.6 88.4 86.7 85.0 84.4 Top 1000 96.7 96.3 95.5 94.6 94.2 Total 100 100 100 100 100 Share of the global total of publications (%) Source: Science Citation Index Expanded (articles, reviews and letters) *mobile average over three years
cities Most co-authoring cities 2000* 2003* 2007* 2010* 2013* Trend Top 10 15.6 14.7 13.7 12.9 12.8 Top 20 22.7 21.7 20.2 19.4 19.2 Top 30 28.3 27.1 25.5 24.5 24.3 Top 50 36.9 35.6 33.8 32.7 32.5 Top 100 50.9 49.2 47.0 45.6 45.3 Top 200 67.7 65.8 63.8 62.2 61.6 Top 500 88.0 86.6 84.6 82.7 81.8 Top 1000 95.8 95.1 94.0 92.9 92.4 Total 100 100 100 100 100 Share of the global total of collaborations (%) Source: Science Citation Index Expanded (articles, reviews and letters) *mobile average over three years
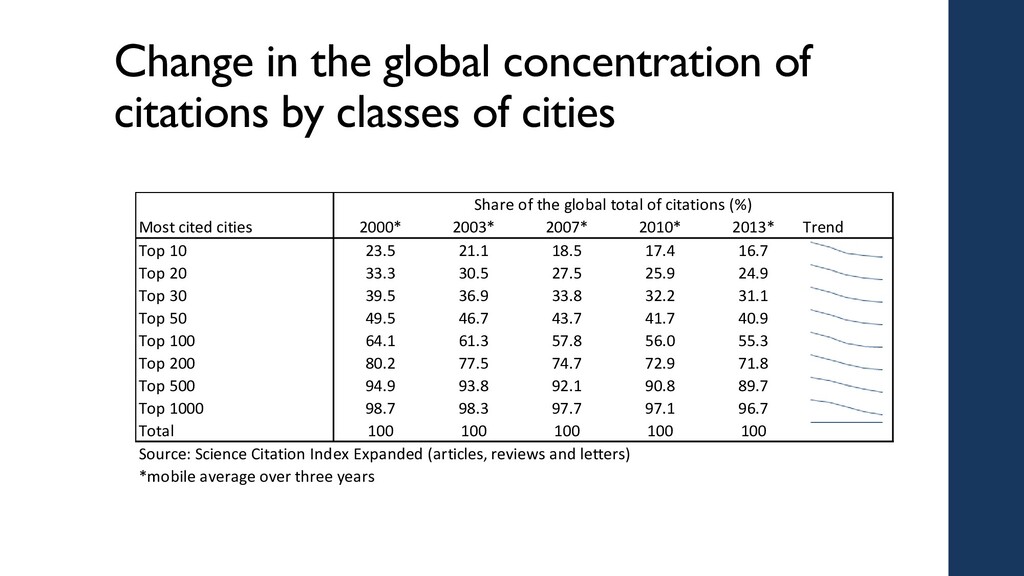
cities Most cited cities 2000* 2003* 2007* 2010* 2013* Trend Top 10 23.5 21.1 18.5 17.4 16.7 Top 20 33.3 30.5 27.5 25.9 24.9 Top 30 39.5 36.9 33.8 32.2 31.1 Top 50 49.5 46.7 43.7 41.7 40.9 Top 100 64.1 61.3 57.8 56.0 55.3 Top 200 80.2 77.5 74.7 72.9 71.8 Top 500 94.9 93.8 92.1 90.8 89.7 Top 1000 98.7 98.3 97.7 97.1 96.7 Total 100 100 100 100 100 Share of the global total of citations (%) Source: Science Citation Index Expanded (articles, reviews and letters) *mobile average over three years
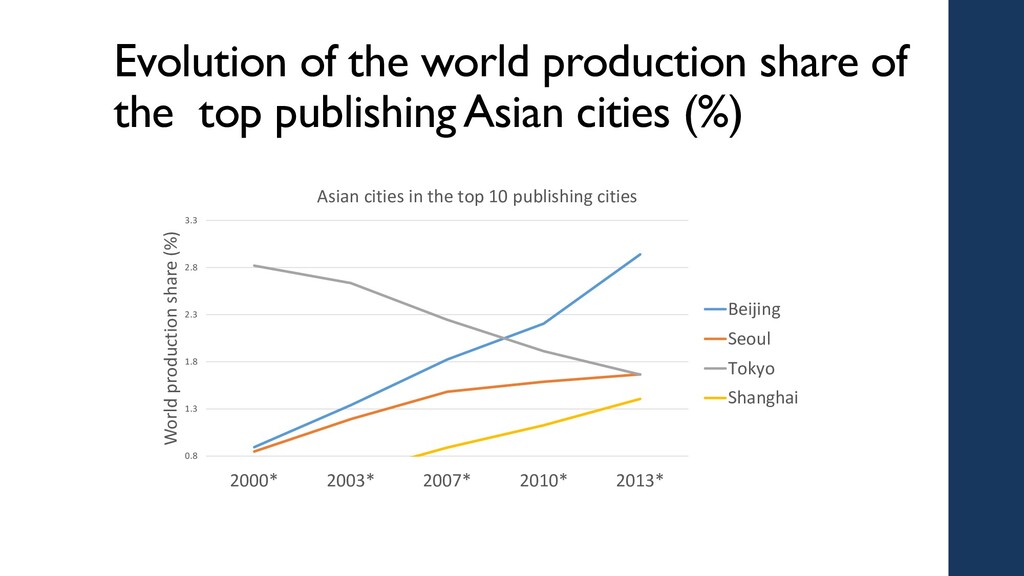
cities (%) 0.8 1.3 1.8 2.3 2.8 3.3 2000* 2003* 2007* 2010* 2013* World production share (%) Asian cities in the top 10 publishing cities Beijing Seoul Tokyo Shanghai
non-Asian cities (%) 0.8 1 1.2 1.4 1.6 1.8 2 2000* 2003* 2007* 2010* 2013* World production share (%) Non-Asian cities in the top 10 publishing cities New-York London Boston Paris San-Francisco-Bay Area Washington out in 2008
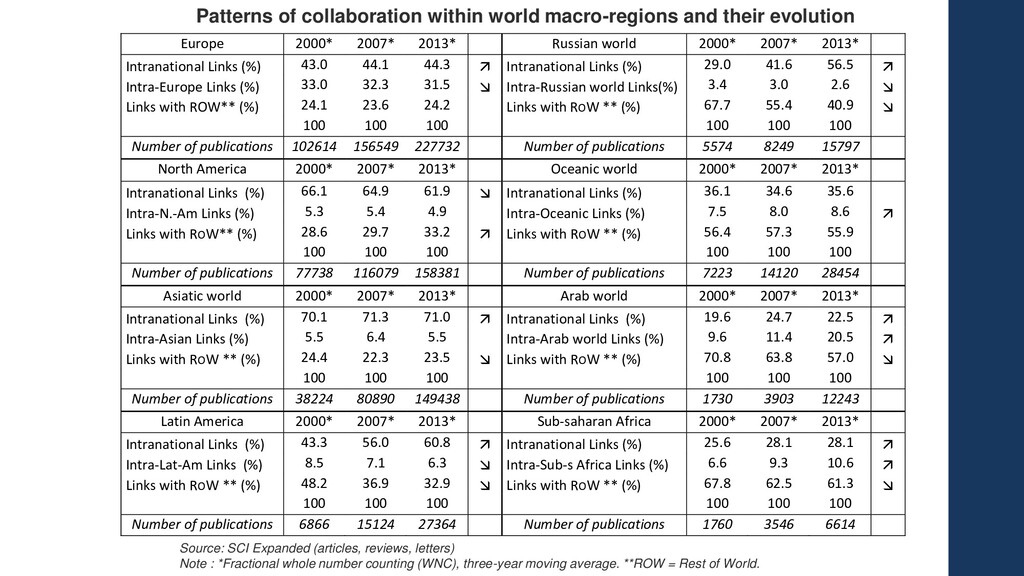
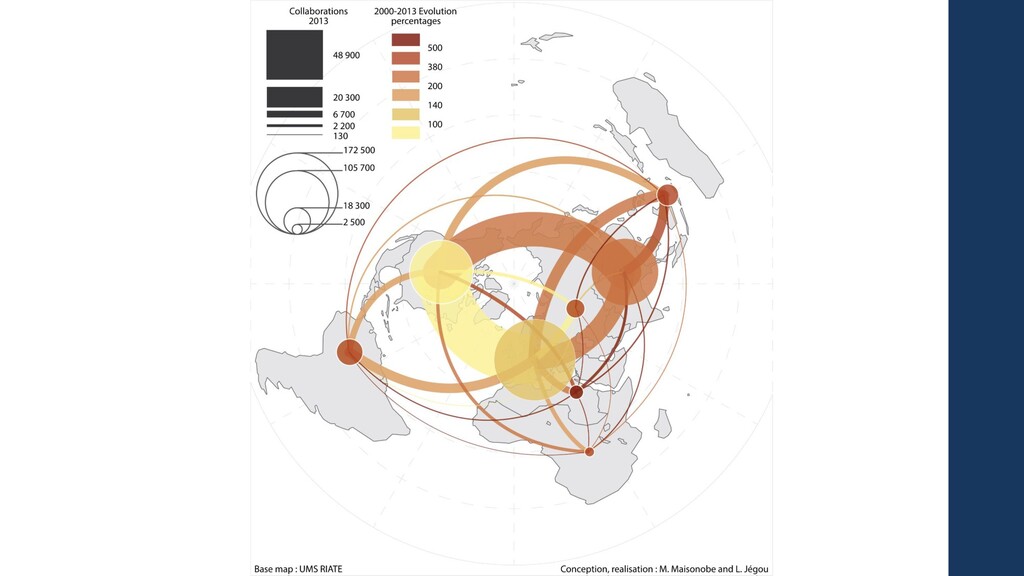
Is the globalisation of scientific production activities accompanied by : • the disappearance of national contexts in favour of global cooperation networks... • ...OR, on the contrary, a maintenance of the structuring character of national and macro- regional areas in the way collaboration organises?
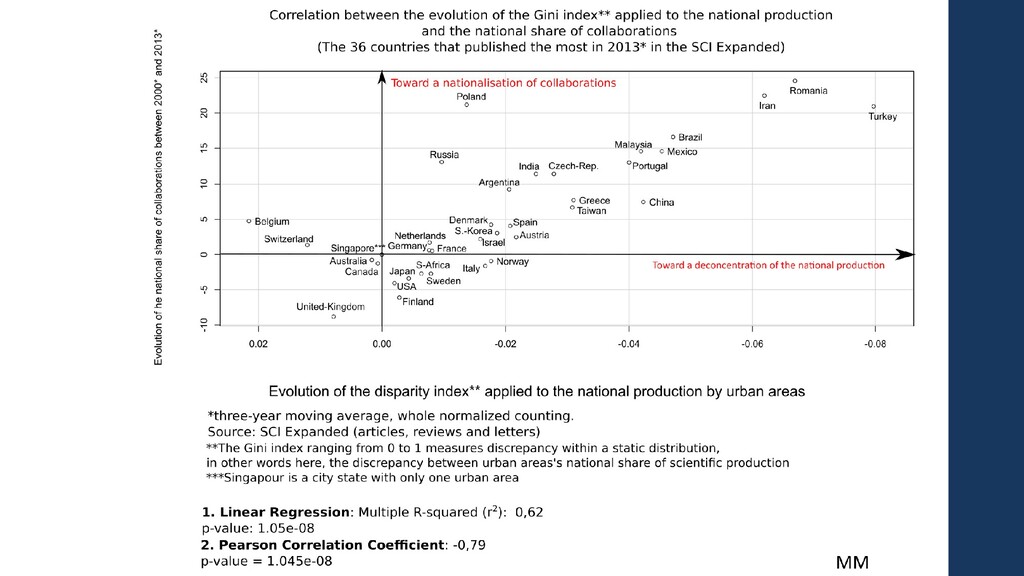
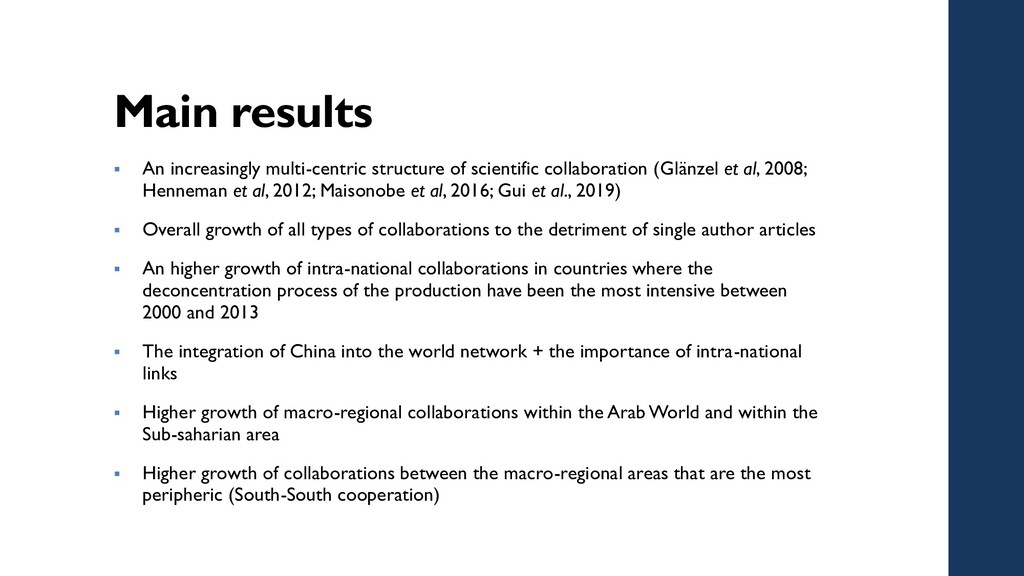
(Glänzel et al, 2008; Henneman et al, 2012; Maisonobe et al, 2016; Gui et al., 2019) Overall growth of all types of collaborations to the detriment of single author articles An higher growth of intra-national collaborations in countries where the deconcentration process of the production have been the most intensive between 2000 and 2013 The integration of China into the world network + the importance of intra-national links Higher growth of macro-regional collaborations within the Arab World and within the Sub-saharian area Higher growth of collaborations between the macro-regional areas that are the most peripheric (South-South cooperation)
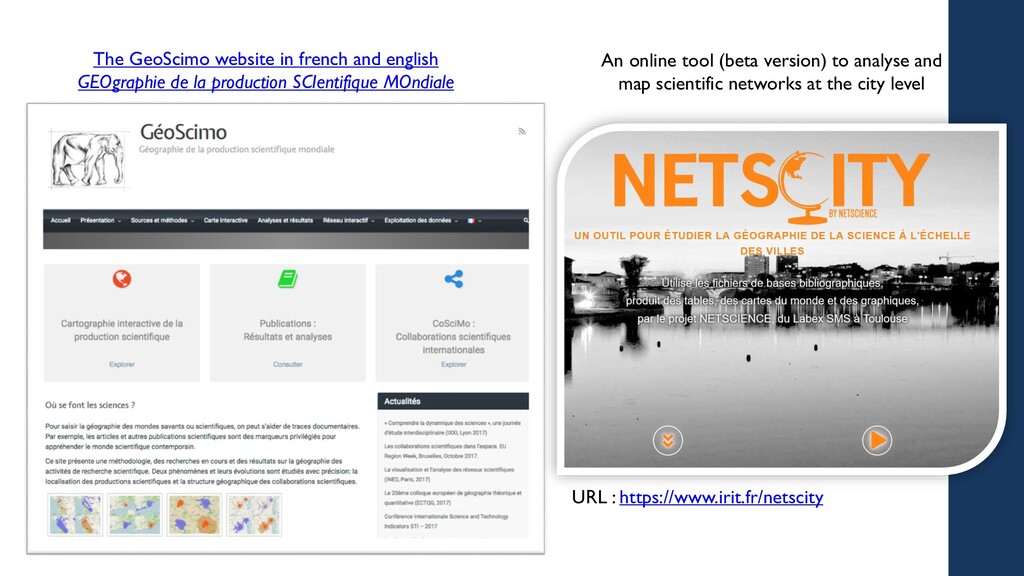
production SCIentifique MOndiale URL : https://www.irit.fr/netscity An online tool (beta version) to analyse and map scientific networks at the city level
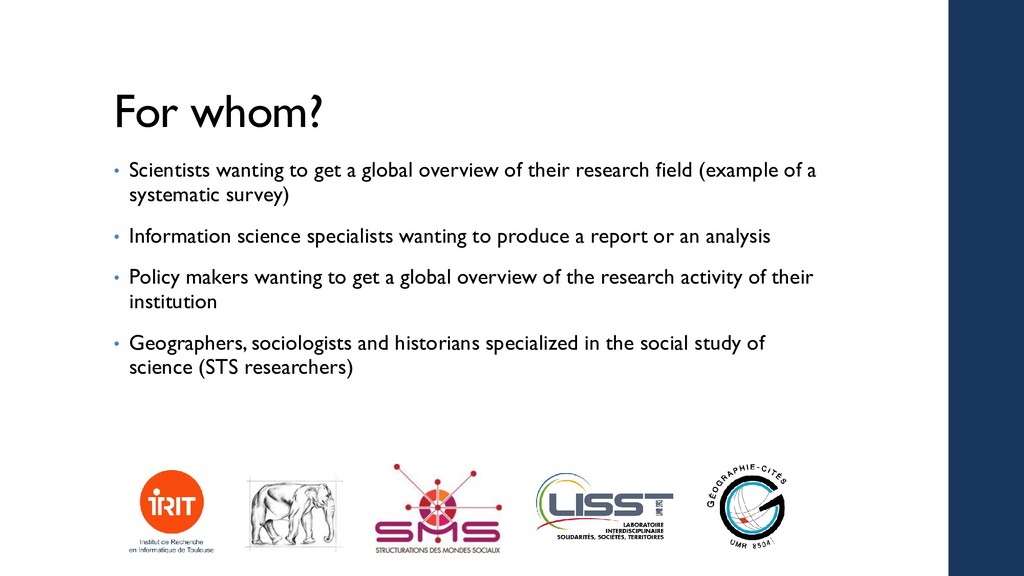
of their research field (example of a systematic survey) • Information science specialists wanting to produce a report or an analysis • Policy makers wanting to get a global overview of the research activity of their institution • Geographers, sociologists and historians specialized in the social study of science (STS researchers)
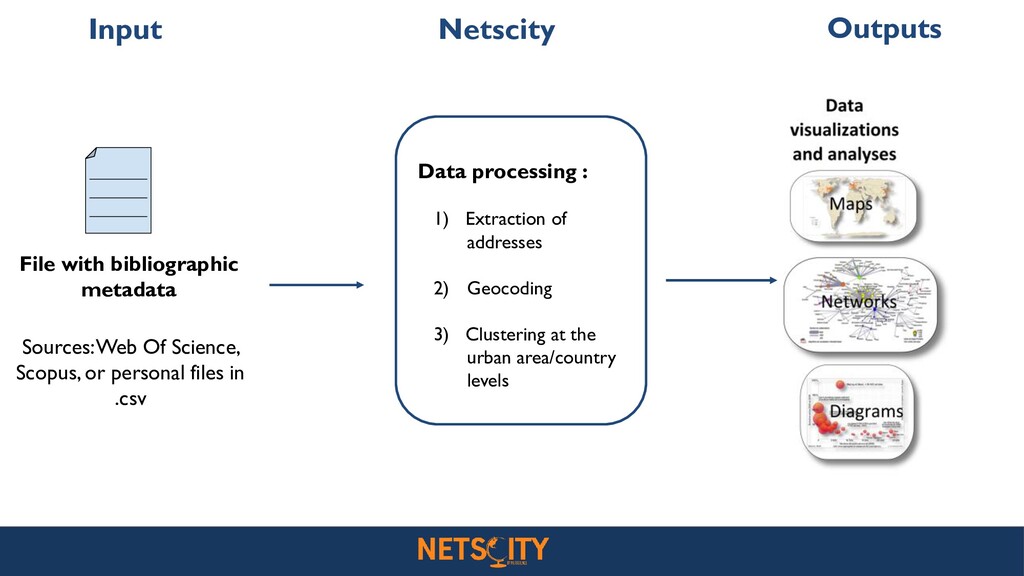
Clustering at the urban area/country levels File with bibliographic metadata Sources: Web Of Science, Scopus, or personal files in .csv Input Netscity Outputs • Cartes • Tables • Fichier d’export Contexte
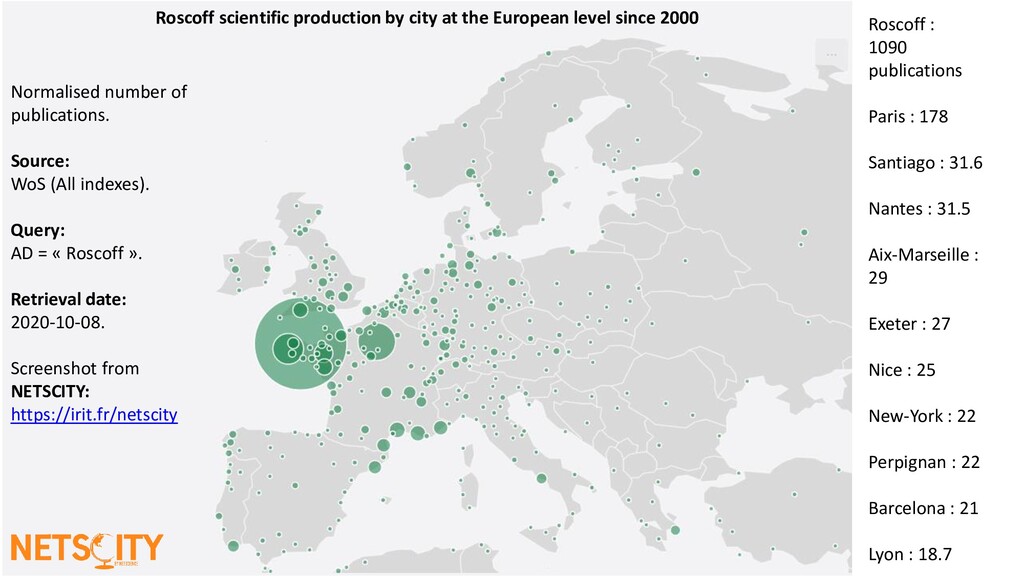
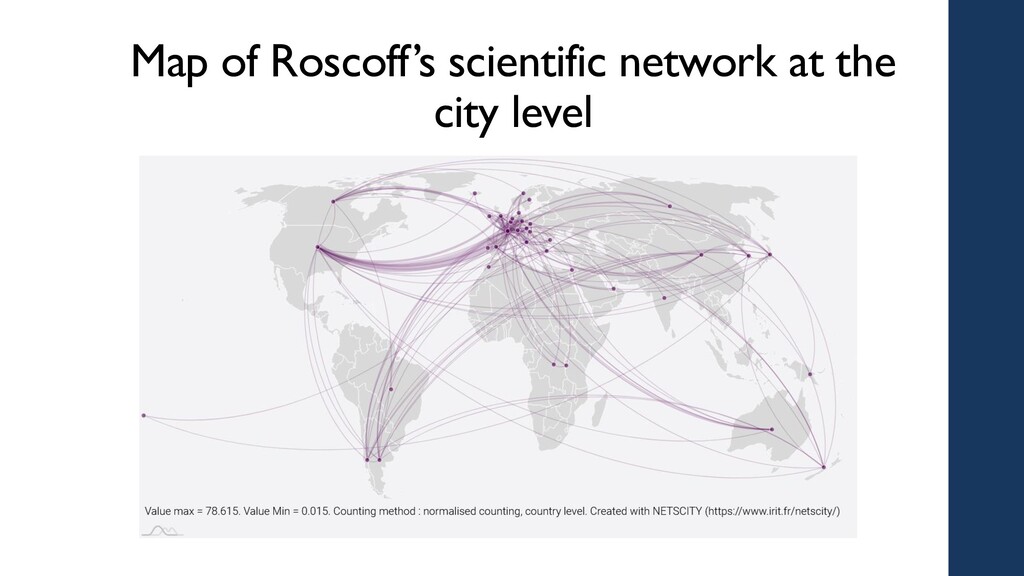
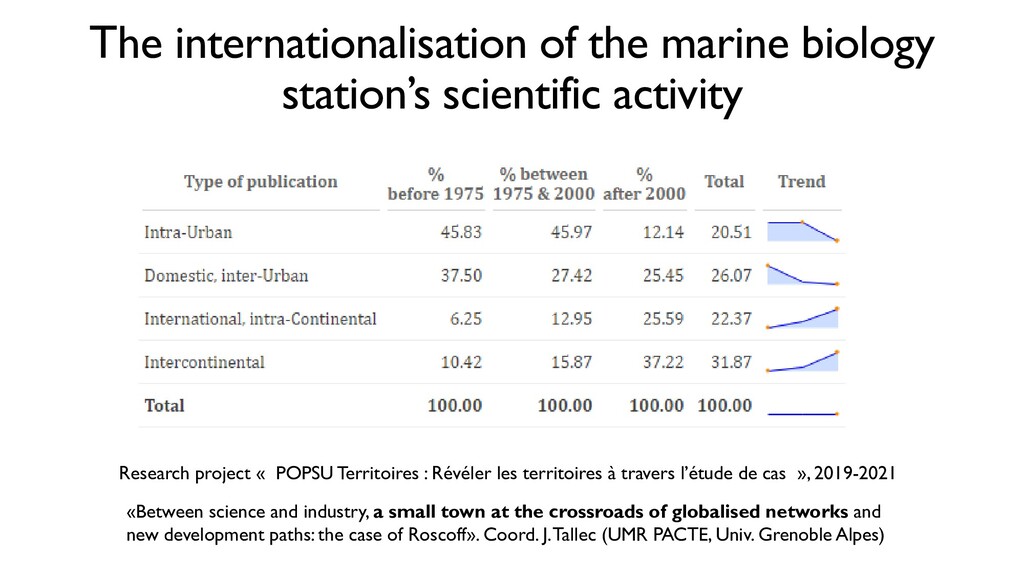
project « POPSU Territoires : Révéler les territoires à travers l’étude de cas », 2019-2021 «Between science and industry, a small town at the crossroads of globalised networks and new development paths: the case of Roscoff». Coord. J. Tallec (UMR PACTE, Univ. Grenoble Alpes)
and Guillaume Cabanac. 2020. ‘Spatial Organisation of French Research from the Scholarly Publication Standpoint (1999-2017): Long-Standing Dynamics and Policy-Induced Disorder’. EPJ Web Conf. 244. doi: 10.1051/epjconf/202024401005. Maisonobe, Marion, Laurent Jégou, Nikita Yakimovich, and Guillaume Cabanac. 2019. ‘NETSCITY: A Geospatial Application to Analyse and Map World Scale Production and Collaboration Data between Cities’. in ISSI’19: 17th International Conference on Scientometrics and Informetrics. Rome. Maisonobe, Marion, Laurent Jégou, and Guillaume Cabanac. 2018. ‘Peripheral Forces’. Nature Index (563):S18–19. Maisonobe, Marion, Michel Grossetti, Béatrice Milard, Laurent Jégou, and Denis Eckert. 2017. ‘The Global Geography of Scientific Visibility: A Deconcentration Process (1999–2011)’. Scientometrics 113(1):479–93. Maisonobe, M., Grossetti, M., Milard, B., Eckert, D., & Jégou, L. (2016). The global evolution of scientific collaboration networks between cities (1999–2014): Multiple scales. Revue Française de Sociologie, 57(3), 417–441. https://doi.org/10.3917/rfs.573.0417 • ANY QUESTIONS ? Contact: marion.maisonobe<at>cnrs.fr