$30 off During Our Annual Pro Sale. View Details »

Checking Out Checking In: Observations on Foursquare Usage Patterns

Matt J Williams
September 09, 2011
66

Checking Out Checking In: Observations on Foursquare Usage Patterns

Research talk.
Venue: International Workshop on Finding Patterns of Human Behaviours in Network Data and Mobility Data (NEMO), Athens, Greece.

Matt J Williams

September 09, 2011
Tweet

More Decks by Matt J Williams

Transcript

  1. Checking out checking in:
    Observations on Foursquare usage patterns
    International Workshop on Finding
    Patterns of Human Behaviours in
    Network Data and Mobility Data -
    NEMO
    9 Sept 2011
    Martin Chorley, Gualtiero Colombo, Matthew Williams,
    Stuart Allen, Roger Whitaker
    Cardiff University

    View Slide

  2. Motivation
    • Areas of study:
    • Presence of routine (regularity) in mobility
    and encounters
    • Relationship between personality traits and
    mobility behaviour
    • Heterogeneity in individuals’ behaviours

    View Slide

  3. Motivation
    • Appropriate datasets hard to find!
    • In addition to the mobility trace, we want:
    • social graph
    • profiles of individuals
    • properties of the places individuals visit
    • ...and comprehensive coverage of a
    geographic region!

    View Slide

  4. About Foursquare
    • “Location-based online social
    network”
    • Users ‘check-in’ to their current venue
    • Venues are user-contributed
    • Points, “mayorships”, and discounts to
    incentivise participation

    View Slide

  5. World Foursquare usage
    Text
    http://blog.foursquare.com/2011/01/24/2010infographic/

    View Slide

  6. About Foursquare
    visit history
    social graph
    user
    database
    venue
    database
    + category
    hierarchy

    View Slide

  7. Data collection
    Cardiff
    city area: 140 km2
    city population: 341,000

    View Slide

  8. city area: 116 km2
    Data collection
    Cambridge
    city population: 130,000

    View Slide

  9. Collected data
    Foursquare dataset
    Foursquare dataset
    Foursquare dataset
    Foursquare dataset
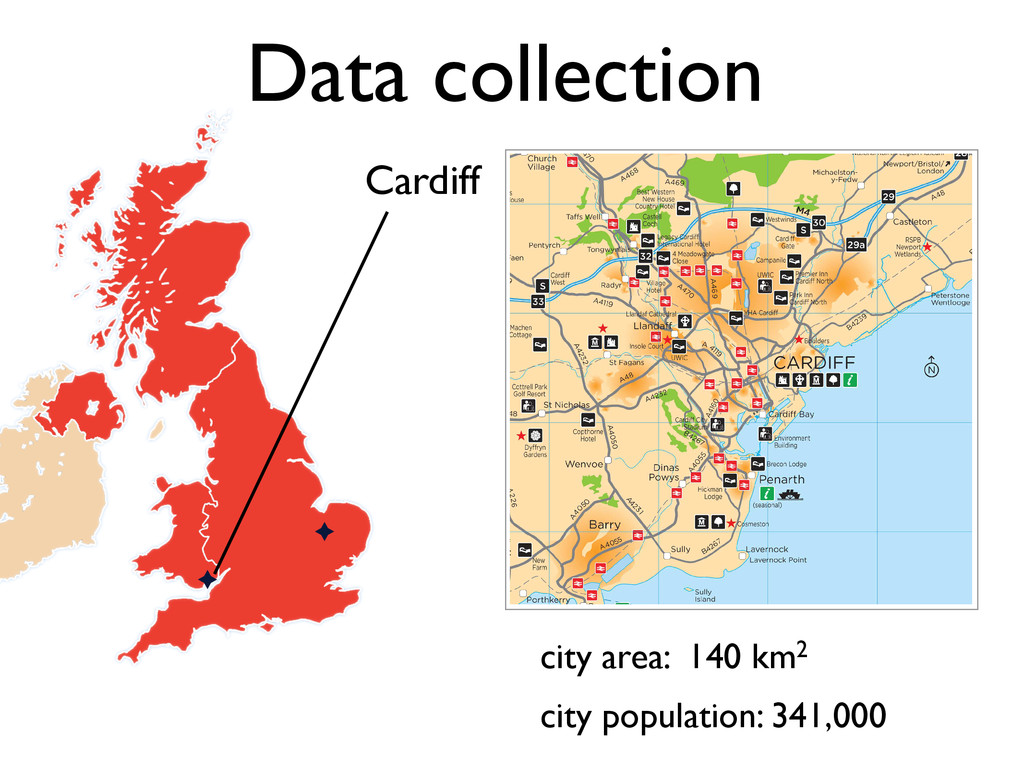
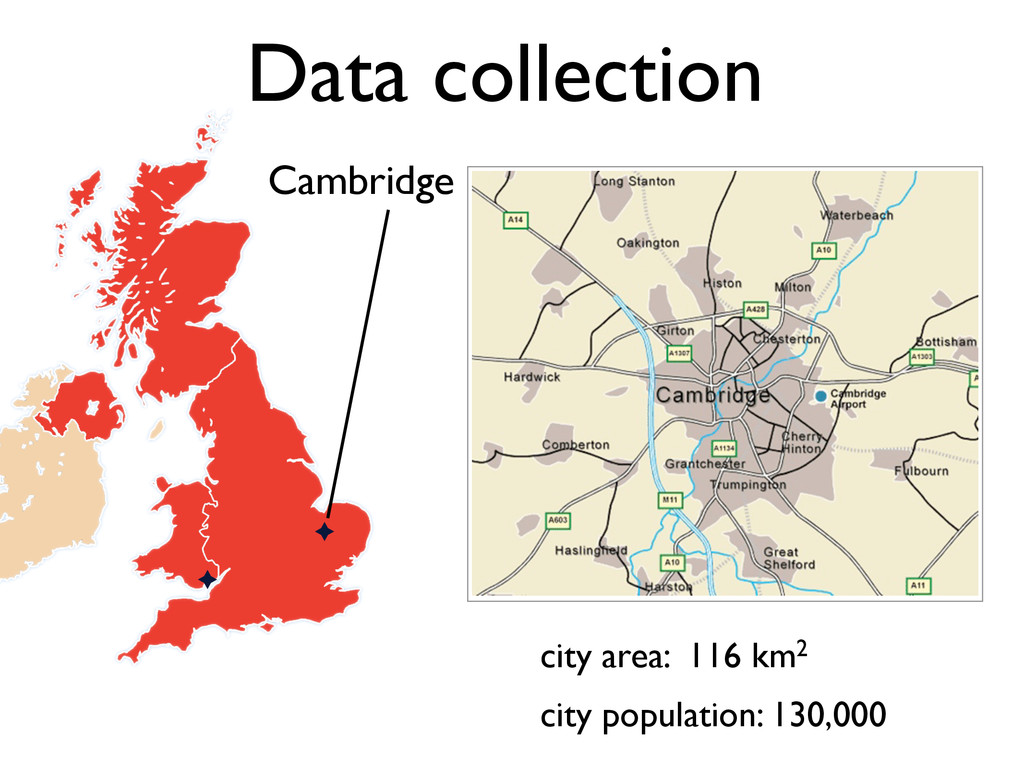
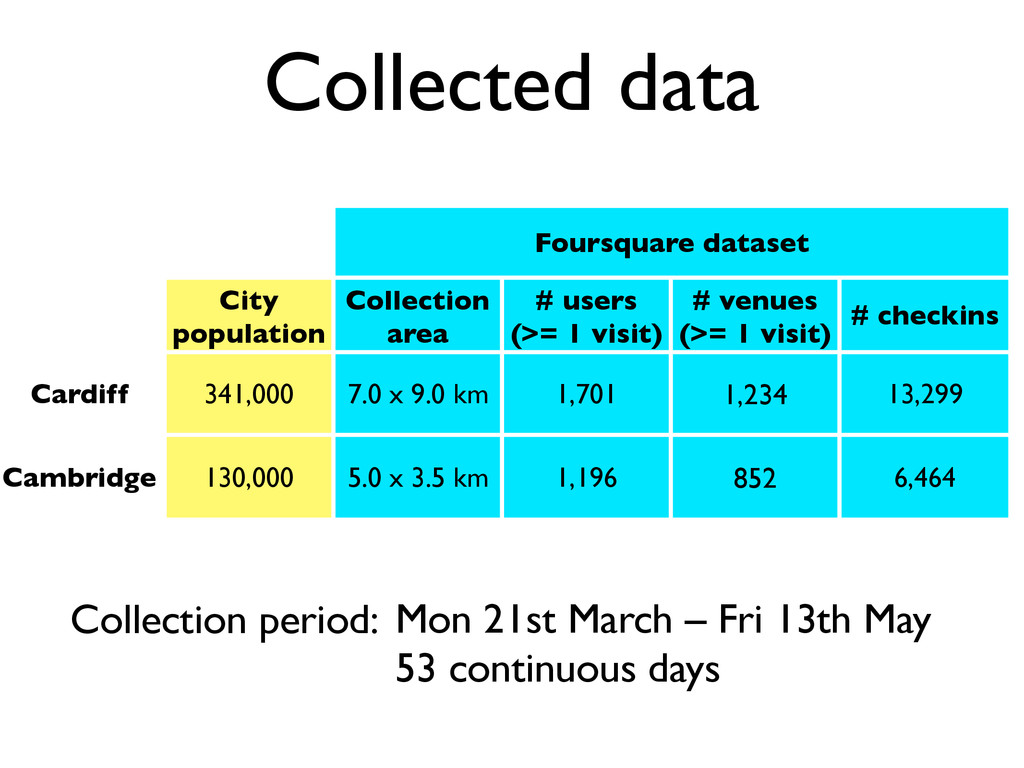
    City
    population
    Collection
    area
    # users
    (>= 1 visit)
    # venues
    (>= 1 visit)
    # checkins
    Cardiff 341,000 7.0 x 9.0 km 1,701 1,234 13,299
    Cambridge 130,000 5.0 x 3.5 km 1,196 852 6,464
    Collection period: Mon 21st March – Fri 13th May
    53 continuous days

    View Slide

  10. Checkins heatmap
    Cardiff Cambridge
    2km
    2km
    fewest
    most

    View Slide

  11. Overview of analysis topics
    • User activity and venue popularity
    • Checkins in time
    • User similarity

    View Slide

  12. User activity and venue
    popularity

    View Slide

  13. User activity
    1 10 100
    Number of Checkins
    1
    10
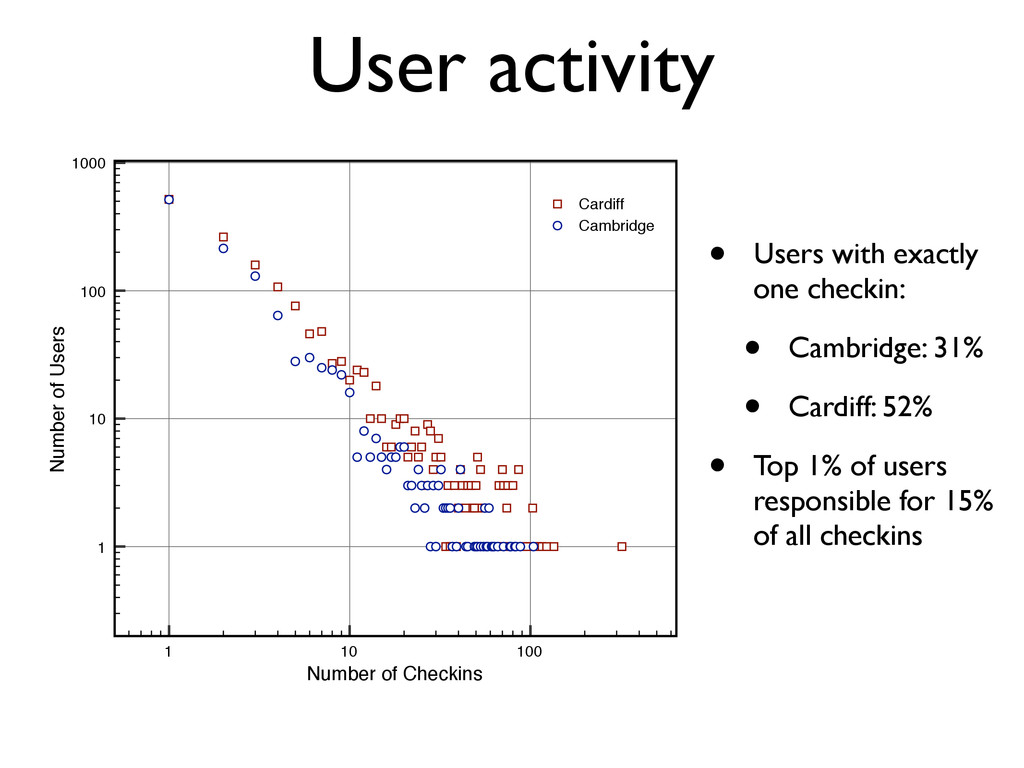
    100
    1000
    Number of Users
    Cardiff
    Cambridge
    • Users with exactly
    one checkin:
    • Cambridge: 31%
    • Cardiff: 52%
    • Top 1% of users
    responsible for 15%
    of all checkins

    View Slide

  14. Venue popularity
    1 10 100
    Number of Checkins
    1
    10
    100
    Number of Venues
    Cardiff
    Cambridge

    View Slide

  15. Checkins in time

    View Slide

  16. Checkins over time
    Cambridge Cardiff
    W T F S S M T W T F S S M T W T F S S M T W T F S S M T W T F S S M T
    W T F S S M T W T F S S M T W T F S S M T W T F S S M T W T F S S M T
    missing data

    View Slide

  17. Checkins per day
    Checkins per day
    Checkins per day
    Weekday Weekend
    Cardiff 246.2 255.5
    Cambridge 123.5 126.0

    View Slide

  18. Weekday checkins:
    Cardiff vs
    Cambridge
    !"
    #!"
    !!'!!"
    !$'!!"
    !%'!!"
    !&'!!"
    !('!!"
    !#'!!"
    !)'!!"
    !*'!!"
    !+'!!"
    !,'!!
    -;<<4=4:">"?91@4/:1A4:" B;
    G/4.D"HID0;;/:" J
    J;"-.D4=;/6" L7
    !"
    #!"
    $!!"
    $#!"
    !!'!!"
    !$'!!"
    !%'!!"
    !&'!!"
    !('!!"
    !#'!!"
    !)'!!"
    !*'!!"
    !+'!!"
    !,'!!"
    $!'!!"
    $$'!!"
    $%'!!"
    $&'!!"
    $('!!"
    $#'!
    -;<<4=4:">"?91@4/:1A4:" B;;0" C
    G/4.D"HID0;;/:" J1=7D<1K4"LM;D:" N
    J;"-.D4=;/6" L7;M:" P/
    !"
    #!"
    $!!"
    $#!"
    %!!"
    %#!"
    !!'!!"
    !$'!!"
    !%'!!"
    !&'!!"
    !('!!"
    !#'!!"
    !)'!!"
    !*'!!"
    !+'!!"
    !,'!!"
    $!'!!"
    $$'!!"
    $%'!!"
    $&'!!"
    $('!!"
    $#'!!"
    $)'!!"
    $*'!!"
    $+'!!"
    $,'!!"
    %!'!!"
    %$'
    -;<<4=4:">"?91@4/:1A4:" B;;0" C/D:">"E9D4/D.19F49D"
    G/4.D"HID0;;/:" J1=7D<1K4"LM;D:" N;F4:"O"3;/5"O"HD74/:"
    J;"-.D4=;/6" L7;M:" P/.@4<"LM;D:"
    % of all checkins in a day
    % of all checkins in a day
    Cardiff
    Cambridge

    View Slide

  19. Weekend checkins:
    Cardiff vs
    Cambridge
    !"
    #!"
    !!'!!"
    !$'!!"
    !%'!!"
    !&'!!"
    !('!!"
    !#'!!"
    !)'!!"
    !*'!!"
    !+'!!"
    !,'!!
    -;<<4=4:">"?91@4/:1A4:" B;
    G/4.D"HID0;;/:" J
    J;"-.D4=;/6" L7
    !"
    #!"
    $!!"
    $#!"
    !!'!!"
    !$'!!"
    !%'!!"
    !&'!!"
    !('!!"
    !#'!!"
    !)'!!"
    !*'!!"
    !+'!!"
    !,'!!"
    $!'!!"
    $$'!!"
    $%'!!"
    $&'!!"
    $('!!"
    $#'!
    -;<<4=4:">"?91@4/:1A4:" B;;0" C
    G/4.D"HID0;;/:" J1=7D<1K4"LM;D:" N
    J;"-.D4=;/6" L7;M:" P/
    !"
    #!"
    $!!"
    $#!"
    %!!"
    %#!"
    !!'!!"
    !$'!!"
    !%'!!"
    !&'!!"
    !('!!"
    !#'!!"
    !)'!!"
    !*'!!"
    !+'!!"
    !,'!!"
    $!'!!"
    $$'!!"
    $%'!!"
    $&'!!"
    $('!!"
    $#'!!"
    $)'!!"
    $*'!!"
    $+'!!"
    $,'!!"
    %!'!!"
    %$'
    -;<<4=4:">"?91@4/:1A4:" B;;0" C/D:">"E9D4/D.19F49D"
    G/4.D"HID0;;/:" J1=7D<1K4"LM;D:" N;F4:"O"3;/5"O"HD74/:"
    J;"-.D4=;/6" L7;M:" P/.@4<"LM;D:"
    Cardiff
    Cambridge
    % of all checkins in a day
    % of all checkins in a day

    View Slide

  20. User similarity

    View Slide

  21. User similarity
    • We treat the fraction of checkins in 
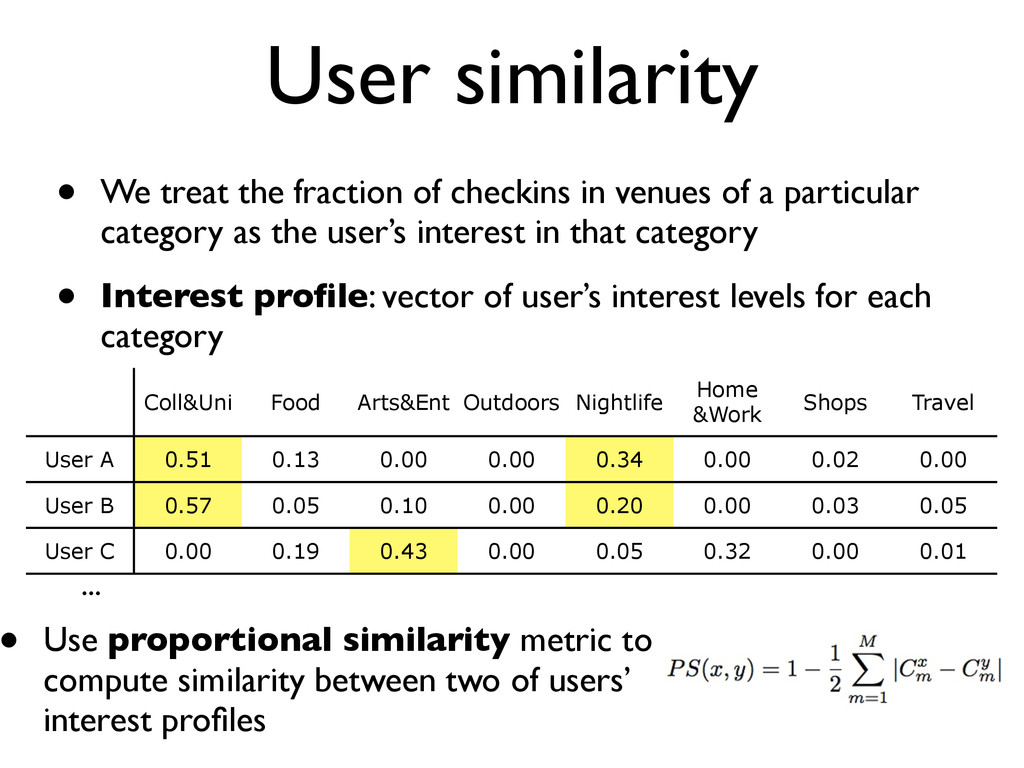
venues of a particular
    category as the user’s interest in that category
    • Interest profile: vector of user’s interest levels for each
    category
    Coll&Uni Food Arts&Ent Outdoors Nightlife
    Home
    &Work
    Shops Travel
    User A 0.51 0.13 0.00 0.00 0.34 0.00 0.02 0.00
    User B 0.57 0.05 0.10 0.00 0.20 0.00 0.03 0.05
    User C 0.00 0.19 0.43 0.00 0.05 0.32 0.00 0.01
    ...
    • Use proportional similarity metric to
    compute similarity between two of users’
    interest profiles

    View Slide

  22. User similarity
    Average proportional
    similarity:
    Friends: 0.19
    All pairs: 0.05

    View Slide

  23. The bad news...
    • Relies on self reporting
    • Users very W.E.I.R.D
    • Users have differing usage styles

    View Slide

  24. Summary
    • Foursquare offers a rich source of data – 
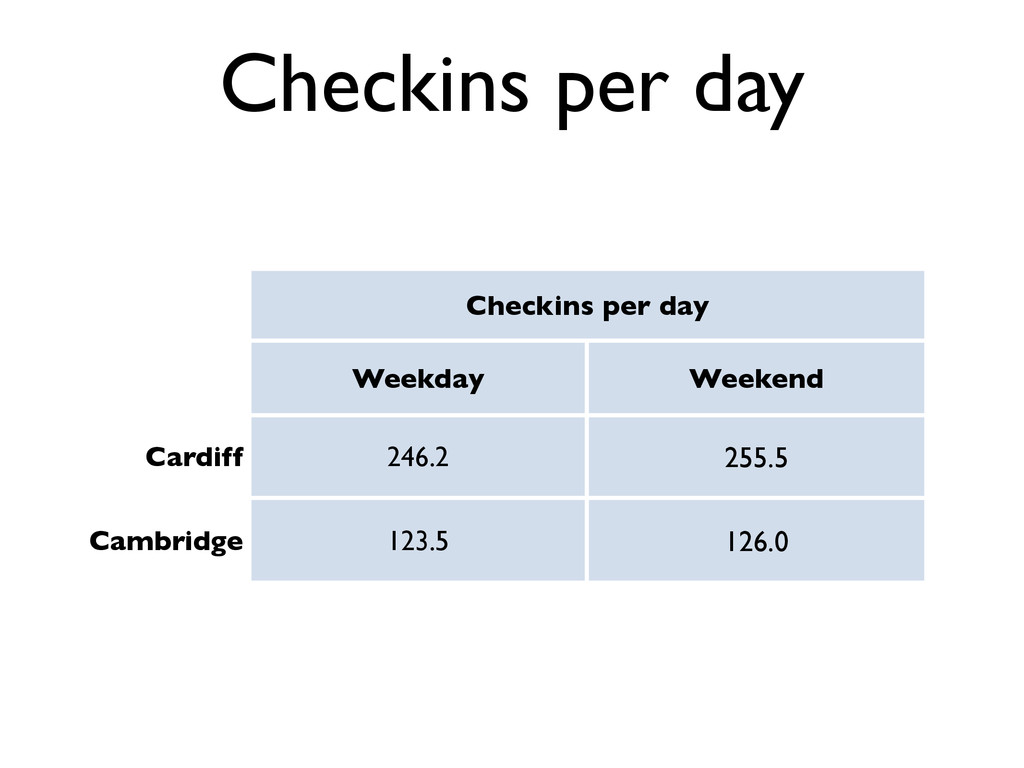
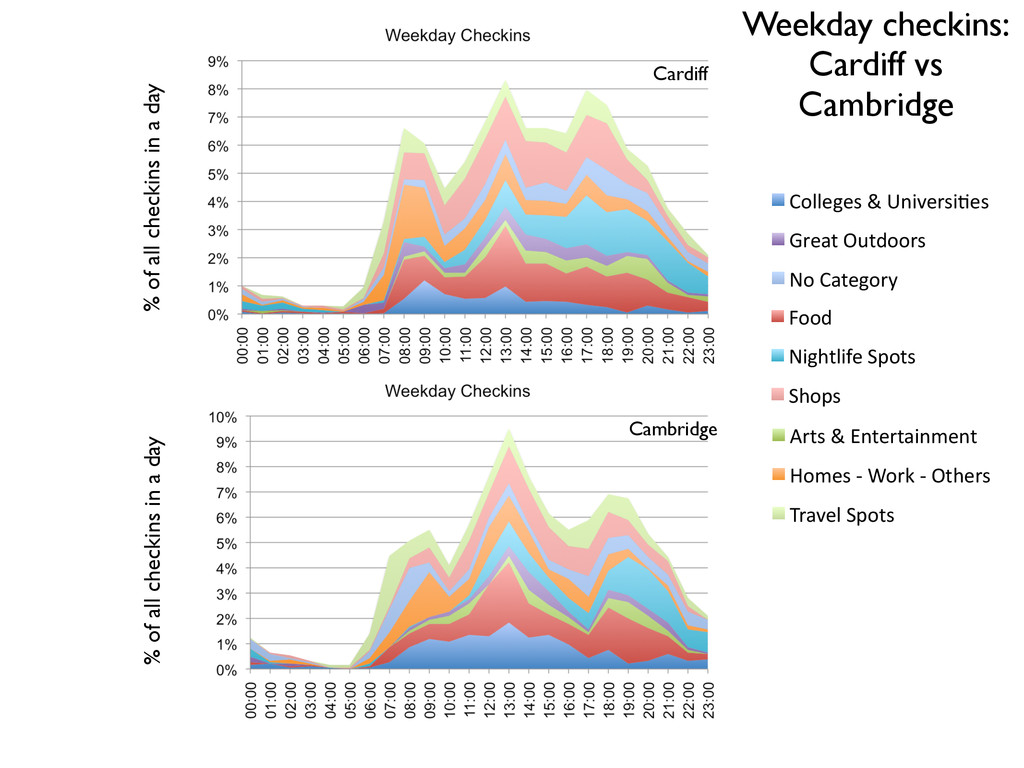
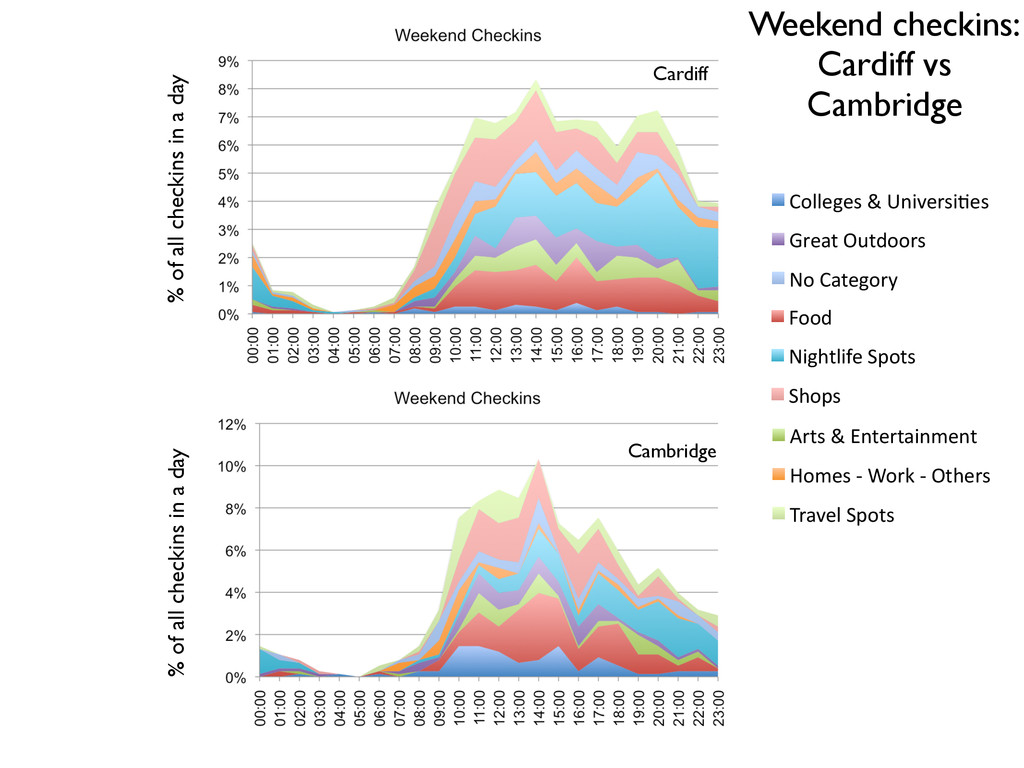
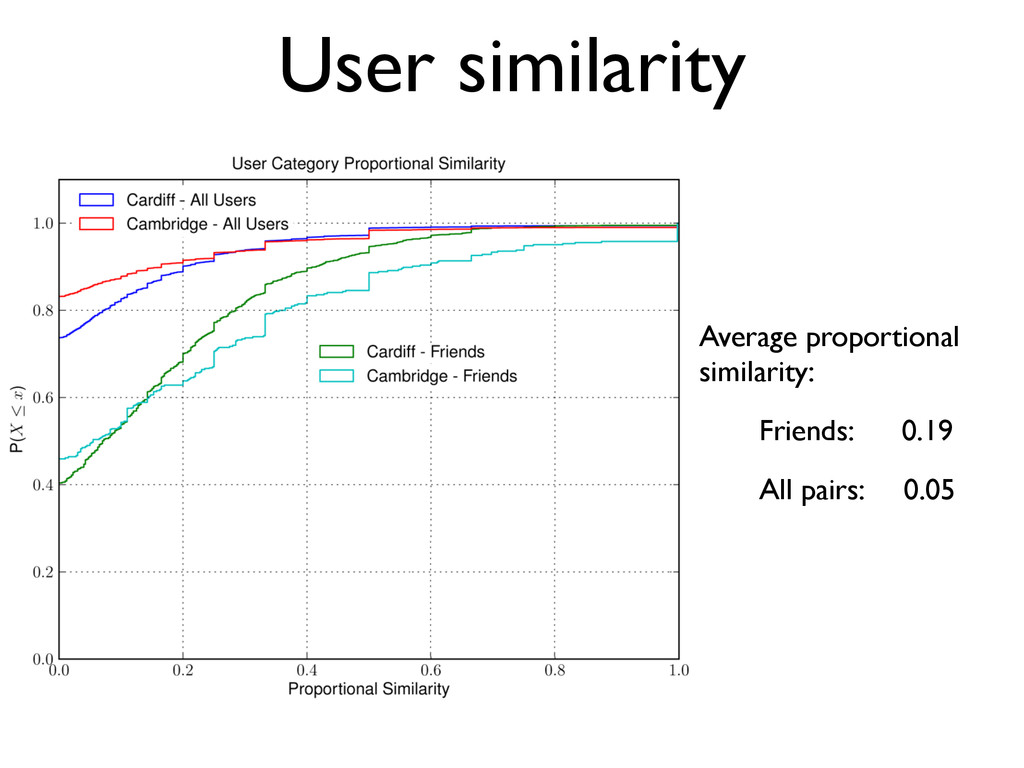
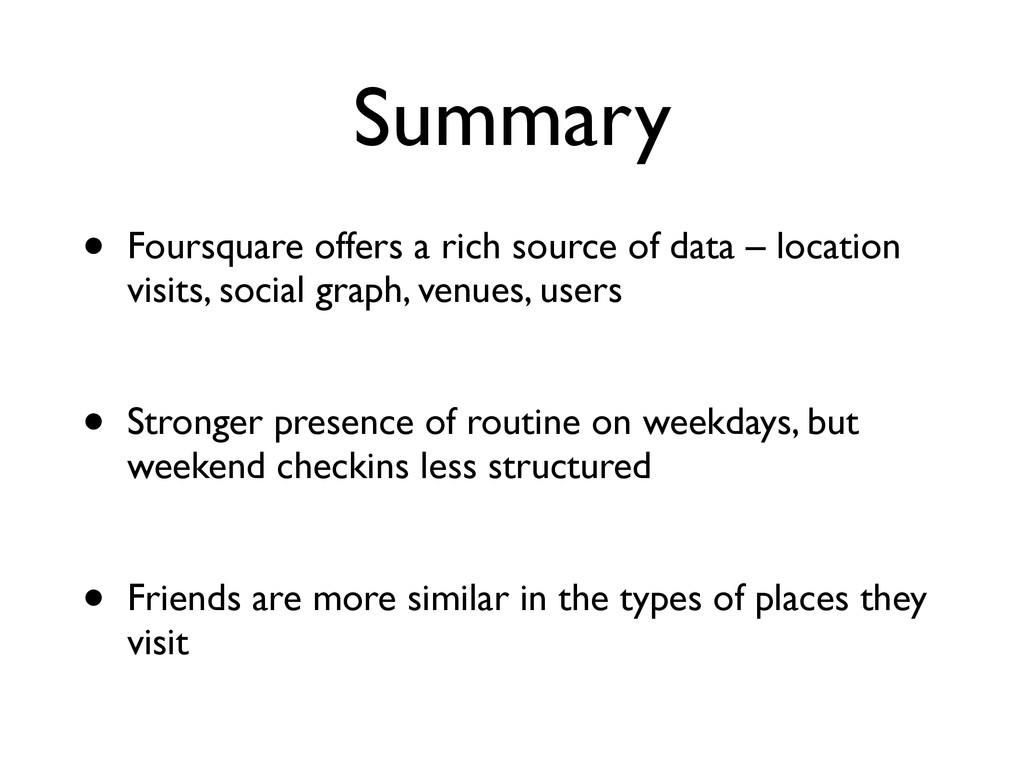
location
    visits, social graph, venues, users
    • Stronger presence of routine on weekdays, but
    weekend checkins less structured
    • Friends are more similar in the types of places they
    visit

    View Slide

  25. Ongoing and future
    research
    • Individual checkin patterns: regularity, predictability,
    heterogeneity
    • User co-location patterns
    • Relationship between personality traits and visiting
    behaviour

    View Slide

  26. Thanks for listening!
    Questions?
    Matt Williams
    www.mattjw.net
    @voxmjw
    www.gplus.to/mattjw
    Supported by...
    { M.J.Chorley,
    G.Colombo,
    M.J.Williams,
    Stuart.M.Allen,
    R.M.Whitaker }
    @cs.cardiff.ac.uk
    www.recognition-project.eu

    View Slide