Presented internally to RIDOLFI Inc. and EcoChem staff. A high-level overview of GIS. Designed to impart to project managers the applicability of GIS in their workflows.
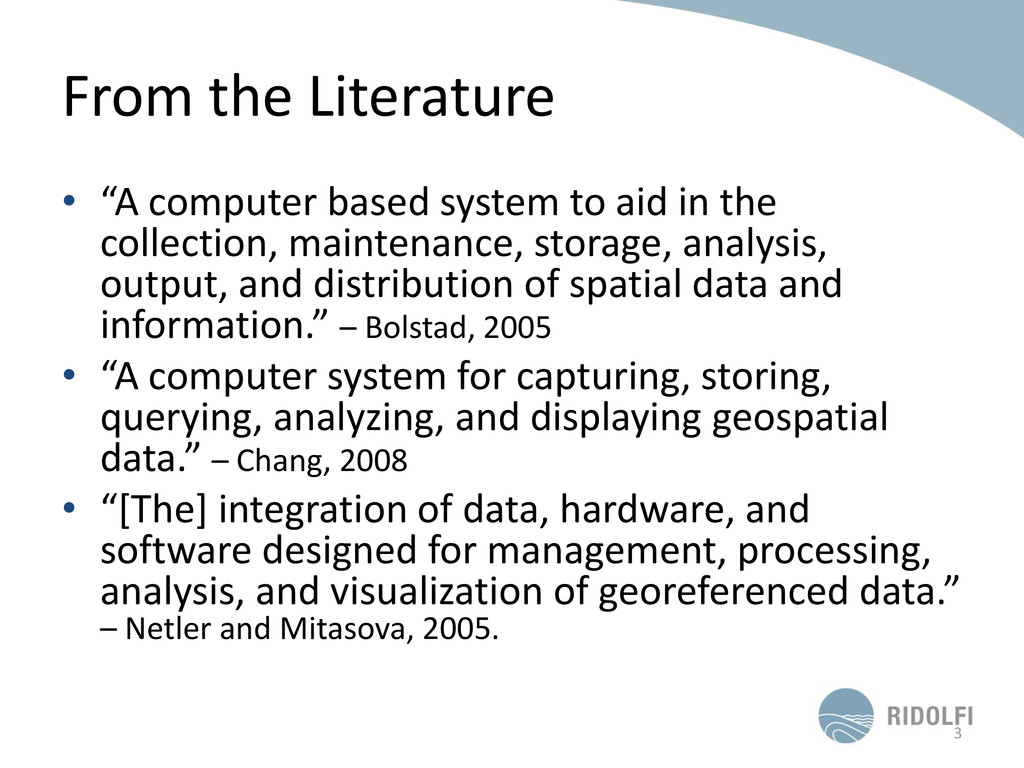
in the collection, maintenance, storage, analysis, output, and distribution of spatial data and information.” – Bolstad, 2005 • “A computer system for capturing, storing, querying, analyzing, and displaying geospatial data.” – Chang, 2008 • “[The] integration of data, hardware, and software designed for management, processing, analysis, and visualization of georeferenced data.” – Netler and Mitasova, 2005. 3
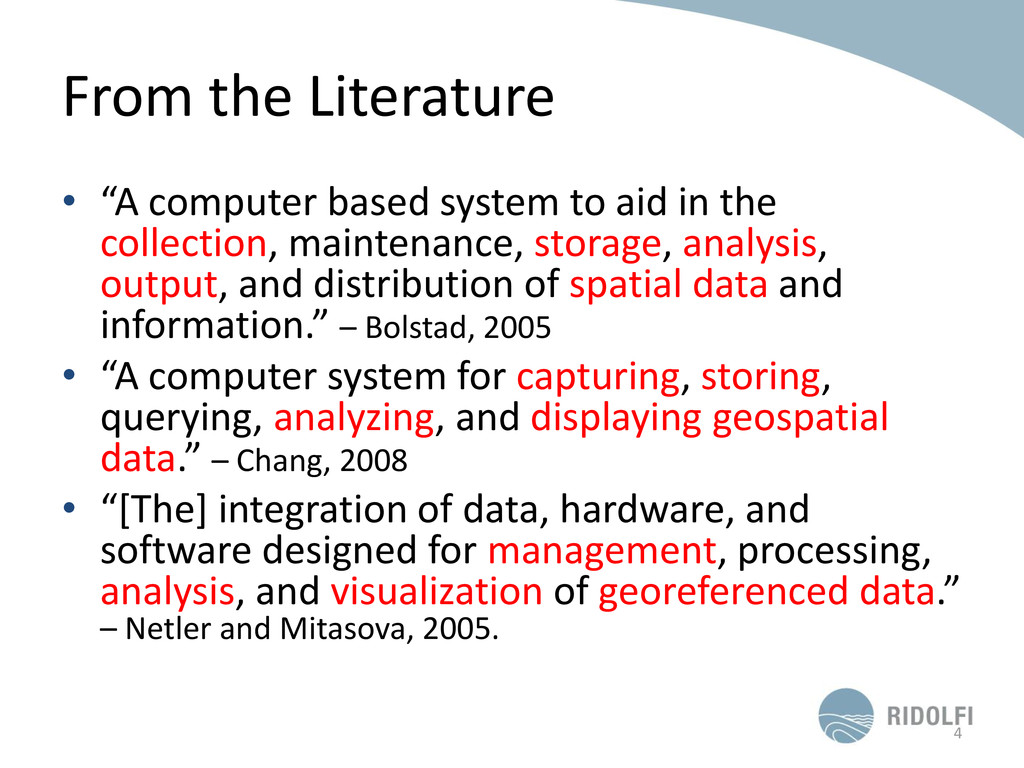
in the collection, maintenance, storage, analysis, output, and distribution of spatial data and information.” – Bolstad, 2005 • “A computer system for capturing, storing, querying, analyzing, and displaying geospatial data.” – Chang, 2008 • “[The] integration of data, hardware, and software designed for management, processing, analysis, and visualization of georeferenced data.” – Netler and Mitasova, 2005. 4
‘doing nifty things with spatial data’…” – Dave Bouwman • “GIS works hand-in-hand with other disciplines and domains in order to solve problems, just as the hammer works hand-in- hand with other disciplines, e.g. structural, HVAC, electrical, plumbing – to create a building.” – Dave Smith 5
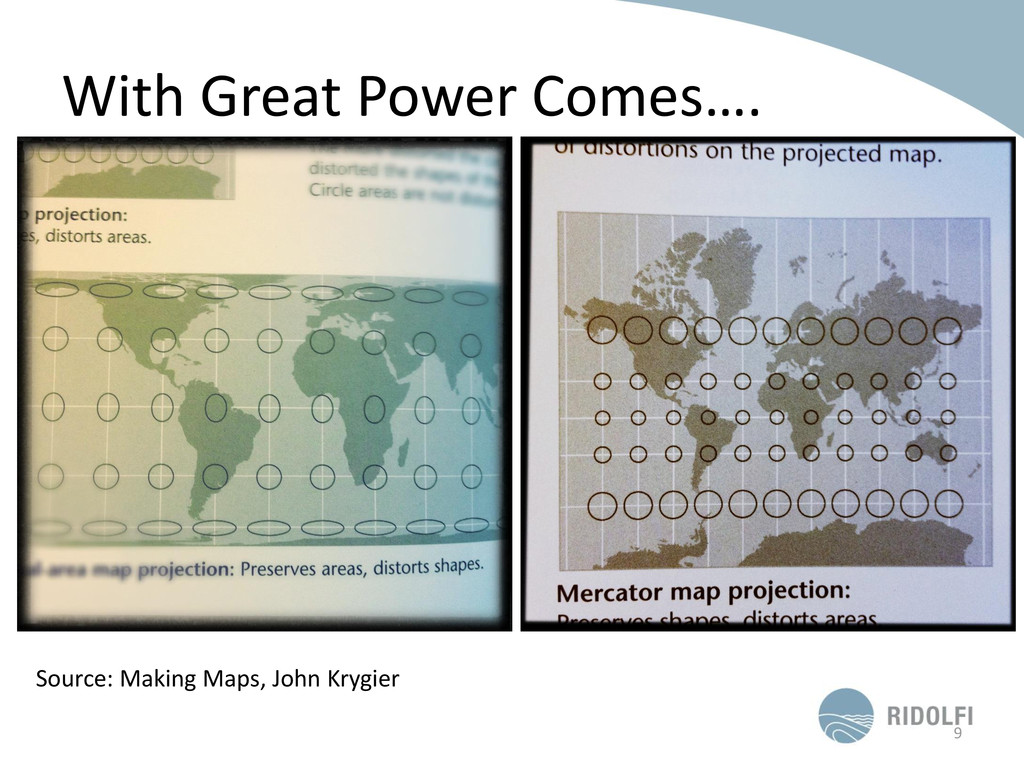
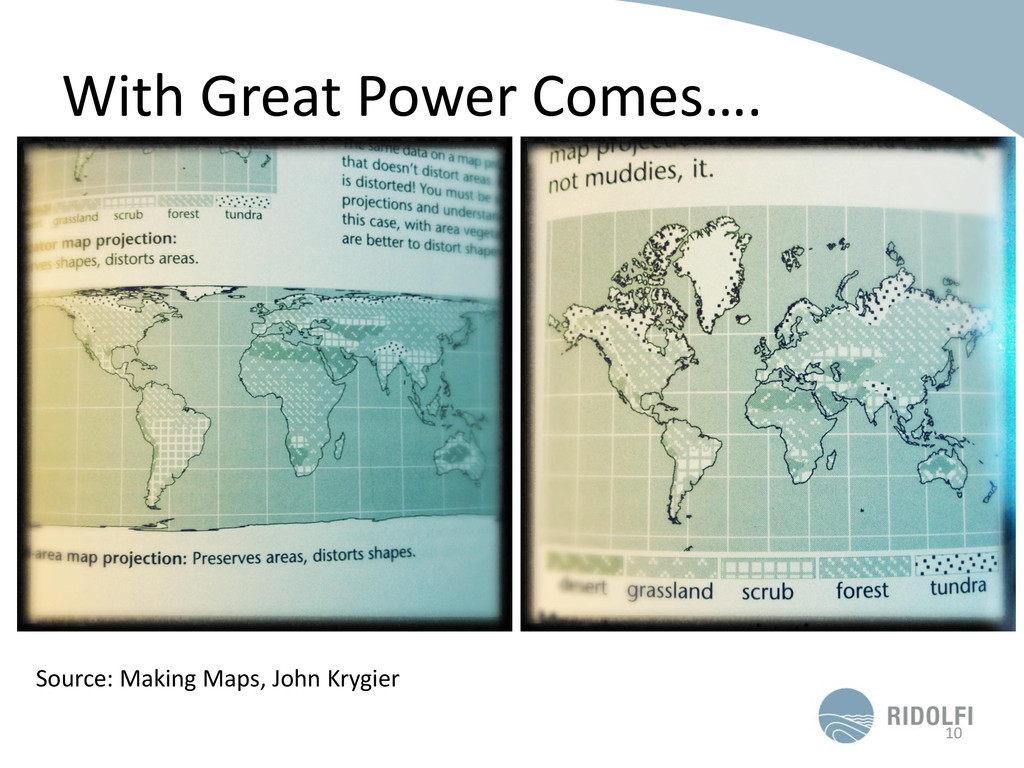
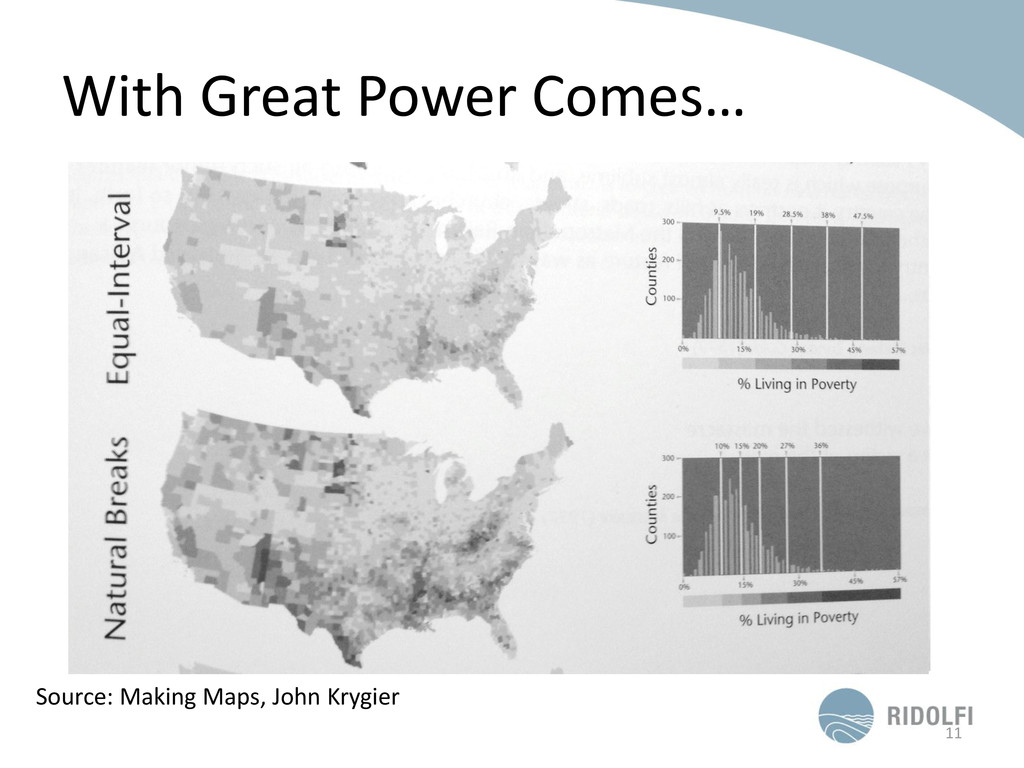
sense of legitimacy. – Improper understanding of data, or personal bias can misrepresent the mapped phenomena. – It’s the job of the GIS Analyst to properly represent those phenomena.
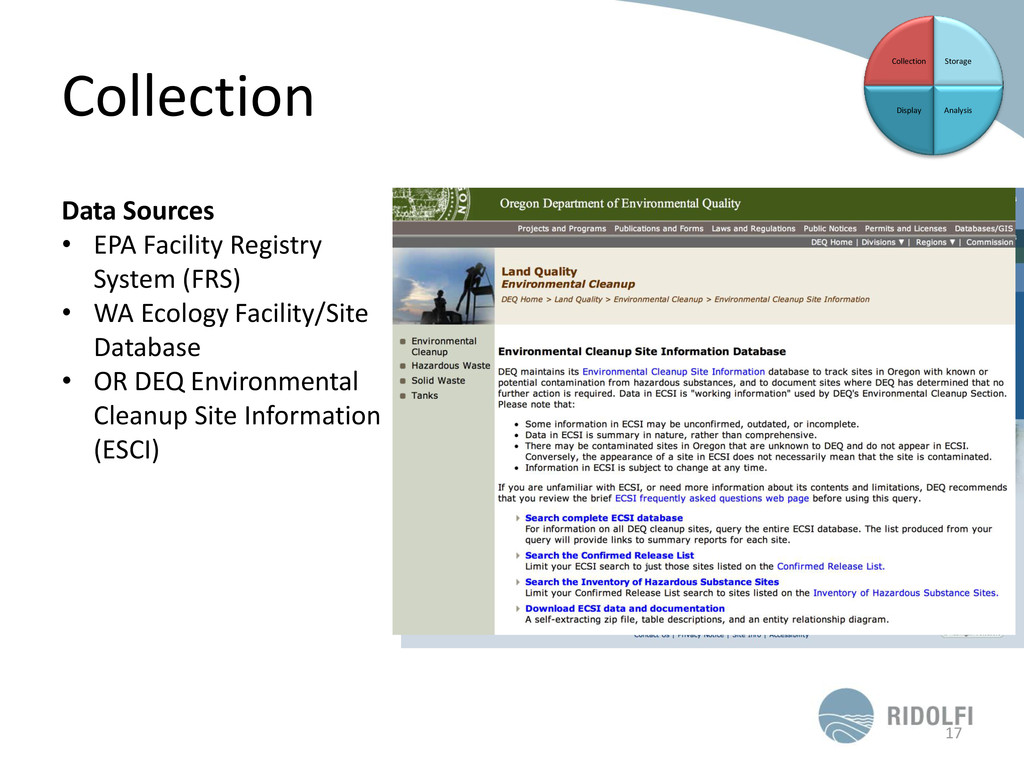
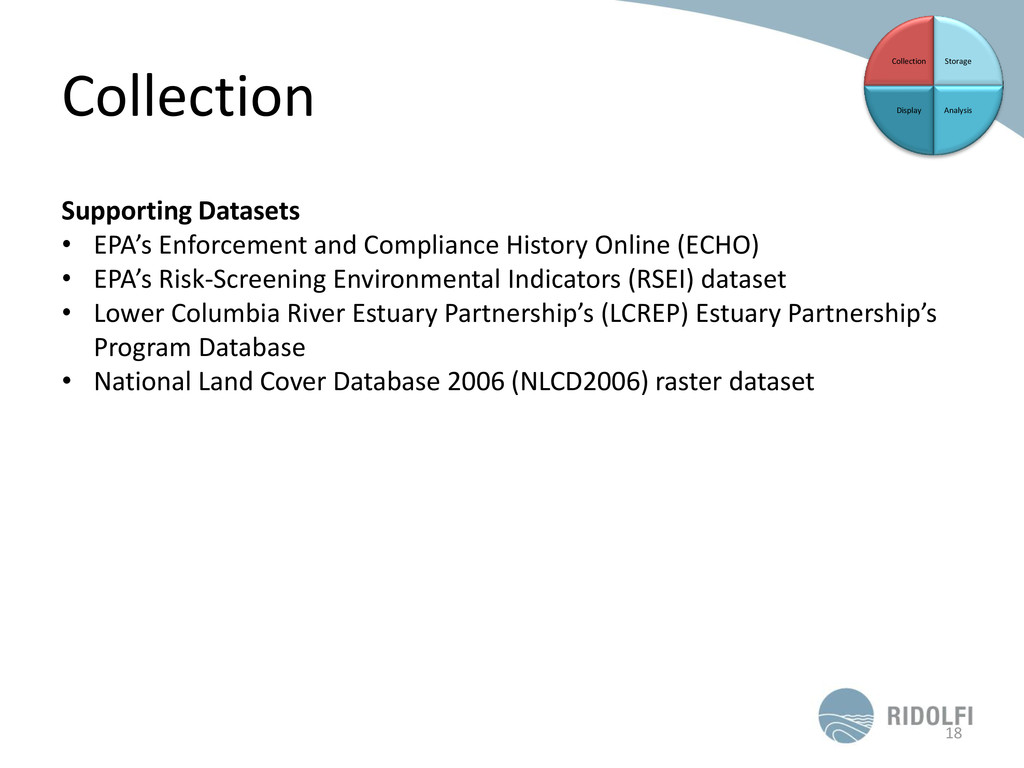
Enforcement and Compliance History Online (ECHO) • EPA’s Risk-Screening Environmental Indicators (RSEI) dataset • Lower Columbia River Estuary Partnership’s (LCREP) Estuary Partnership’s Program Database • National Land Cover Database 2006 (NLCD2006) raster dataset
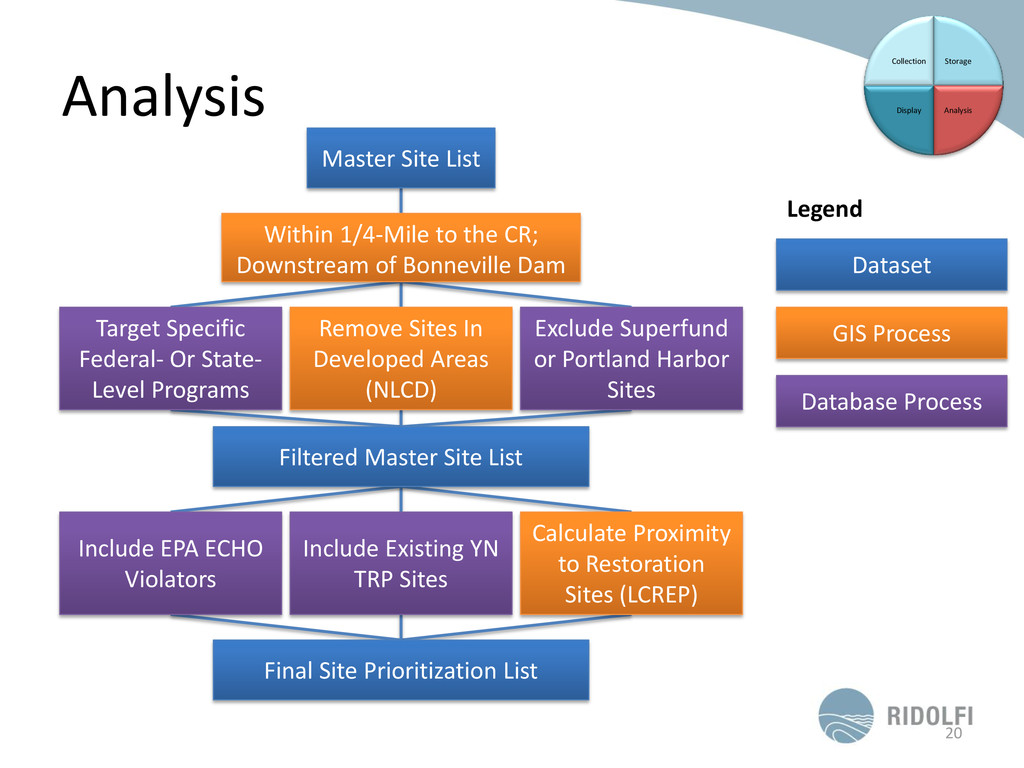
1/4-Mile to the CR; Downstream of Bonneville Dam Target Specific Federal- Or State- Level Programs Remove Sites In Developed Areas (NLCD) Exclude Superfund or Portland Harbor Sites Filtered Master Site List Include EPA ECHO Violators Include Existing YN TRP Sites Calculate Proximity to Restoration Sites (LCREP) Final Site Prioritization List Dataset GIS Process Database Process Legend
– E.g. Eric’s work with the City of Yakima. • Creating, Analyzing Large-Scale Datasets – E.g. Yakama Nation TRP; Hanford PED. • Decision Support Tools 22
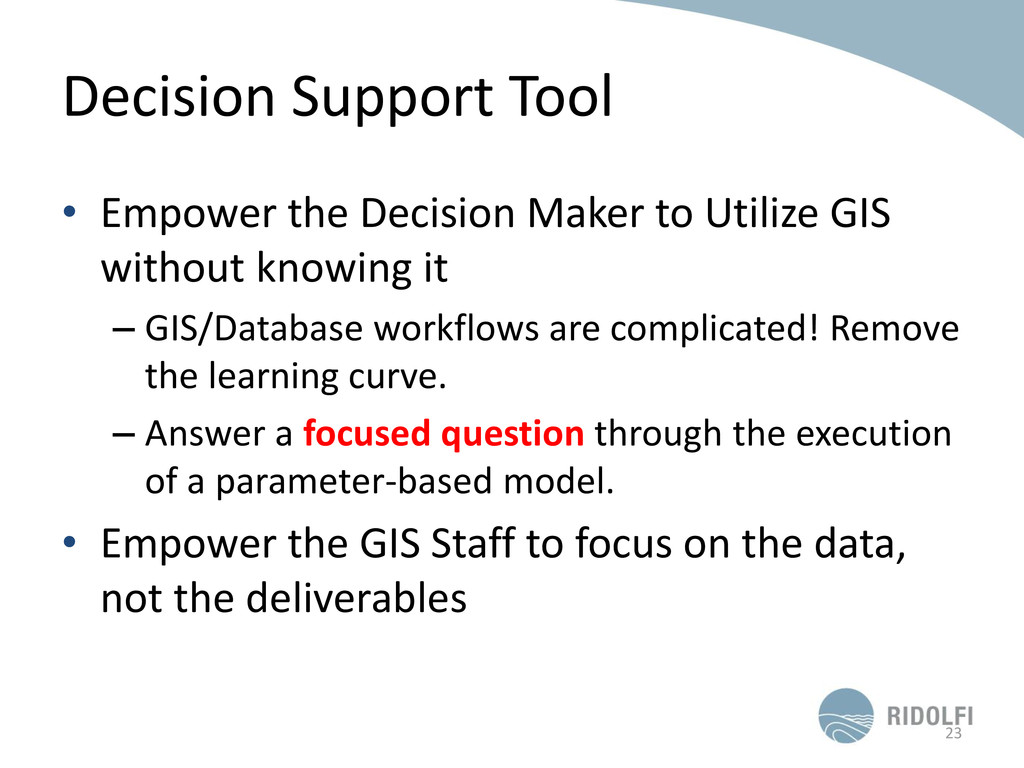
GIS without knowing it – GIS/Database workflows are complicated! Remove the learning curve. – Answer a focused question through the execution of a parameter-based model. • Empower the GIS Staff to focus on the data, not the deliverables 23
of tools, people, and practices in a state of radical-change. • Moving from desktop only GIS to a hybridization of desktop-web based tools, depending on the user. • “We are probably at a similar point in GIS evolution as word processing was 30 or 40 years ago.” – Don Meltz, “GIS Is Dead – Long Live GIS”. 28
“doing nifty things with spatial data”. For a long time, these nifty things were a black art that required special software, and arcane training. These days are ending.” – Dave Bouwman • The barrier to entry will become lower, but the specialized tools and users will never go away. 30