Upgrade to Pro — share decks privately, control downloads, hide ads and more …

How To Find Memory Leaks in GAUDI

How To Find Memory Leaks in GAUDI

Sasha Mazurov

April 18, 2012
Tweet

More Decks by Sasha Mazurov

Other Decks in Programming

Transcript

  1. Valgrind? No Auditor == No Control • Could not skip

    an initialization/finalization phase • Could not skip N events and stop after M events • Slower than Google tools • Google__HeapChecker do the same
  2. Step 1: MemoryAuditor from Configurables import MemoryAuditor Moore().EnableAuditor = [

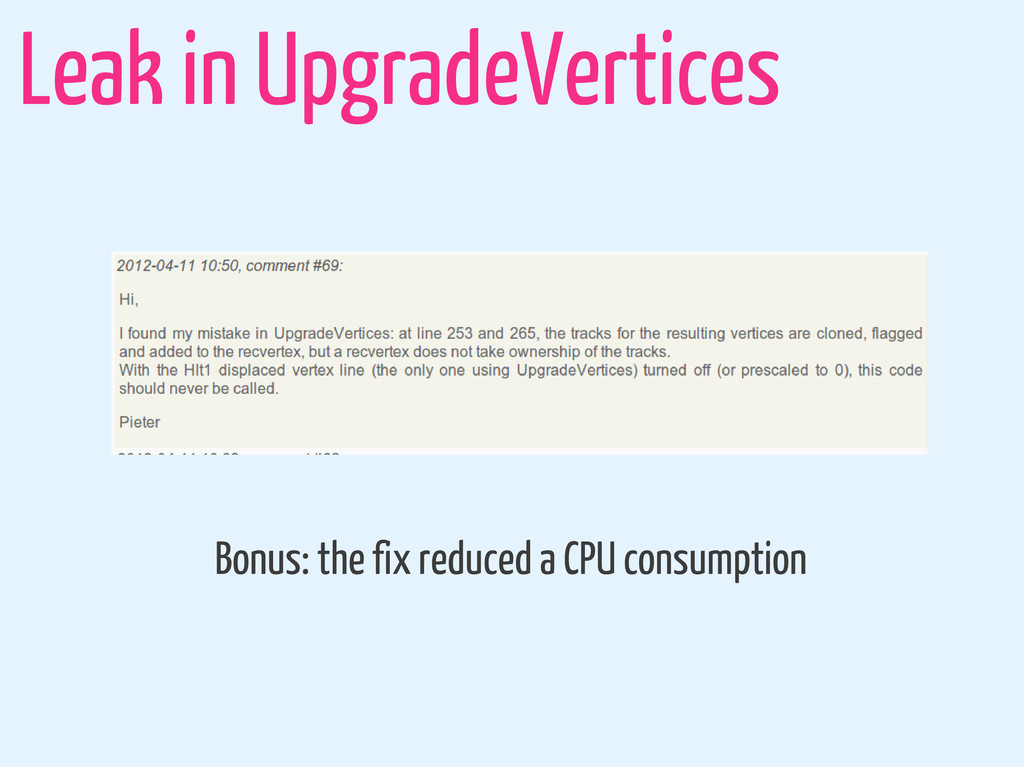
    MemoryAuditor() ] EventSelector().PrintFreq = 1 SUCCESS Reading Event record 75698. Record number within stream 1: 75698 INFO Memory usage has changed after Velo2CandidatesVertexDisplVertex Execute virtual size = 1572.61 MB resident set size = 1209.75 MB INFO Memory usage has changed after Hlt1VertexDisplVertexStreamer Execute virtual size = 2445.82 MB resident set size = 2078.48 MB Detect suspicious events
  3. Step 2: Google__HeapProfiler In which function the leak happens? from

    Configurables import Google__HeapProfiler Moore().SkipEvents = 75697 auditor = Google__HeapProfiler() auditor.DoFullEventProfile = True auditor.FullEventNSampleEvents = 3 Moore().EnableAuditor = [ auditor ] $> LD_PRELOAD=/path/to/libtcmalloc_and_profiler.so gaudirun.py moore.py
  4. Analyze I: Text output (1) $> pprof –text `which python`

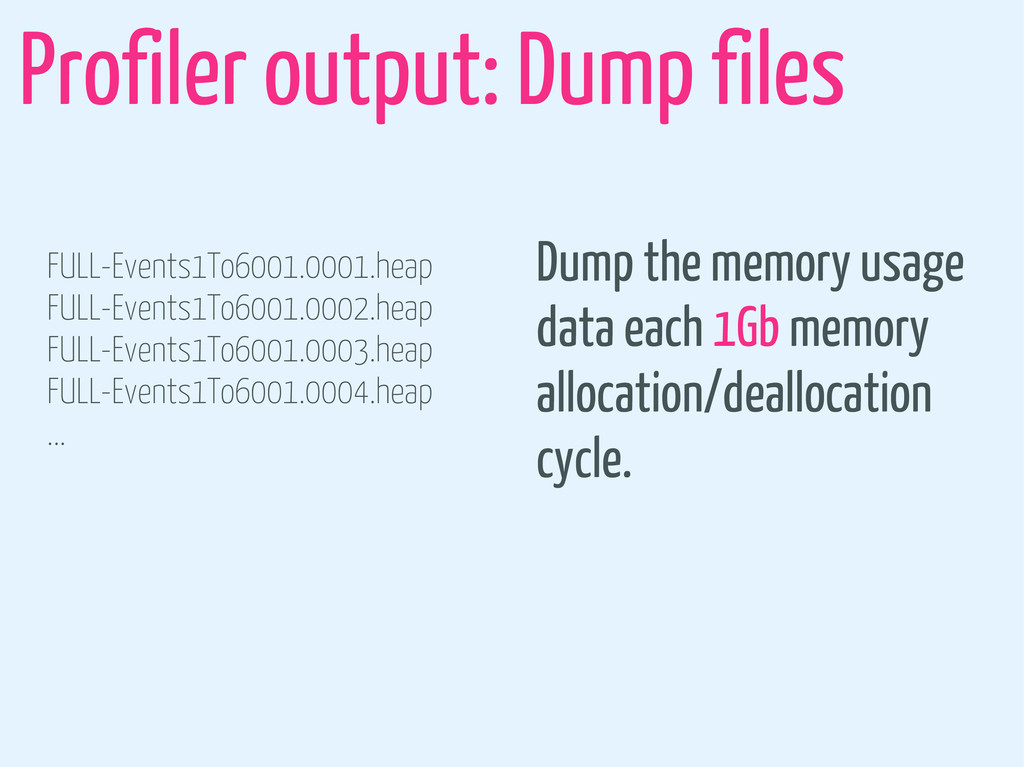
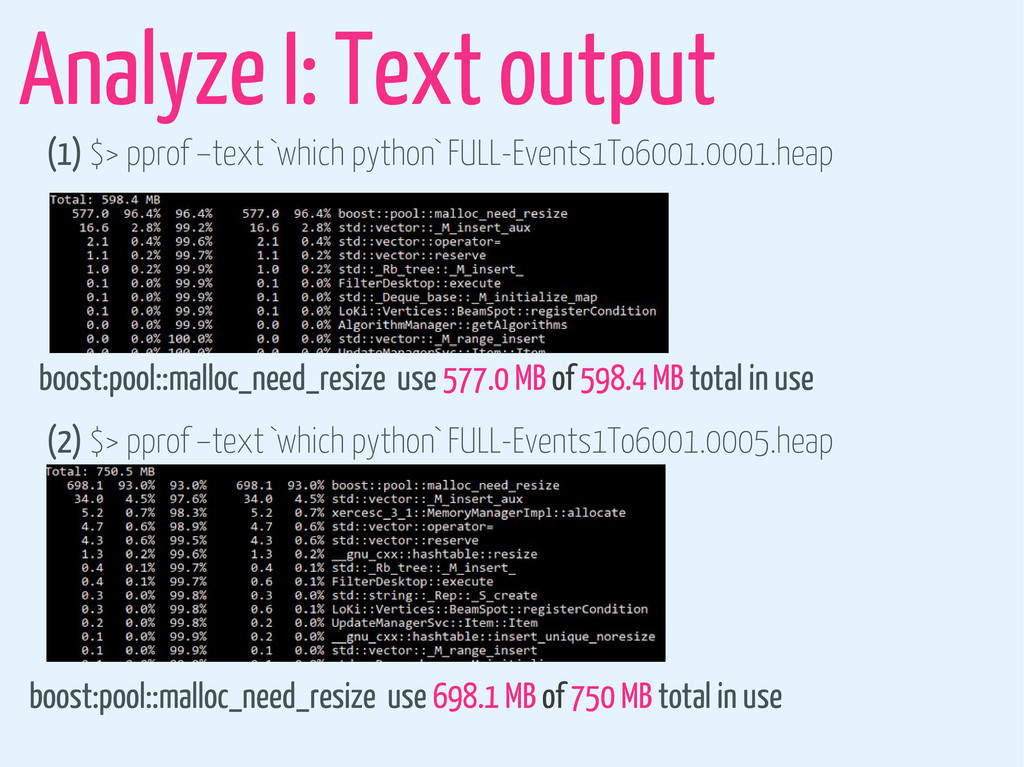
    FULL-Events1To6001.0001.heap (2) $> pprof –text `which python` FULL-Events1To6001.0005.heap boost:pool::malloc_need_resize use 577.0 MB of 598.4 MB total in use boost:pool::malloc_need_resize use 698.1 MB of 750 MB total in use