Upgrade to Pro — share decks privately, control downloads, hide ads and more …

Nonlinear Optimization (Optimization, Part 2) [Learning Lab 16]

Nonlinear Optimization (Optimization, Part 2) [Learning Lab 16]

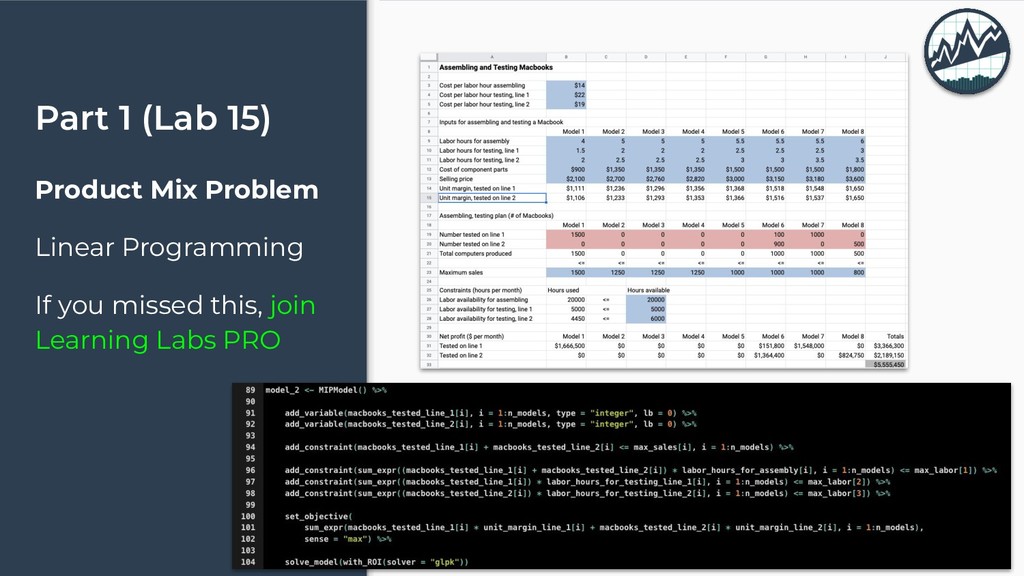
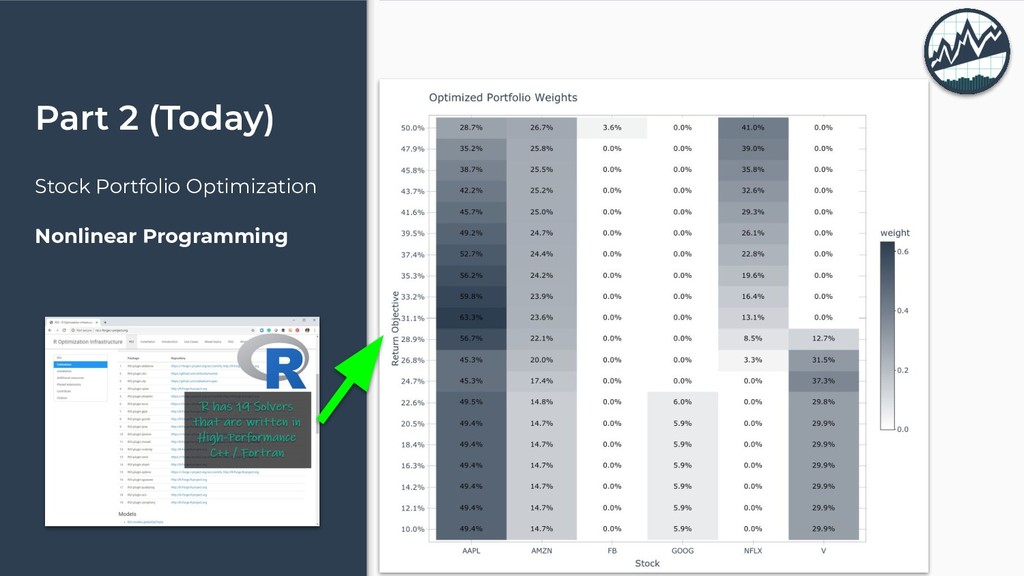
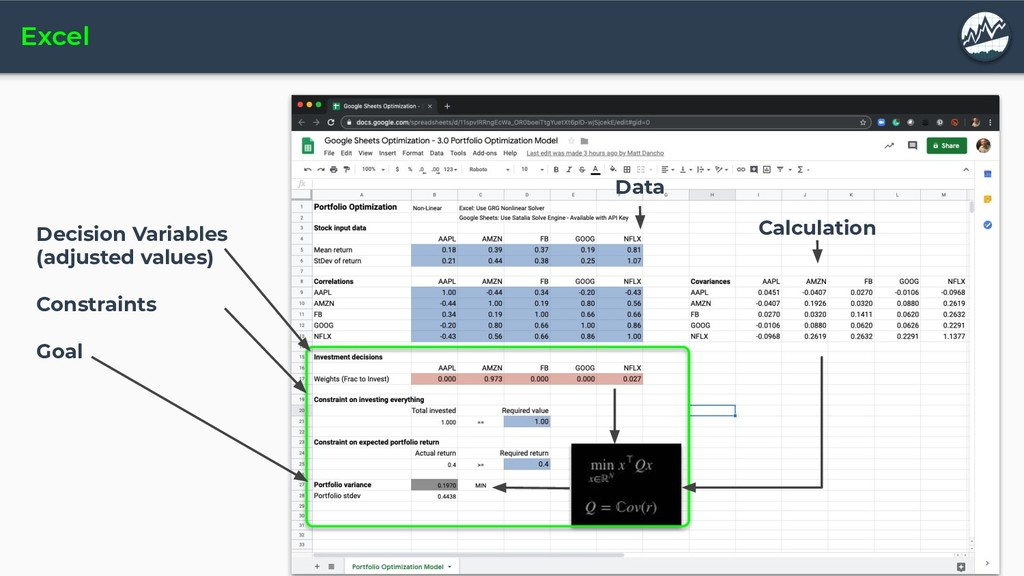
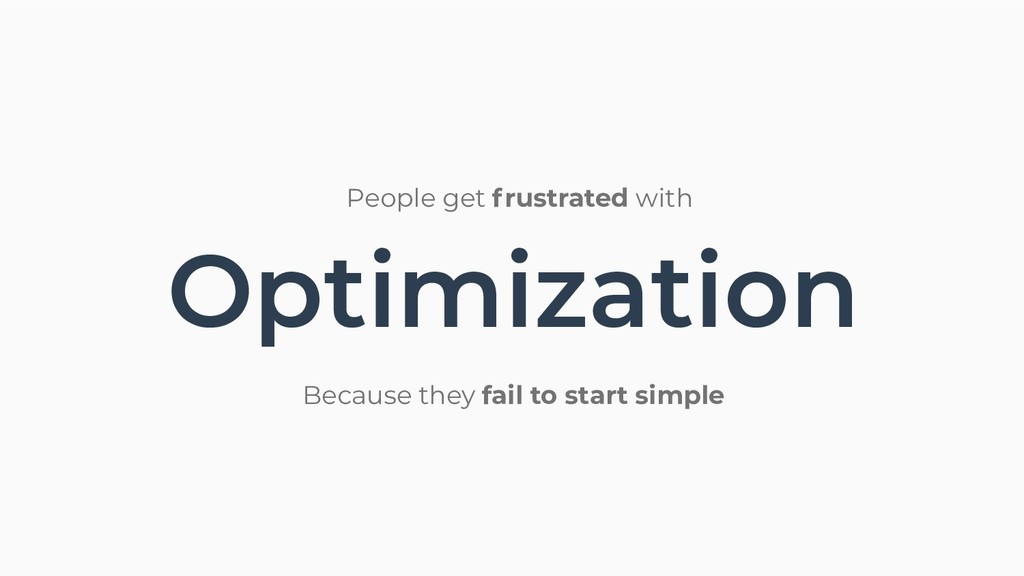
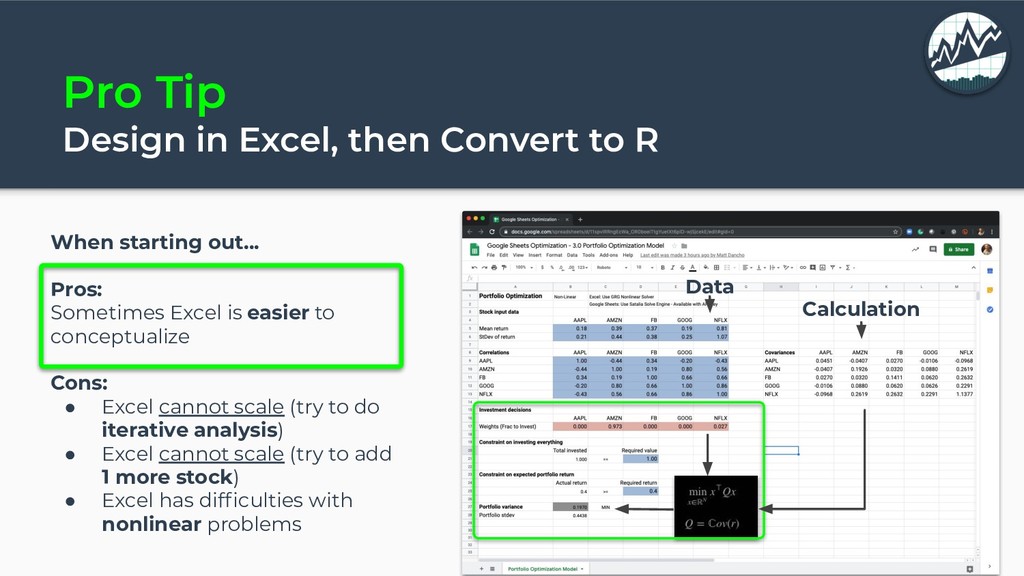
Optimization and Business Analysis go hand-in-hand. The problem is that Excel breaks down when we feed it Non-linear optimization problems - Any sort of custom function we build is typically nonlinear, and we'll get suboptimal results.

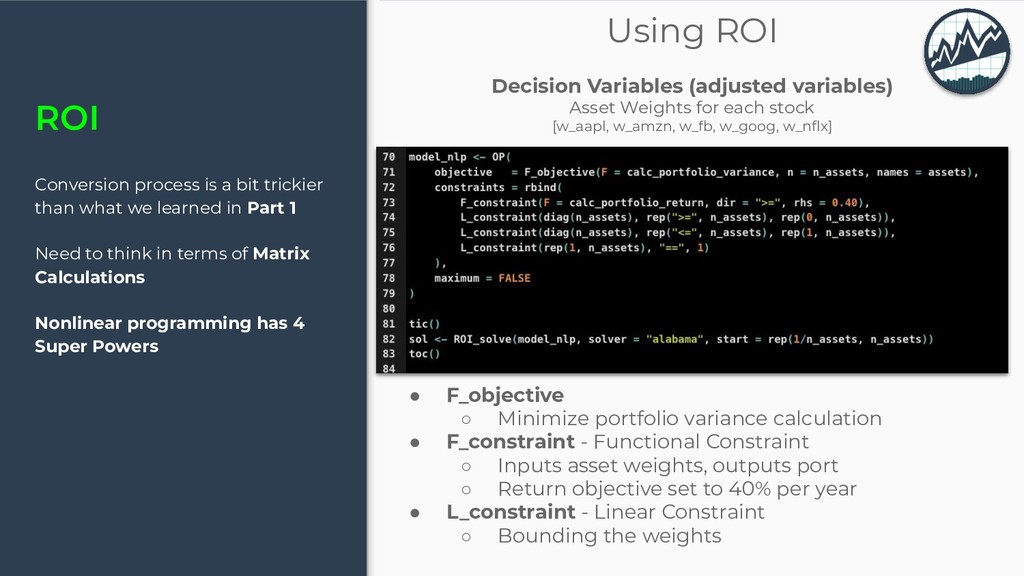
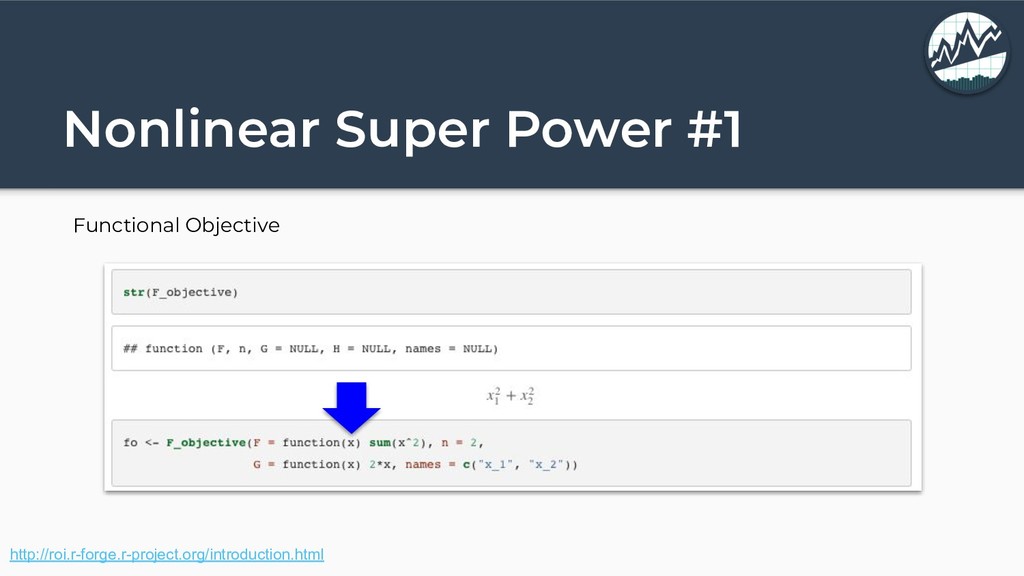
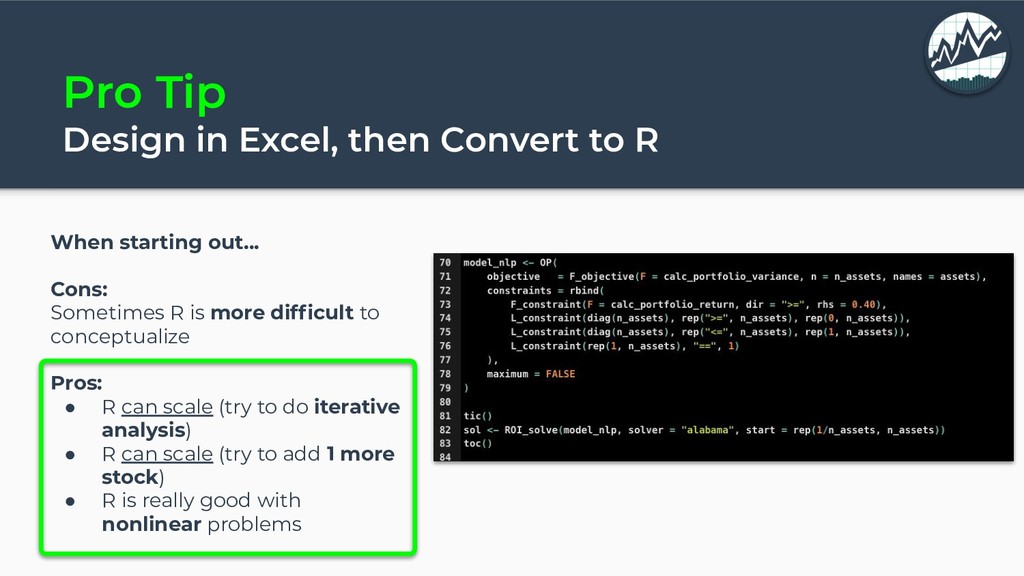
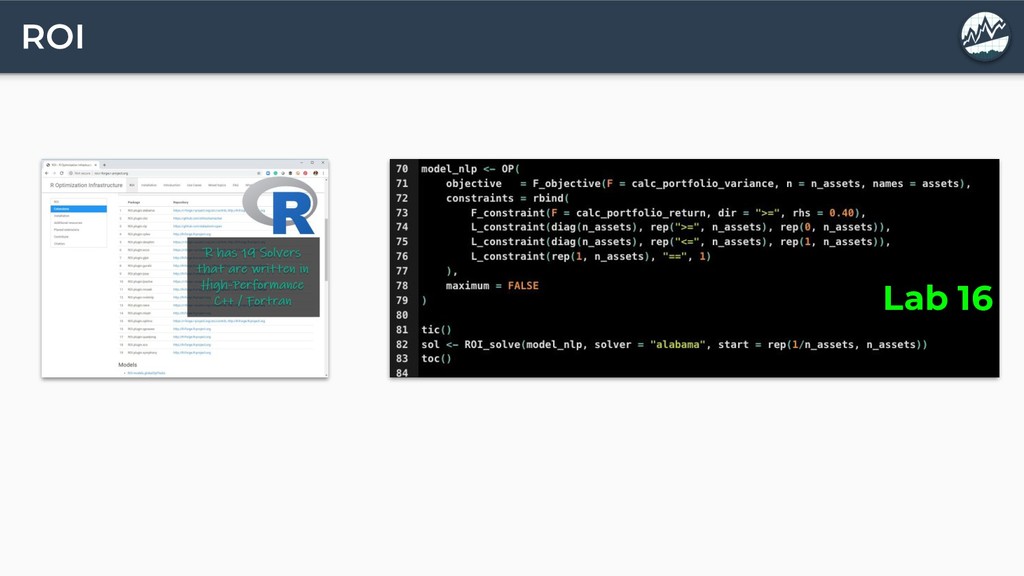
Fortunately, R has a solution - the ROI package.

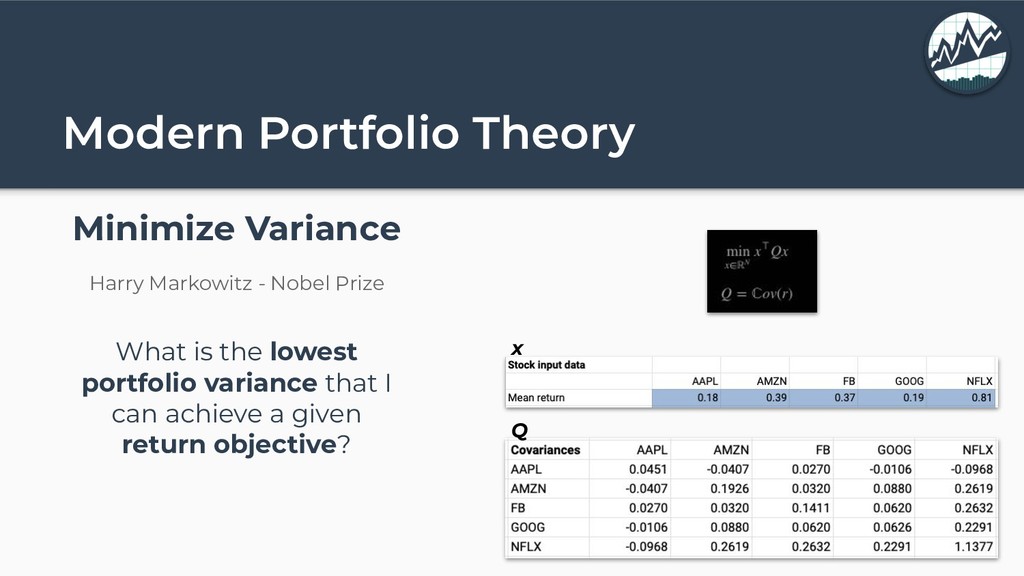
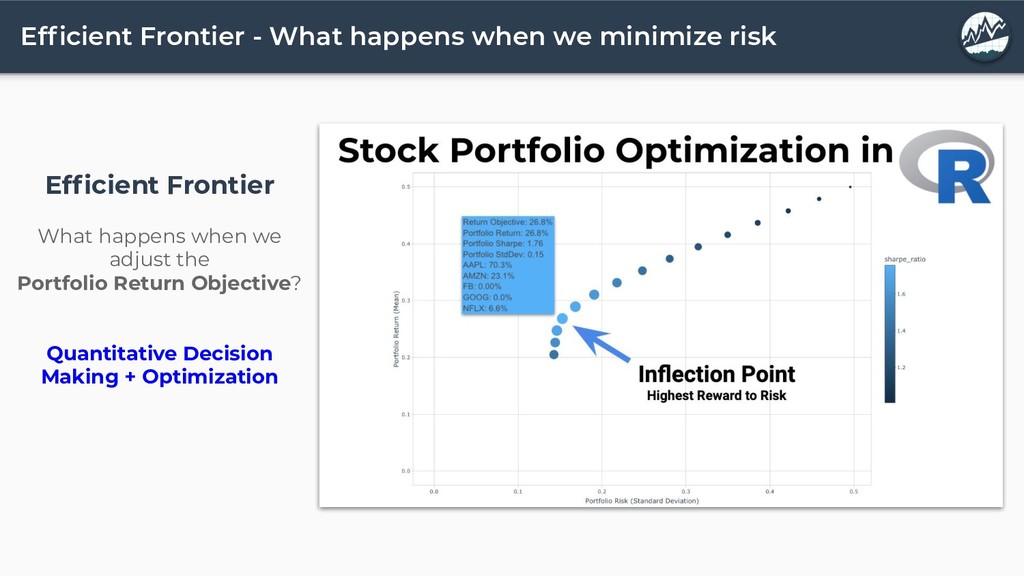
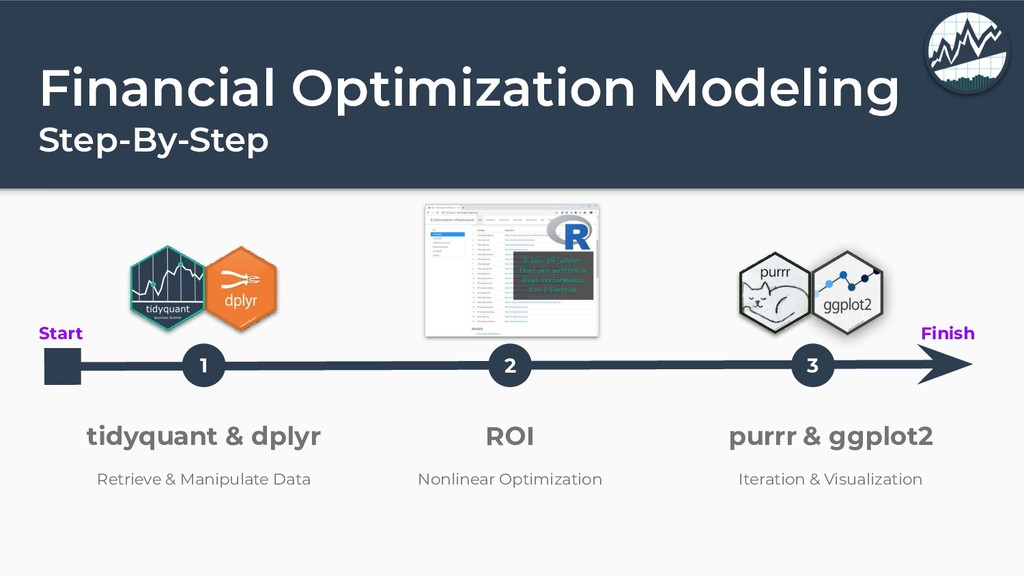
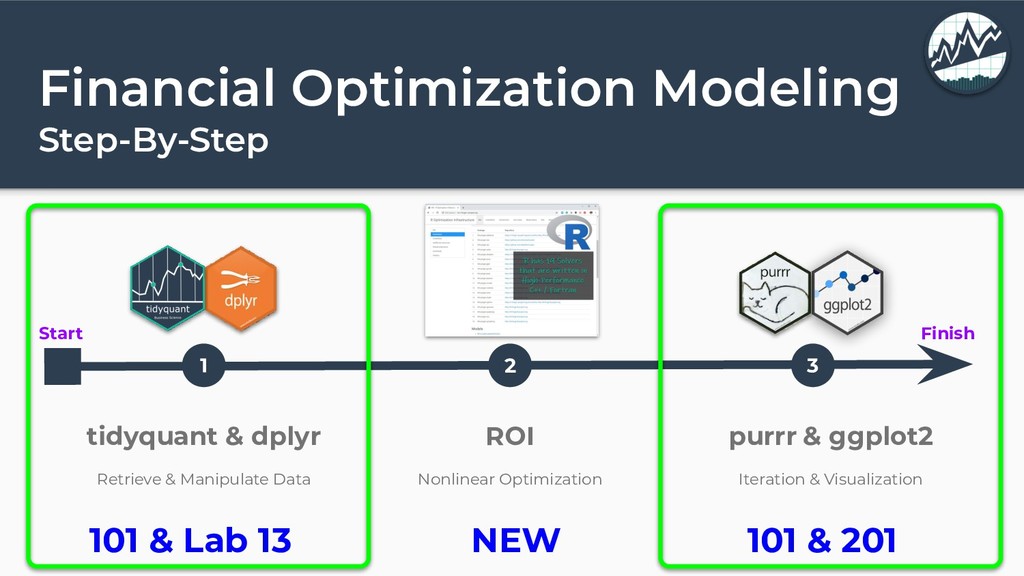
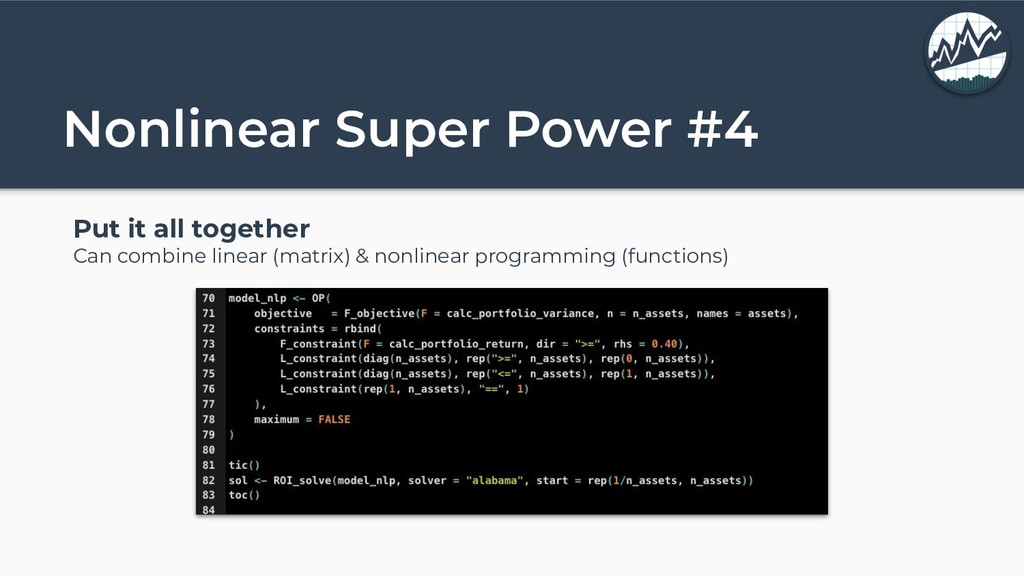
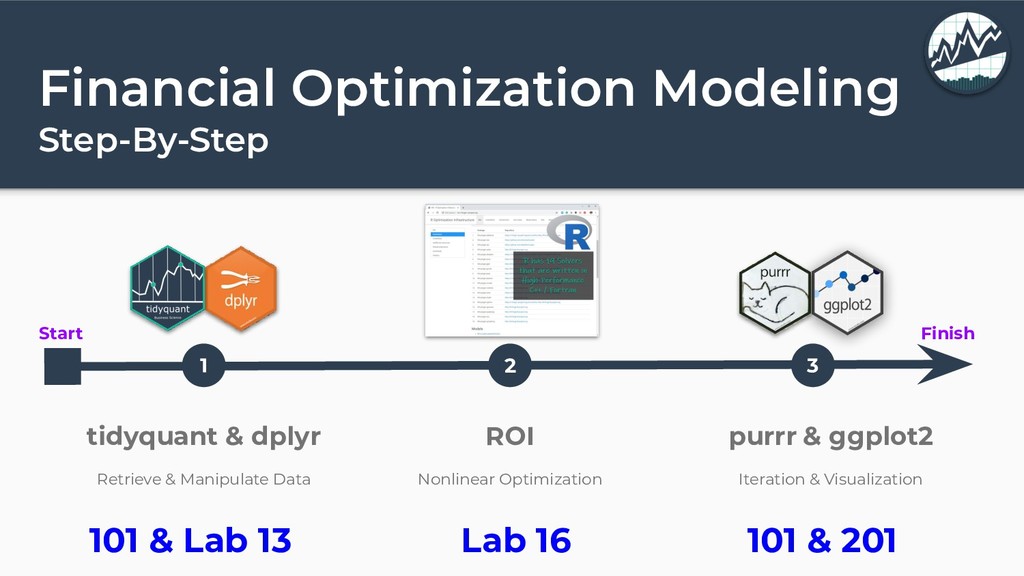
In Learning Lab 16, we show how to perform a Financial Optimization using a basket of 5 Stocks, and we want to determine the optimal combination to yield the best reward-to-risk. It's a nonlinear problem - Learn how to solve it in Lab 16!

Matt Dancho

August 13, 2019
Tweet

More Decks by Matt Dancho

Other Decks in Business

Transcript

  1. With ROI Package (Part 2: Nonlinear Optimization) Matt Dancho &

    David Curry Business Science Learning Lab Difficulty: Intermediate Optimization for Finance
  2. #BusinessScienceSuccess Success Story Luis Francisco Gomez Lopez - Economist &

    Student - Started courses 2 months ago - Was using Excel - Completely switched to - Latest report & homework assignment - TOTAL TRANSFORMATION! “Without the BSU courses, I couldn’t do what I’m doing.”
  3. Part 1 (Lab 15) Product Mix Problem Linear Programming If

    you missed this, join Learning Labs PRO
  4. Learning Labs PRO Every 2-Weeks 1-Hour Course Recordings + Code

    + Slack $19/month university.business-science.io Lab 15 R’s Optimization Toolchain, Part 1 Lab 14 Customer Churn Survival Analysis Lab 13 Wrangling 4.6M Rows of Financial Data w/ data.table Lab 12 How I built anomalize Lab 11 Market Basket Analysis w/ recommenderLab Lab 10 Building API’s with plumber & postman Lab 9 Finance in R with tidyquant
  5. The power of R for Trading R is the best

    language in the world for doing rapid financial analysis https://www.linkedin.com/pulse/power-r-trading-part-1-ralph-sueppel/
  6. Building a Financial Portfolio Historical Stock Prices We analyze the

    historical stock prices for 5 Stocks: AAPL, AMZN, FB, GOOG, & NFLX How do we determine an optimal portfolio mix? https://business-science.github.io/tidyquant/
  7. Modern Portfolio Theory Minimize Variance Harry Markowitz - Nobel Prize

    What is the lowest portfolio variance that I can achieve a given return objective? x Q
  8. Efficient Frontier - What happens when we minimize risk Efficient

    Frontier What happens when we adjust the Portfolio Return Objective? Quantitative Decision Making + Optimization
  9. Terminology Objectives The goal of the model Always Maximize or

    Minimize. Constraints Decision Rules for the model Restricts the decision variables to boundaries Decision Variables Your problem’s Frame of Reference The parameters that your optimization model adjusts 1 2 3
  10. Types of Optimization Models Linear • Fastest solutions • Easy

    to conceptualize • Analysis limited to aggregations, constant multiplications, etc • Many problems don’t fit this mold (e.g. take correlation of something) Quadratic • Fast solutions • Difficult to Conceptualize • Requires formulation as a quadratic function Nonlinear • Easy to conceptualize • Super Flexible • Cannot use linear solvers • Slower solutions • Can get suboptimal results (local vs global maxima)
  11. Types of Optimization Models Linear • Fastest solutions • Easy

    to conceptualize • Analysis limited to aggregations, constant multiplications, etc • Many problems don’t fit this mold (e.g. take correlation of something) Quadratic • Fast solutions • Difficult to Conceptualize • Requires formulation as a quadratic function Nonlinear • Easy to conceptualize • Super Flexible • Cannot use linear solvers • Slower solutions • Can get suboptimal results (local vs global maxima) Part 1 Part 2
  12. Financial Optimization Modeling Step-By-Step Start Finish 1 2 3 tidyquant

    & dplyr Retrieve & Manipulate Data ROI Nonlinear Optimization purrr & ggplot2 Iteration & Visualization
  13. Financial Optimization Modeling Step-By-Step Start Finish 1 2 3 tidyquant

    & dplyr Retrieve & Manipulate Data ROI Nonlinear Optimization purrr & ggplot2 Iteration & Visualization 101 & Lab 13 101 & 201 NEW
  14. ROI • F_objective ◦ Minimize portfolio variance calculation • F_constraint

    - Functional Constraint ◦ Inputs asset weights, outputs port ◦ Return objective set to 40% per year • L_constraint - Linear Constraint ◦ Bounding the weights Conversion process is a bit trickier than what we learned in Part 1 Need to think in terms of Matrix Calculations Nonlinear programming has 4 Super Powers Using ROI Decision Variables (adjusted variables) Asset Weights for each stock [w_aapl, w_amzn, w_fb, w_goog, w_nflx]
  15. Nonlinear Super Power #4 Put it all together Can combine

    linear (matrix) & nonlinear programming (functions)
  16. Pro Tip Design in Excel, then Convert to R When

    starting out... Pros: Sometimes Excel is easier to conceptualize Cons: • Excel cannot scale (try to do iterative analysis) • Excel cannot scale (try to add 1 more stock) • Excel has difficulties with nonlinear problems Calculation Data
  17. Pro Tip Design in Excel, then Convert to R When

    starting out... Cons: Sometimes R is more difficult to conceptualize Pros: • R can scale (try to do iterative analysis) • R can scale (try to add 1 more stock) • R is really good with nonlinear problems
  18. Financial Optimization Modeling Step-By-Step Start Finish 1 2 3 tidyquant

    & dplyr Retrieve & Manipulate Data ROI Nonlinear Optimization purrr & ggplot2 Iteration & Visualization 101 & Lab 13 101 & 201 Lab 16
  19. Business Analysis with R (DS4B 101-R) Data Science For Business

    with R (DS4B 201-R) R Shiny Web Apps For Business (DS4B 102-R) Data Science Foundations 7 Weeks Machine Learning & Business Consulting 10 Weeks Web Application Development 4 Weeks -TRACK Project-Based Courses with Business Application Business Science University R-Track 3-Course R-Track System
  20. Key Benefits - Fundamentals - Weeks 1-5 (25 hours of

    Video Lessons) - Data Manipulation (dplyr) - Time series (lubridate) - Text (stringr) - Categorical (forcats) - Visualization (ggplot2) - Programming & Iteration (purrr) - 3 Challenges - Machine Learning - Week 6 (8 hours of Video Lessons) - Clustering (3 hours) - Regression (5 hours) - 2 Challenges - Learn Business Reporting - Week 7 - RMarkdown & plotly - 2 Project Reports: 1. Product Pricing Algo 2. Customer Segmentation Visualization Data Cleaning & Manipulation Functional Programming & Modeling Business Reporting Business Analysis with R (DS4B 101-R) Data Science Foundations 7 Weeks
  21. Key Benefits Understanding the Problem & Preparing Data - Weeks

    1-4 - Project Setup & Framework - Business Understanding / Sizing Problem - Tidy Evaluation - rlang - EDA - Exploring Data -GGally, skimr - Data Preparation - recipes - Correlation Analysis - 3 Challenges Machine Learning - Weeks 5, 6, 7 - H2O AutoML - Modeling Churn - ML Performance - LIME Feature Explanation Return-On-Investment - Weeks 7, 8, 9 - Expected Value Framework - Threshold Optimization - Sensitivity Analysis - Recommendation Algorithm Data Science For Business (DS4B 201-R) Machine Learning & Business Consulting 10 Weeks Advanced Visualization Advanced Data Wrangling Advanced Functional Programming & Modeling Advanced Data Science End-to-End Churn Project
  22. Key Benefits Learn Shiny & Flexdashboard - Build Applications -

    Learn Reactive Programming - Integrate Machine Learning App #1: Predictive Pricing App - Model Product Portfolio - XGBoost Pricing Prediction - Generate new products instantly App #2: Sales Dashboard with Demand Forecasting - Model Demand History - Segment Forecasts by Product & Customer - XGBoost Time Series Forecast - Generate new forecasts instantly Shiny Apps for Business (DS4B 102-R) Web Application Development 4 Weeks Web Apps Machine Learning
  23. Testimonials “I can already apply a lot of the early

    gains from the course to current working projects.” -Adam Mitchell, Data Analyst with Eurostar “Your program allowed me to cut down to 50% of the time to deliver solutions to my clients.” -Rodrigo Prado, Managing Partner Big Data Analytics & Strategy at Genesis Partners “My work became 10X easier. I can spend quality time asking questions rather than wasting time trying to figure out syntax.” -Mohana Chittor, Data Scientist with Kabbage, Inc Achieve Results that Matter to the Business