Upgrade to Pro — share decks privately, control downloads, hide ads and more …

Machine Learning for Customer Journey

Matt Dancho
January 08, 2020

Machine Learning for Customer Journey

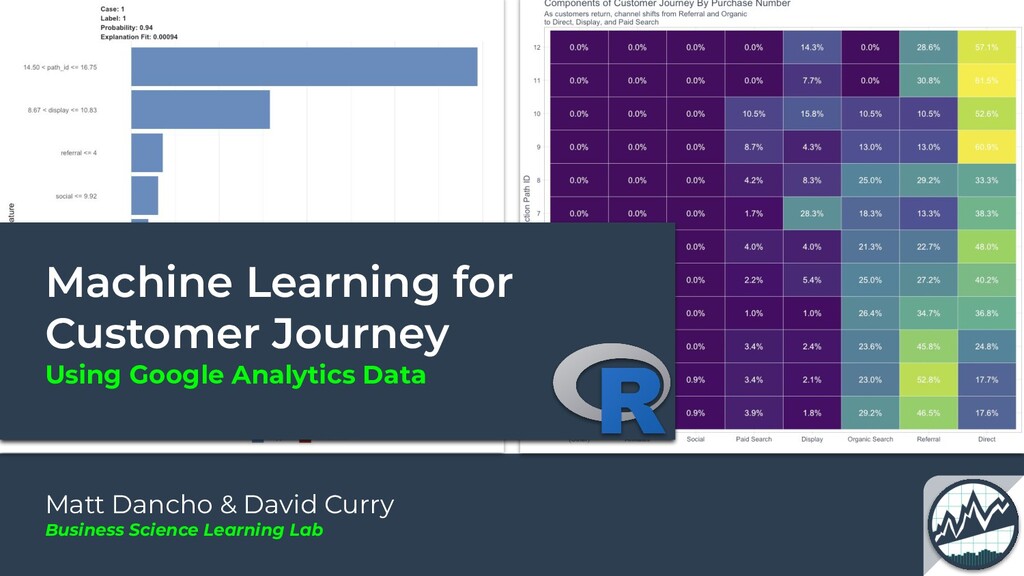
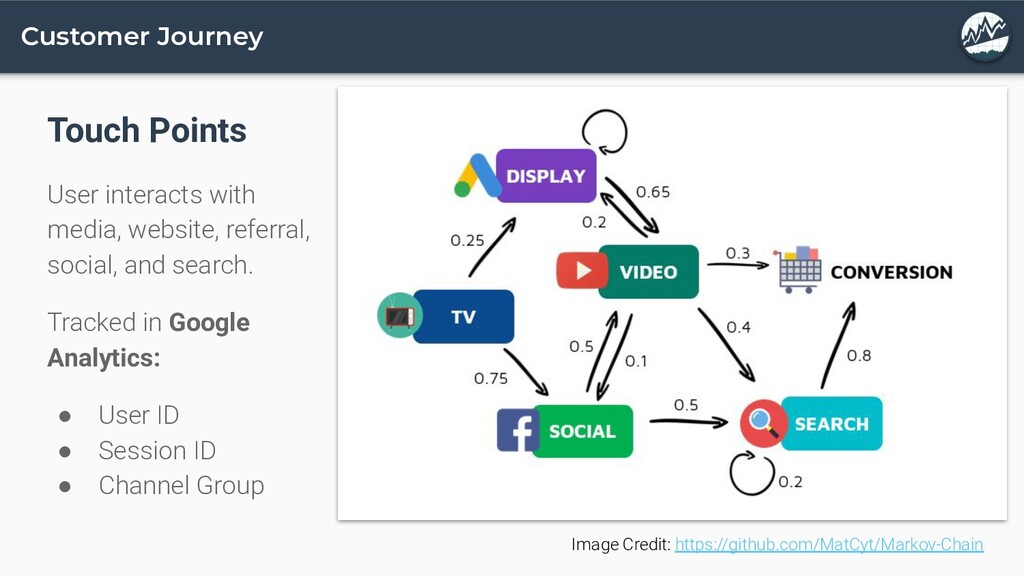
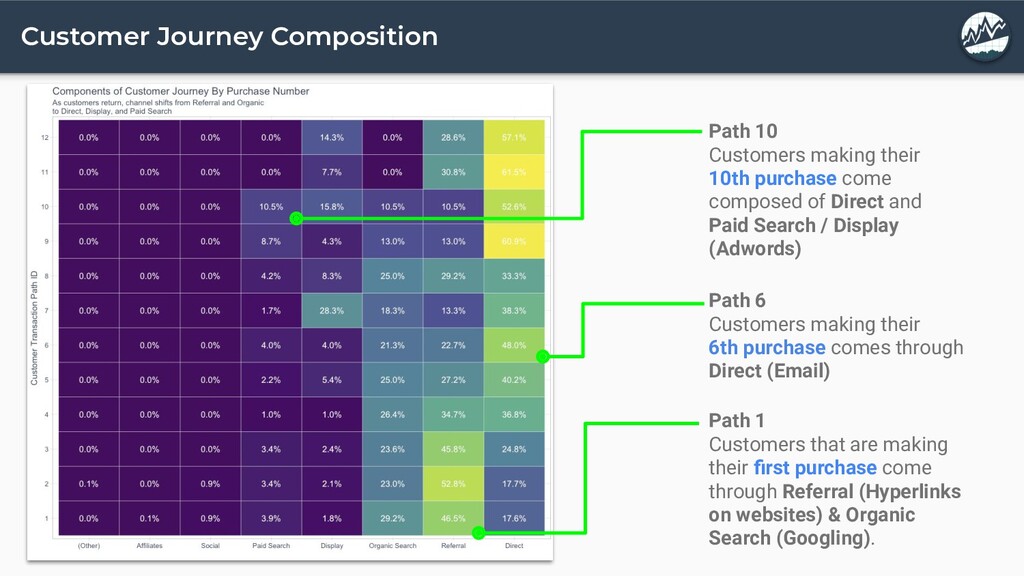
When you understand the Customer Journey, you unlock strategies that your organization needs to target new and existing customers. How do new customers convert? How does this differ from existing customers?

In Learning Lab 26, you learn how to understand the Customer Journey using an innovative approach:

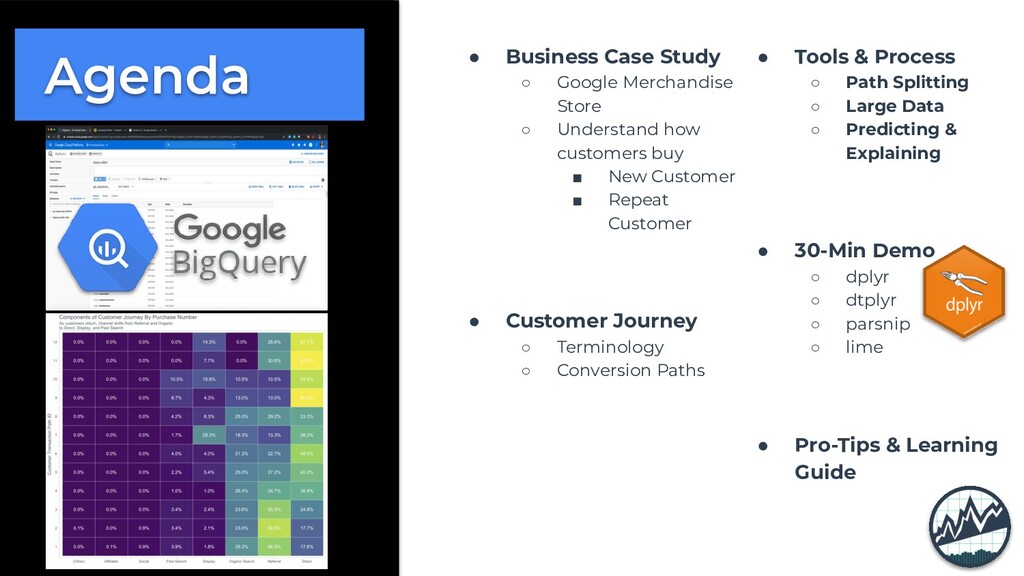
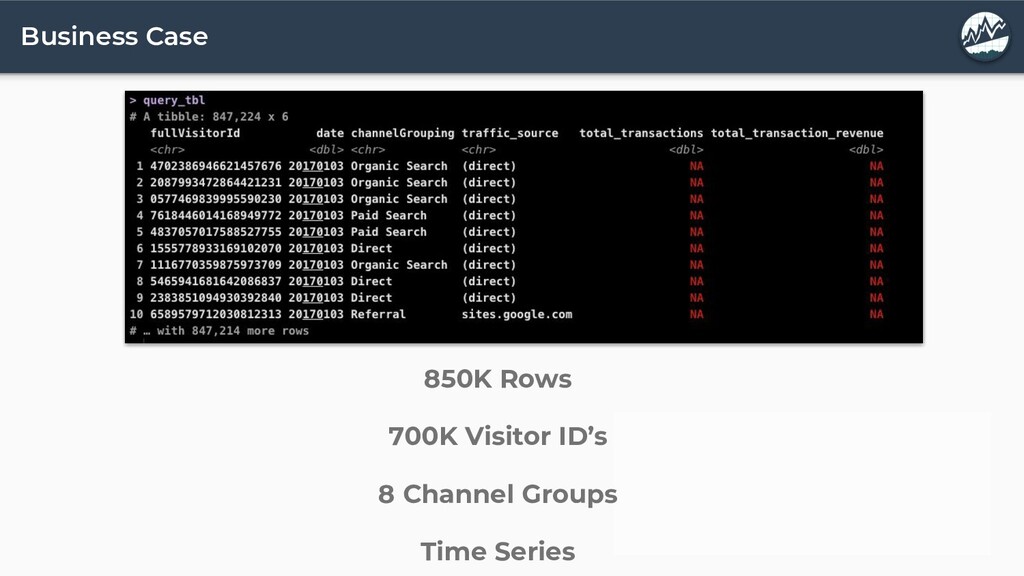
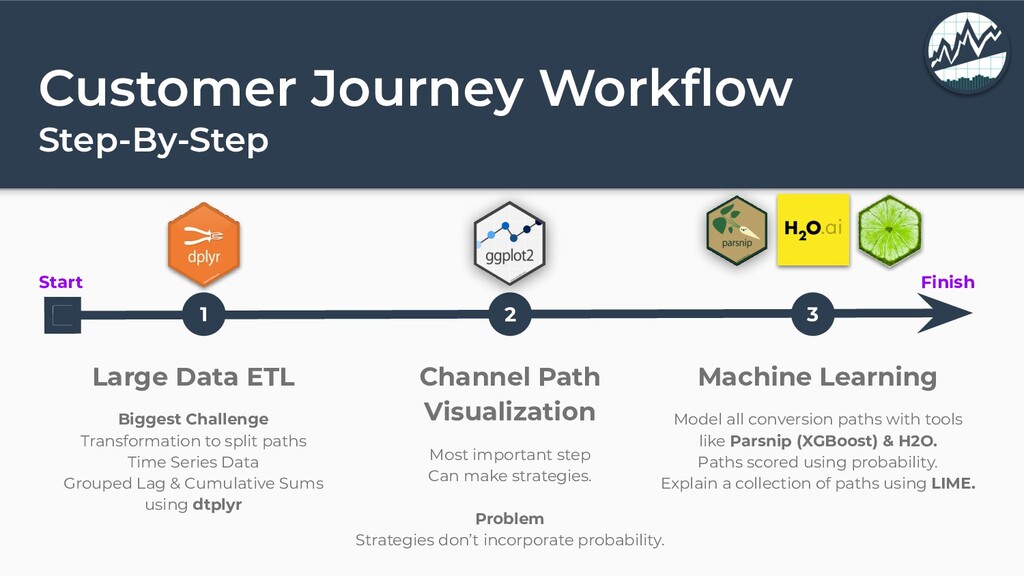
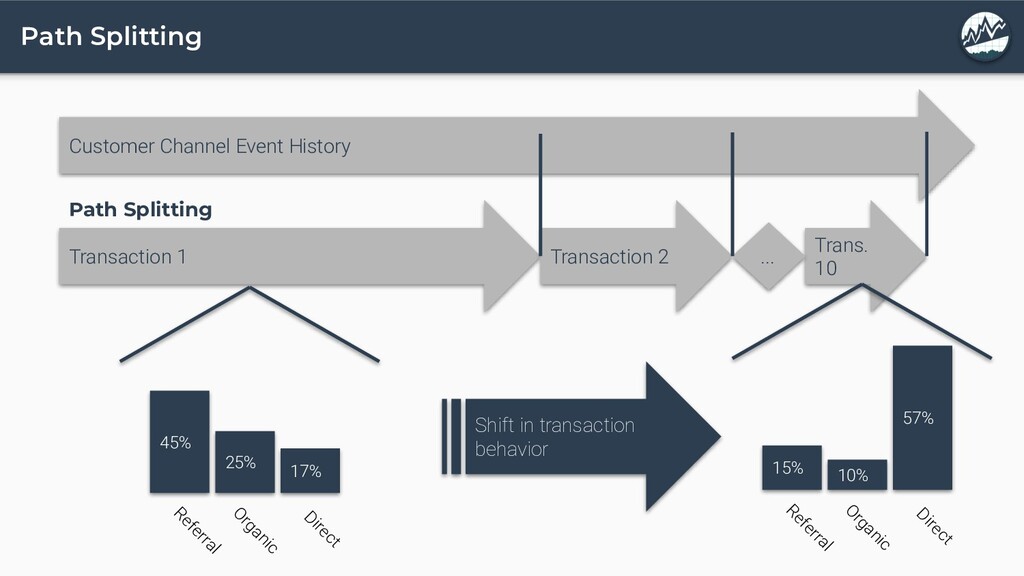
1. Path Splitting - Time-series data manipulation strategies to segment customer conversion paths, the sequence of events leading to a transaction.

2. dtplyr (Big Data) - The data.table backend for dplyr operations. Get a 3X speed improvement versus dplyr. 

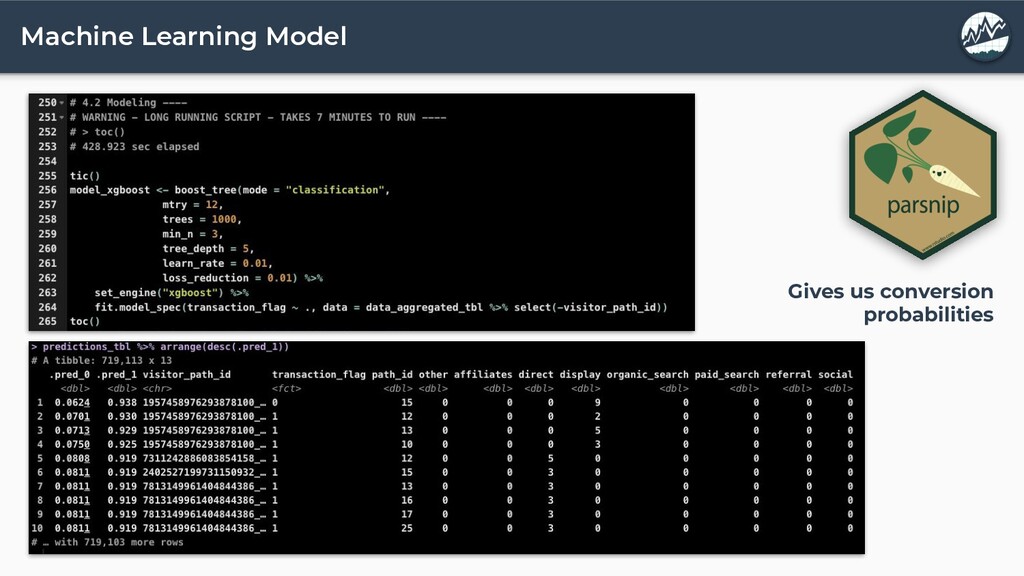
3. XGBoost for Customer Journey Scoring - Machine Learning applied to score the probability of a path conversion. BRAND NEW - No one else is implementing this technique. Unlock it in Lab 26. 

Follow along with our 1-hr 30-minute code lesson using real Google Analytics Data.

Matt Dancho

January 08, 2020
Tweet

More Decks by Matt Dancho

Other Decks in Business

Transcript

  1. Using Google Analytics Data Matt Dancho & David Curry Business

    Science Learning Lab Machine Learning for Customer Journey
  2. Marketing Series • Lab 24 - A/B Testing ◦ Business

    Science’s Website ◦ Infer - Bootstrap & Permutation • Lab 25 - Multi-Channel Attribution (Part 1) ◦ Google Analytics Data ◦ ChannelAttribution • Lab 26 - ML for Customer Journey (Part 2) ◦ Path Splitting ◦ Applied ML for Conversion Probabilities • Lab 27 - Automated Prediction & Tracking Google Trends ◦ Google Trend Forecasting ◦ gtrendsR, forecast ◦ chronR, taskscheduleR
  3. Learning Labs PRO Every 2-Weeks 1-Hour Course Recordings + Code

    + Slack $19/month university.business-science.io Lab 25 - Marketing Series Attribution with ChannelAttribution Lab 24 - Marketing Series A/B Testing with Infer Lab 23 - SQL Series SQL with BigQuery & Conversion Funnel Lab 22 - SQL Series SQL for Time Series Lab 21 - SQL Series SQL for Data Science Lab 20 - Machine Learning Explainable Machine Learning Lab 19 - Network Analysis Using Customer Credit Card History for Networks Analysis Lab 18 - Anomaly Detection Time Series Anomaly Detection with anomalize Continuous Learning Advanced Topics
  4. Agenda • Business Case Study ◦ Google Merchandise Store ◦

    Understand how customers buy ▪ New Customer ▪ Repeat Customer • Customer Journey ◦ Terminology ◦ Conversion Paths • Tools & Process ◦ Path Splitting ◦ Large Data ◦ Predicting & Explaining • 30-Min Demo ◦ dplyr ◦ dtplyr ◦ parsnip ◦ lime • Pro-Tips & Learning Guide
  5. Business Case Google Merchandise Store Customers can purchase t-shirts, gear,

    etc Google Analytics tracks channel sources leading into the website. We are interested in Channels that lead to Transactions. Often called Customer Journey. We seek to understand this. The make actions to increase conversion. https://shop.googlemerchandisestore.com/
  6. Customer Journey Touch Points User interacts with media, website, referral,

    social, and search. Tracked in Google Analytics: • User ID • Session ID • Channel Group Image Credit: https://github.com/MatCyt/Markov-Chain
  7. Customer Journey Transaction Path Patterns Each transaction is part of

    a path. New Customers have only one transaction path. Returning Customers have multiple transaction paths. Patterns for New vs Returning are different.
  8. Customer Journey Composition Path 10 Customers making their 10th purchase

    come composed of Direct and Paid Search / Display (Adwords) Path 1 Customers that are making their first purchase come through Referral (Hyperlinks on websites) & Organic Search (Googling). Path 6 Customers making their 6th purchase comes through Direct (Email)
  9. Goal Path 10 Customers making their 10th purchase come composed

    of Direct and Paid Search / Display Path 1 Customers that are making their first purchase come through Referral (Hyperlinks on websites) & Organic Search (Googling). Path 6 Customers making their 6th purchase comes through Direct (Email) Create an actionable marketing plan
  10. Customer Journey Workflow Step-By-Step Start Finish 1 2 3 Large

    Data ETL Biggest Challenge Transformation to split paths Time Series Data Grouped Lag & Cumulative Sums using dtplyr Channel Path Visualization Most important step Can make strategies. Problem Strategies don’t incorporate probability. Machine Learning Model all conversion paths with tools like Parsnip (XGBoost) & H2O. Paths scored using probability. Explain a collection of paths using LIME.
  11. Path Splitting Customer Channel Event History Transaction 1 Transaction 2

    Trans. 10 45% 25% 17% Referral Organic Direct ... 15% 10% 57% Referral Organic Direct Shift in transaction behavior Path Splitting
  12. Path Splitting Path splitting with dplyr 800K+ unique sessions 700K+

    unique users (groups) Tools (learn these) • Big Data (dtplyr) • ETL (dplyr) Data Skills Needed • Grouped calculations • Time series - lag(), cumsum(), last() • Started at 2-min per calc, reduced to 17-sec
  13. Explainable Machine Learning Describe why ML Model concludes 94% Probability

    Use LIME Explainable Machine Learning to interpret prediction for single observation. • 94% Probability of Conversion • Customer has purchase path count is between 14.5 & 16.75 • Display links clicked between 8.7 and 10.8 Action: Send Email (Direct) to target person and gain conversion
  14. Pro-Tip #1: We need to cross-validate model We did not

    do Cross Validation This is where H2O comes in. Run H2O AutoML overnight, come in the next day with 100+ models that have been 5-Fold Cross Validated. Learn H2O AutoML in • Advanced ML & Business Consulting DS4B 201-R
  15. Pro-Tip #2: Explain Results Locally Executives need strategies to target

    a single customer This is where LIME comes in. Explain why an individual is high likelihood of converting. Develop strategies your organization can use to target high probability customers and convert them. Learn LIME in • Advanced ML & Business Consulting DS4B 201-R
  16. Pro-Tip #3: Productionalize the Results Businesses need apps This is

    where Shiny comes in. Make a shiny app to enable others to use your work. Learn SHINY in: • Shiny Dashboards DS4B 102-R • Shiny Developer w/ AWS DS4B 202-R
  17. Advanced Visualization Advanced Data Wrangling Advanced Functional Programming & Modeling

    Advanced Data Science Visualization Data Cleaning & Manipulation Functional Programming & Modeling Business Reporting Business Analysis with R (DS4B 101-R) Data Science For Business with R (DS4B 201-R) Web Apps & Shiny Developer (DS4B 102-R + DS4B 202A-R) Web Apps Data Science Foundations 7 Weeks Machine Learning & Business Consulting 10 Weeks Web Application Development 12 Weeks -TRACK Project-Based Courses with Business Application Business Science University R-Track 4-Course R-Track System
  18. Key Benefits - Fundamentals - Weeks 1-5 (25 hours of

    Video Lessons) - Data Manipulation (dplyr) - Time series (lubridate) - Text (stringr) - Categorical (forcats) - Visualization (ggplot2) - Programming & Iteration (purrr) - 3 Challenges - Machine Learning - Week 6 (8 hours of Video Lessons) - Clustering (3 hours) - Regression (5 hours) - 2 Challenges - Learn Business Reporting - Week 7 - RMarkdown & plotly - 2 Project Reports: 1. Product Pricing Algo 2. Customer Segmentation Visualization Data Cleaning & Manipulation Functional Programming & Modeling Business Reporting Business Analysis with R (DS4B 101-R) Data Science Foundations 7 Weeks
  19. Key Benefits Understanding the Problem & Preparing Data - Weeks

    1-4 - Project Setup & Framework - Business Understanding / Sizing Problem - Tidy Evaluation - rlang - EDA - Exploring Data -GGally, skimr - Data Preparation - recipes - Correlation Analysis - 3 Challenges Machine Learning - Weeks 5, 6, 7 - H2O AutoML - Modeling Churn - ML Performance - LIME Feature Explanation Return-On-Investment - Weeks 7, 8, 9 - Expected Value Framework - Threshold Optimization - Sensitivity Analysis - Recommendation Algorithm Data Science For Business (DS4B 201-R) Machine Learning & Business Consulting 10 Weeks Advanced Visualization Advanced Data Wrangling Advanced Functional Programming & Modeling Advanced Data Science End-to-End Churn Project
  20. Key Benefits Learn Shiny & Flexdashboard - Build Applications -

    Learn Reactive Programming - Integrate Machine Learning App #1: Predictive Pricing App - Model Product Portfolio - XGBoost Pricing Prediction - Generate new products instantly App #2: Sales Dashboard with Demand Forecasting - Model Demand History - Segment Forecasts by Product & Customer - XGBoost Time Series Forecast - Generate new forecasts instantly Shiny Apps for Business (DS4B 102-R) Web Application Development 4 Weeks Web Apps Machine Learning
  21. Key Benefits Frontend + Backend + Production Deployment Frontend for

    Shiny - Bootstrap Backend for Shiny - MongoDB - Dynamic UI - User Authentication - Store & Write User Data Production Deployment - AWS - EC2 Server - VPC Connection - URL Routing Shiny Apps for Business (DS4B 202A-R) Web Application Development 6 Weeks