Upgrade to Pro — share decks privately, control downloads, hide ads and more …

Shiny Finance with Tidyquant (Excel in R)

Shiny Finance with Tidyquant (Excel in R)

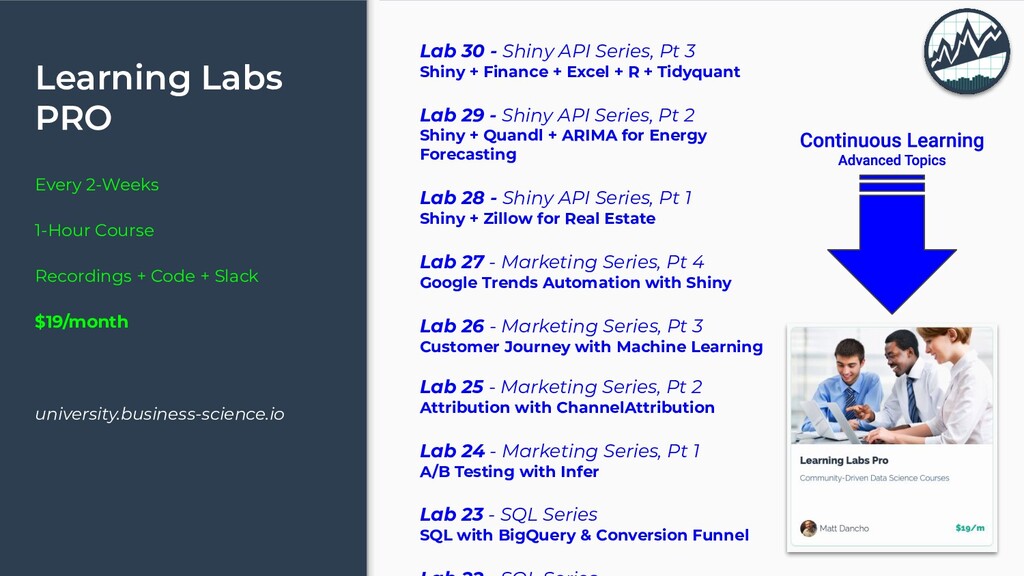
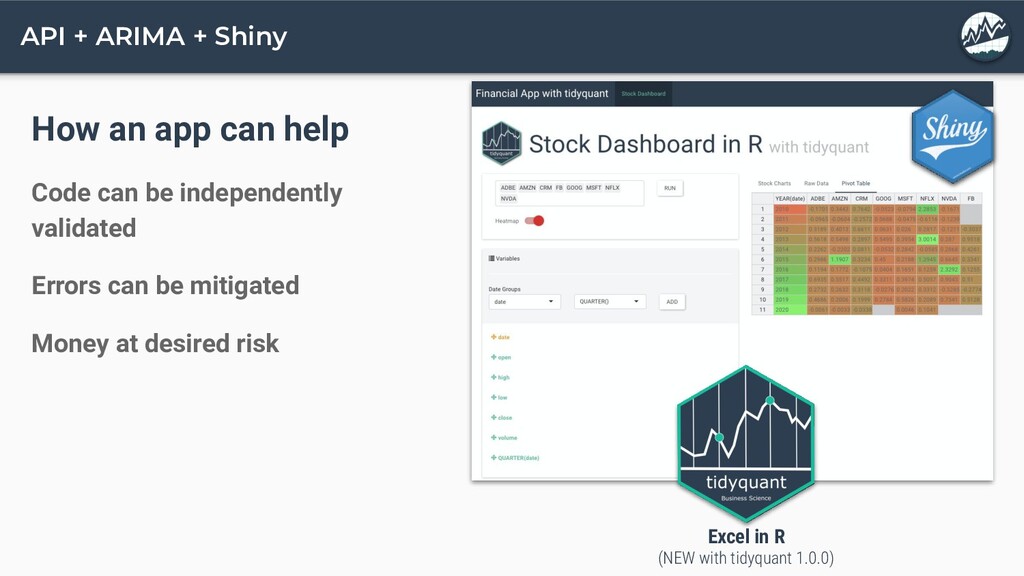
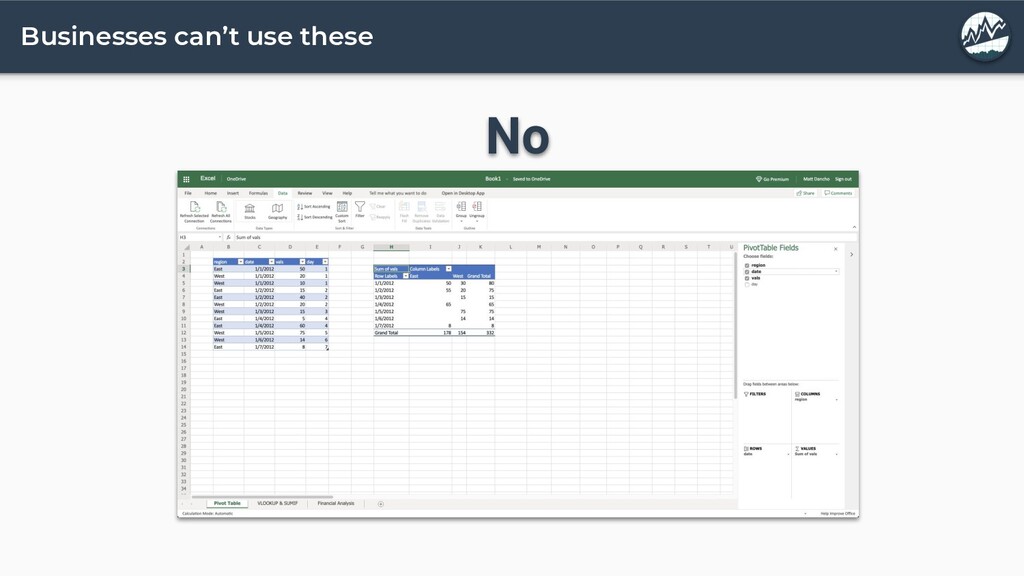
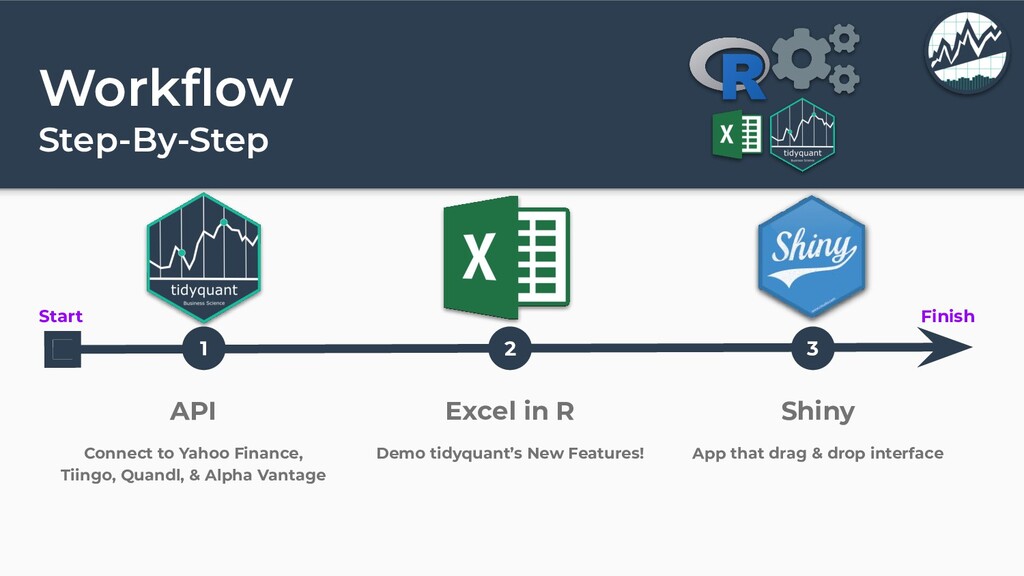
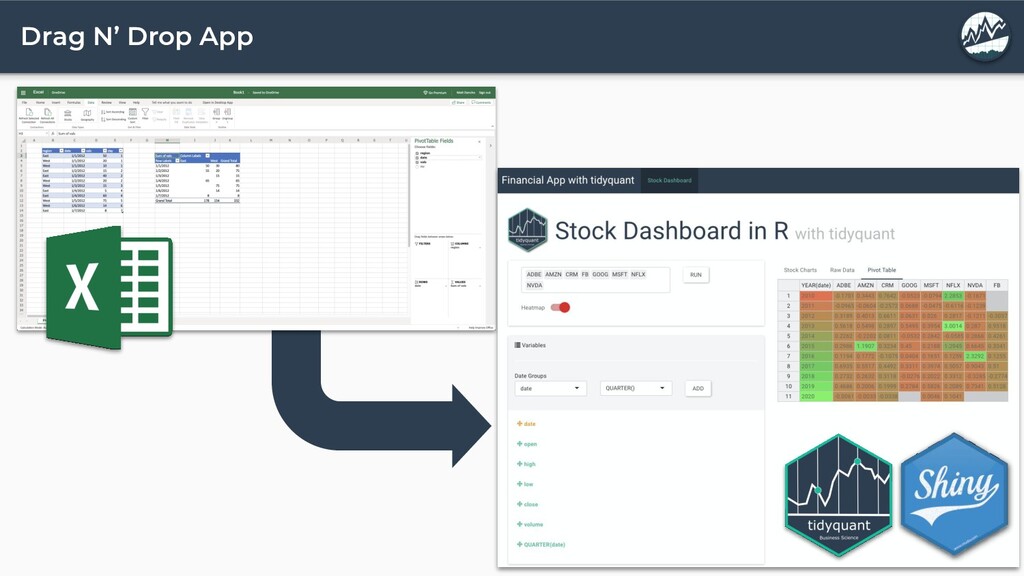
Finance... Excel... R... Now all are one with Tidyquant! In Lab 30, you learn how to use new functionality like Pivot Tables, Vlookups, Sum-Ifs, Net Workdays, and more. Plus you get an AMAZING DRAG N' DROP Pivot Table APP.

Matt Dancho

March 11, 2020
Tweet

More Decks by Matt Dancho

Other Decks in Business

Transcript

  1. With the tidyquant Matt Dancho & David Curry Business Science

    Learning Lab Shiny Finance App (Excel in R)
  2. Shiny API Series • Lab 28 - Shiny Real Estate

    App ◦ Zillow API • Lab 29 - Shiny Oil & Gas App ◦ Quandl API • Lab 30 - Shiny Finance App ◦ Tidyquant API • Lab 31 - Shiny Marketing App ◦ Google Analytics API • Lab 32 - Shiny Twitter App ◦ Twitter API
  3. Learning Labs PRO Every 2-Weeks 1-Hour Course Recordings + Code

    + Slack $19/month university.business-science.io Lab 30 - Shiny API Series, Pt 3 Shiny + Finance + Excel + R + Tidyquant Lab 29 - Shiny API Series, Pt 2 Shiny + Quandl + ARIMA for Energy Forecasting Lab 28 - Shiny API Series, Pt 1 Shiny + Zillow for Real Estate Lab 27 - Marketing Series, Pt 4 Google Trends Automation with Shiny Lab 26 - Marketing Series, Pt 3 Customer Journey with Machine Learning Lab 25 - Marketing Series, Pt 2 Attribution with ChannelAttribution Lab 24 - Marketing Series, Pt 1 A/B Testing with Infer Lab 23 - SQL Series SQL with BigQuery & Conversion Funnel
  4. Agenda • Demo ◦ Shiny App that analyzes stock returns

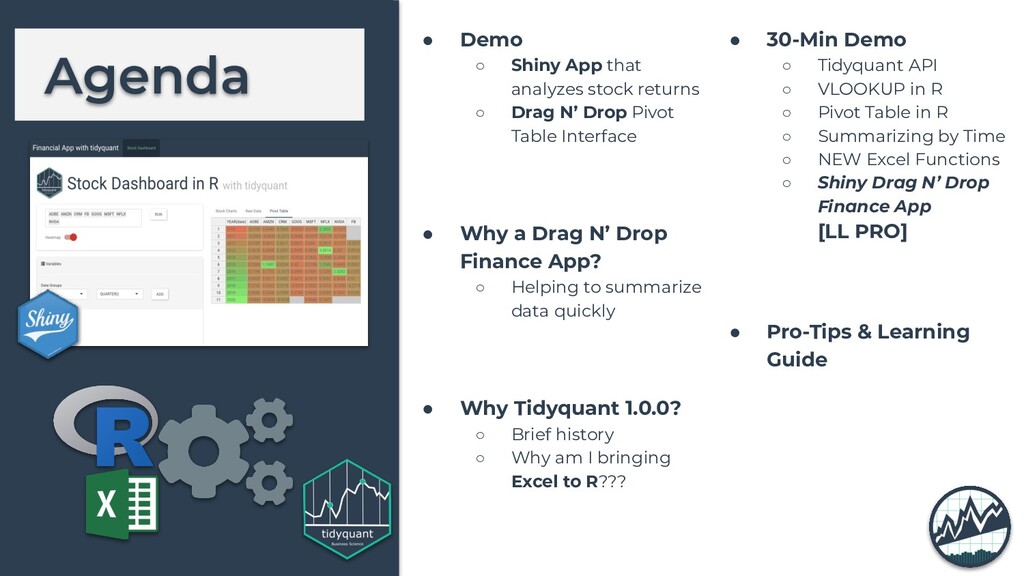
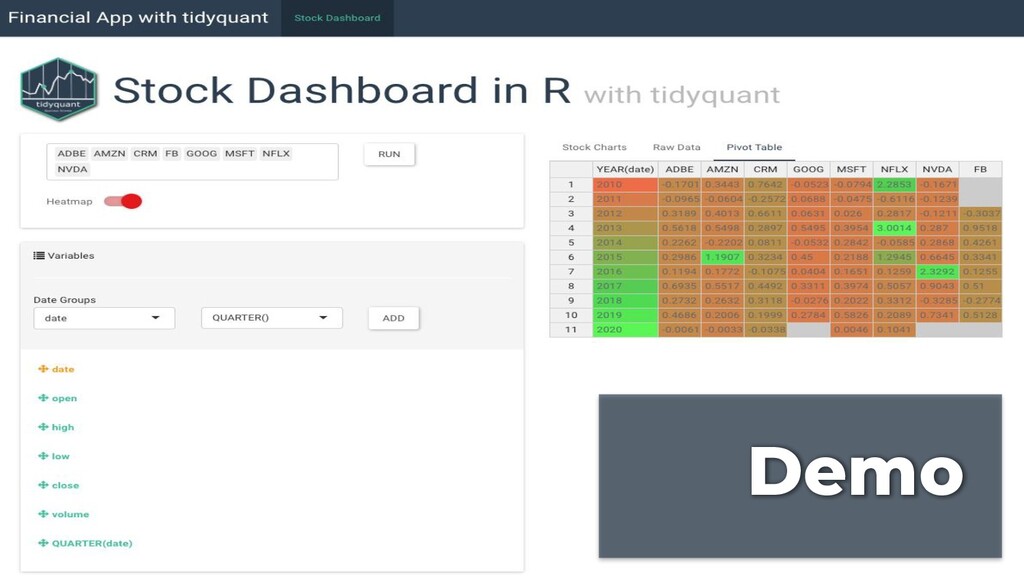
    ◦ Drag N’ Drop Pivot Table Interface • Why a Drag N’ Drop Finance App? ◦ Helping to summarize data quickly • Why Tidyquant 1.0.0? ◦ Brief history ◦ Why am I bringing Excel to R??? • 30-Min Demo ◦ Tidyquant API ◦ VLOOKUP in R ◦ Pivot Table in R ◦ Summarizing by Time ◦ NEW Excel Functions ◦ Shiny Drag N’ Drop Finance App [LL PRO] • Pro-Tips & Learning Guide
  5. Excel is the Number 1 Analytics Tool Excel has powerful

    features Easy Pivot Tables Calculations
  6. Excel is the Number 1 Analytics Tool Excel has issues

    Not reproducible 2. Prone to Errors Leads to major disasters: • • • much higher risk
  7. API + ARIMA + Shiny How an app can help

    Code can be independently validated Errors can be mitigated Money at desired risk Excel in R (NEW with tidyquant 1.0.0)
  8. Brief History of tidyquant: https://business-science.github.io/tidyquant Start Finish 2017 Launched 0.1.0

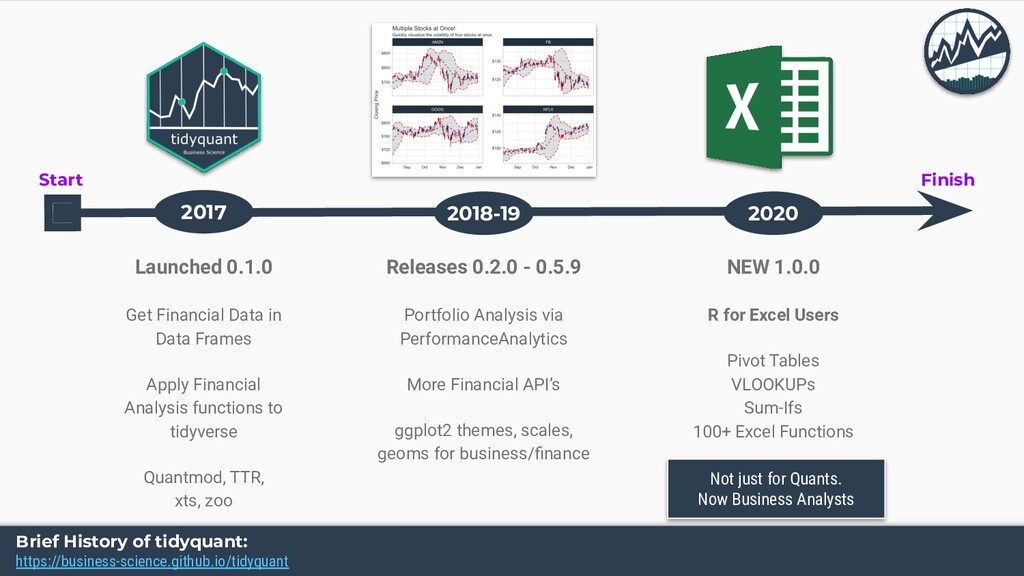
    Get Financial Data in Data Frames Apply Financial Analysis functions to tidyverse Quantmod, TTR, xts, zoo 2018-19 Releases 0.2.0 - 0.5.9 Portfolio Analysis via PerformanceAnalytics More Financial API’s ggplot2 themes, scales, geoms for business/finance 2020 NEW 1.0.0 R for Excel Users Pivot Tables VLOOKUPs Sum-Ifs 100+ Excel Functions Not just for Quants. Now Business Analysts
  9. Why Excel in R via Tidyquant? My 2 goals for

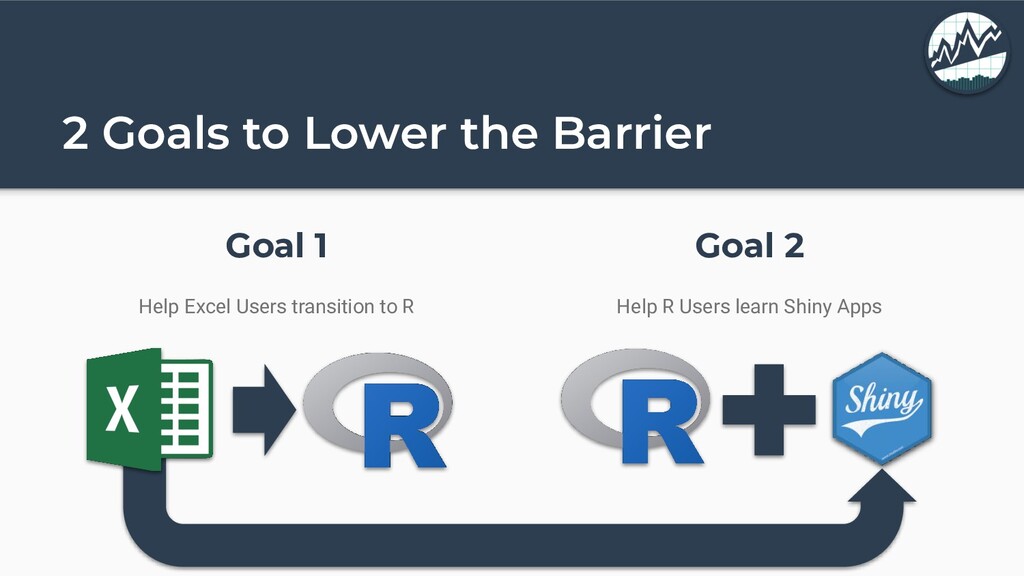
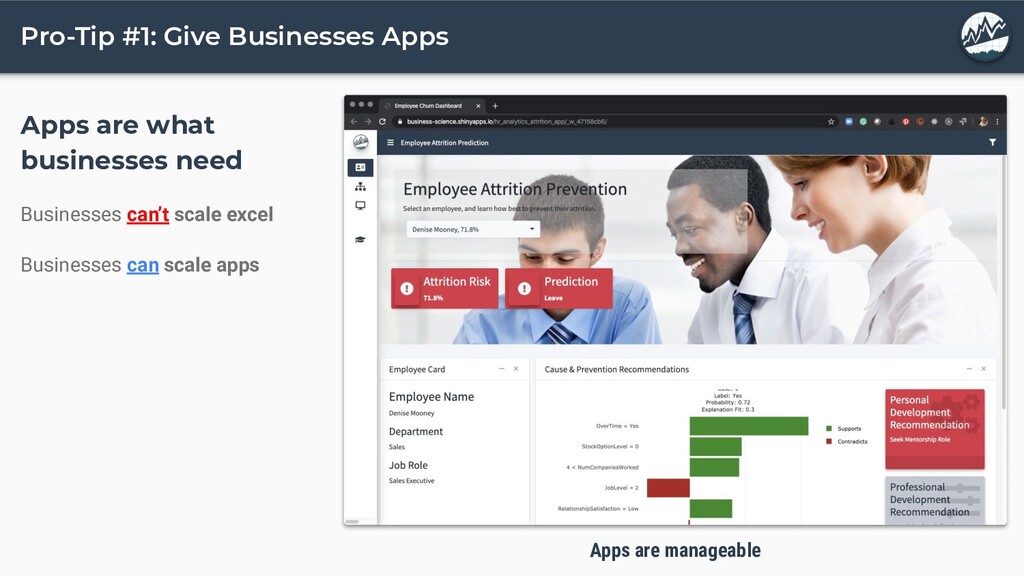
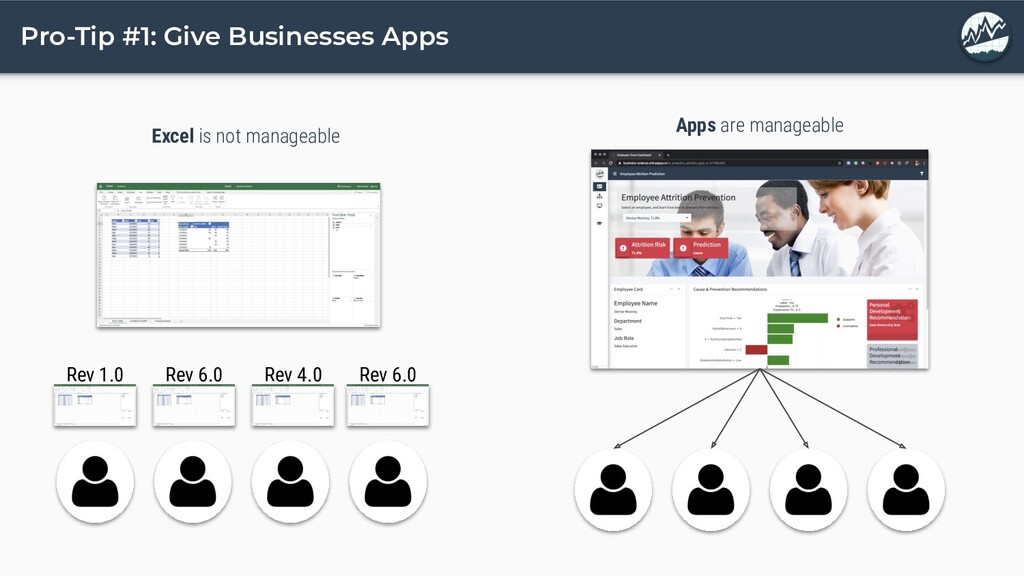
    2020 Goal 1 Help Excel Users transition to R Goal 2 Help R Users learn Shiny Apps Data Science & Machine Learning, Fewer Errors, Bigger Data Businesses Need ML + Apps
  10. 2 Goals to Lower the Barrier Goal 1 Help Excel

    Users transition to R Goal 2 Help R Users learn Shiny Apps
  11. Workflow Step-By-Step Start Finish 1 2 3 API Connect to

    Yahoo Finance, Tiingo, Quandl, & Alpha Vantage Excel in R Demo tidyquant’s New Features! Shiny App that drag & drop interface
  12. Pro-Tip #1: Give Businesses Apps Apps are what businesses need

    Businesses can’t scale excel Businesses can scale apps Apps are manageable
  13. Pro-Tip #1: Give Businesses Apps Apps are manageable Rev 1.0

    Rev 6.0 Rev 4.0 Rev 6.0 Excel is not manageable
  14. Pro-Tip #2: Leverage Shiny by integrating your analysis Shiny is

    production for your analysis Shiny packages up: • Machine Learning • Visualizations • Interactivity Use Shiny to help decision making
  15. Advanced Visualization Advanced Data Wrangling Advanced Functional Programming & Modeling

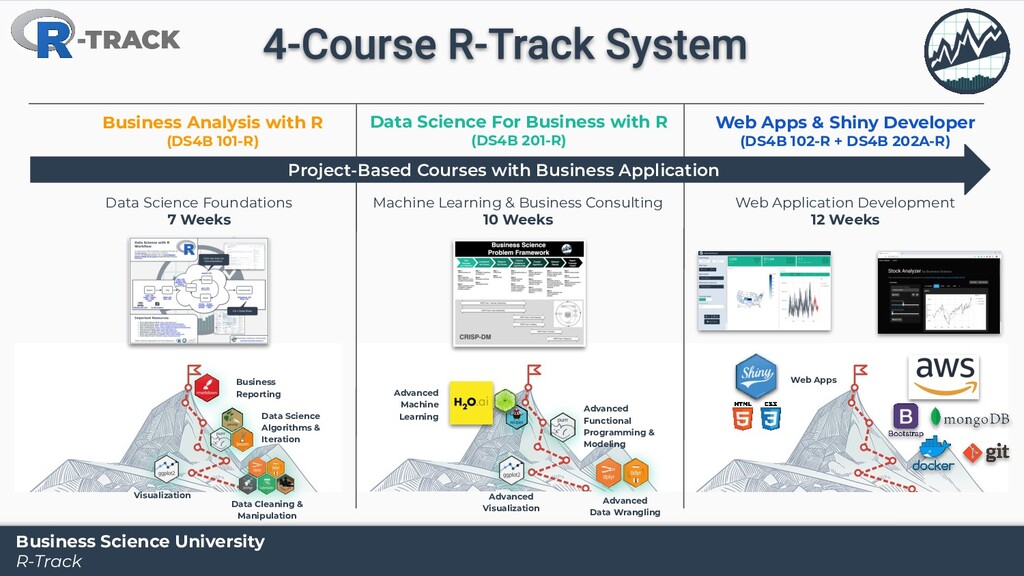
    Advanced Machine Learning Visualization Data Cleaning & Manipulation Data Science Algorithms & Iteration Business Reporting Business Analysis with R (DS4B 101-R) Data Science For Business with R (DS4B 201-R) Web Apps & Shiny Developer (DS4B 102-R + DS4B 202A-R) Web Apps Data Science Foundations 7 Weeks Machine Learning & Business Consulting 10 Weeks Web Application Development 12 Weeks -TRACK Project-Based Courses with Business Application Business Science University R-Track
  16. Key Benefits - Fundamentals - Weeks 1-5 (25 hours of

    Video Lessons) - Data Manipulation (dplyr) - Time series (lubridate) - Text (stringr) - Categorical (forcats) - Visualization (ggplot2) - Programming & Iteration (purrr) - 3 Challenges - Machine Learning - Week 6 (8 hours of Video Lessons) - Clustering (3 hours) - Regression (5 hours) - 2 Challenges - Learn Business Reporting - Week 7 - RMarkdown & plotly - 2 Project Reports: 1. Product Pricing Algo 2. Customer Segmentation Visualization Data Cleaning & Manipulation Business Reporting Business Analysis with R (DS4B 101-R) Data Science Foundations 7 Weeks Data Science Algorithms & Iteration
  17. Key Benefits Understanding the Problem & Preparing Data - Weeks

    1-4 - Project Setup & Framework - Business Understanding / Sizing Problem - Tidy Evaluation - rlang - EDA - Exploring Data -GGally, skimr - Data Preparation - recipes - Correlation Analysis - 3 Challenges Machine Learning - Weeks 5, 6, 7 - H2O AutoML - Modeling Churn - ML Performance - LIME Feature Explanation Return-On-Investment - Weeks 7, 8, 9 - Expected Value Framework - Threshold Optimization - Sensitivity Analysis - Recommendation Algorithm Data Science For Business (DS4B 201-R) Machine Learning & Business Consulting 10 Weeks Advanced Visualization Advanced Data Wrangling Advanced Functional Programming & Modeling Advanced Data Science End-to-End Churn Project
  18. Key Benefits Learn Shiny & Flexdashboard - Build Applications -

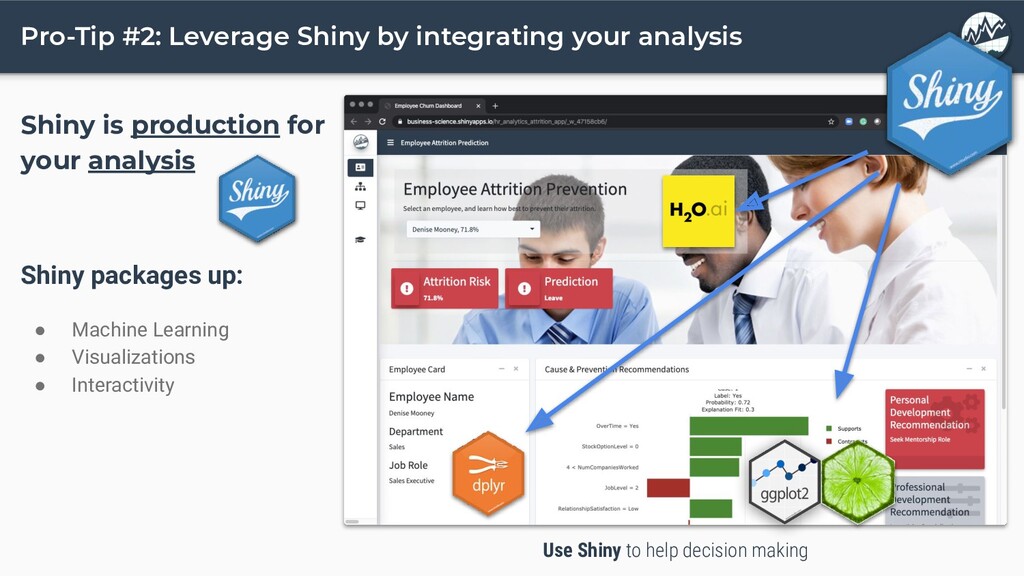
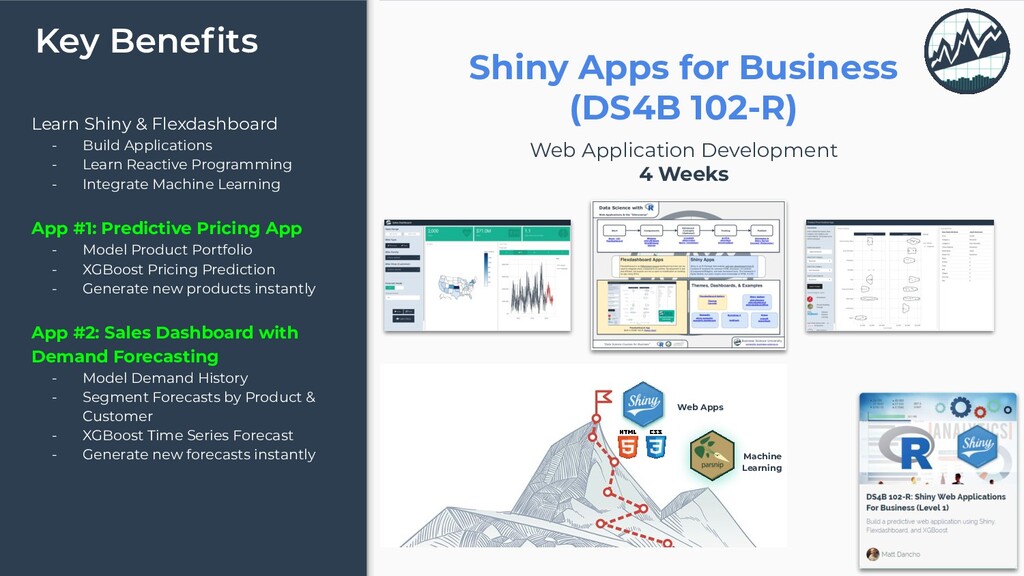
    Learn Reactive Programming - Integrate Machine Learning App #1: Predictive Pricing App - Model Product Portfolio - XGBoost Pricing Prediction - Generate new products instantly App #2: Sales Dashboard with Demand Forecasting - Model Demand History - Segment Forecasts by Product & Customer - XGBoost Time Series Forecast - Generate new forecasts instantly Shiny Apps for Business (DS4B 102-R) Web Application Development 4 Weeks Web Apps Machine Learning
  19. Key Benefits Frontend + Backend + Production Deployment Frontend for

    Shiny - Bootstrap Backend for Shiny - MongoDB Atlas Cloud - Dynamic UI - User Authentication & Security Production Deployment - AWS - EC2 Server - SSL & HTTPS Encryption Shiny Apps for Business (DS4B 202A-R) Web Application Development 6 Weeks