Upgrade to Pro — share decks privately, control downloads, hide ads and more …

A/B Testing - Using infer & Google Optimize

Matt Dancho
December 05, 2019

A/B Testing - Using infer & Google Optimize

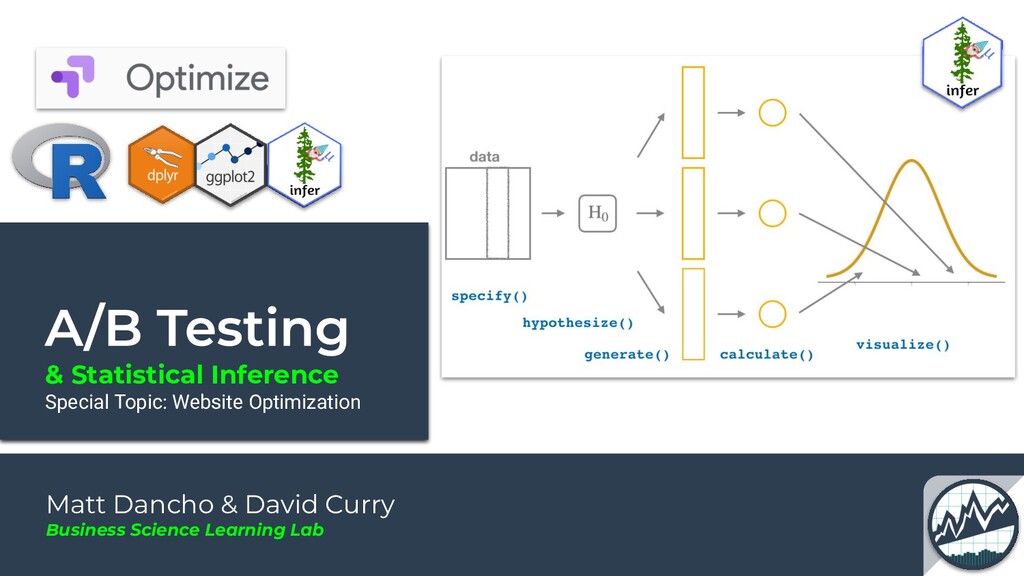
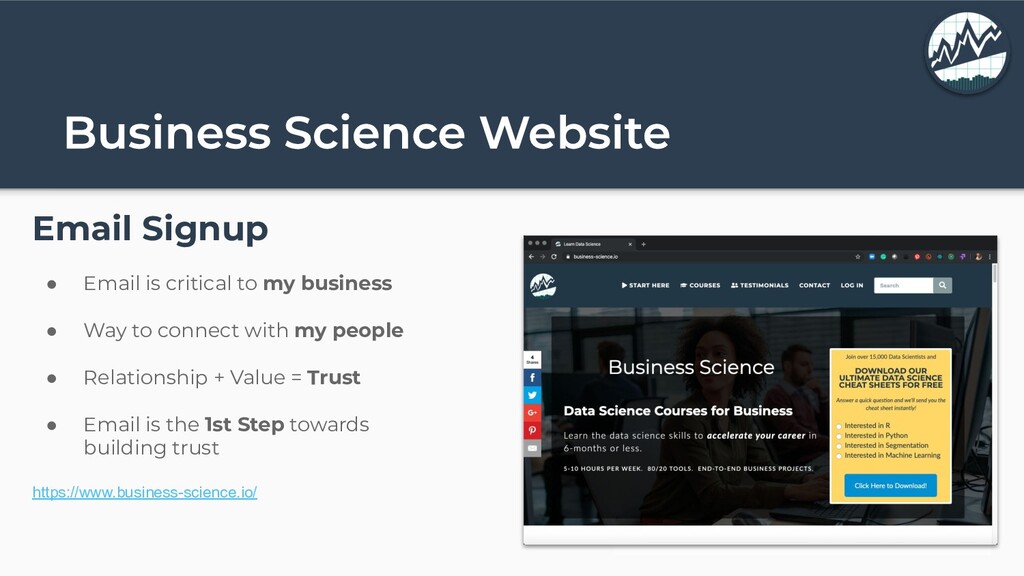
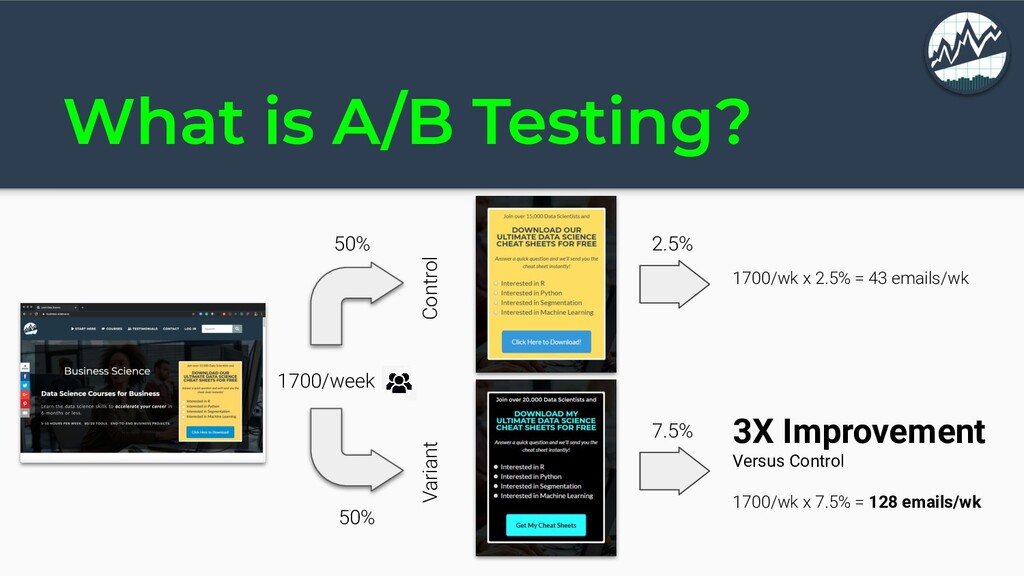
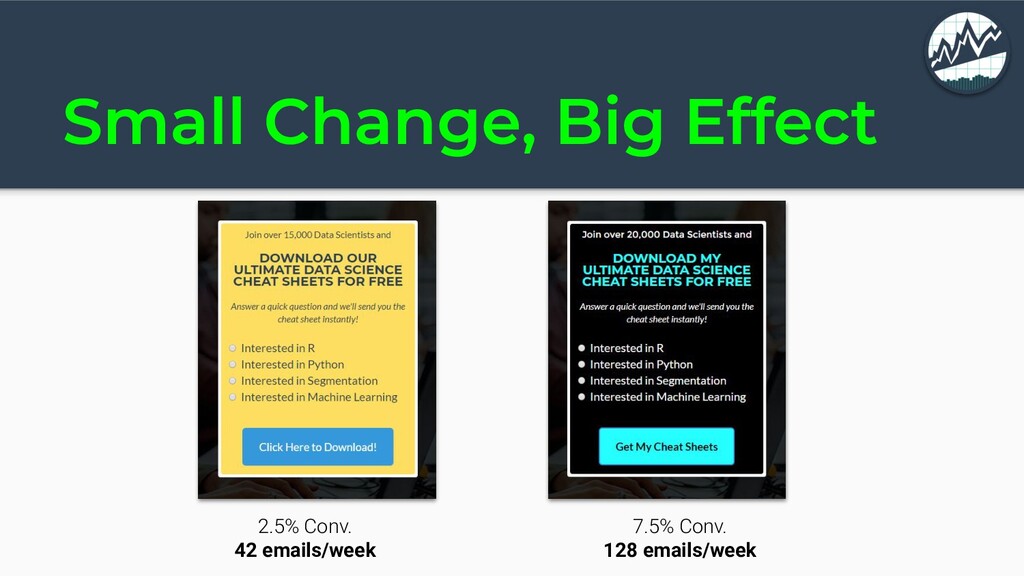
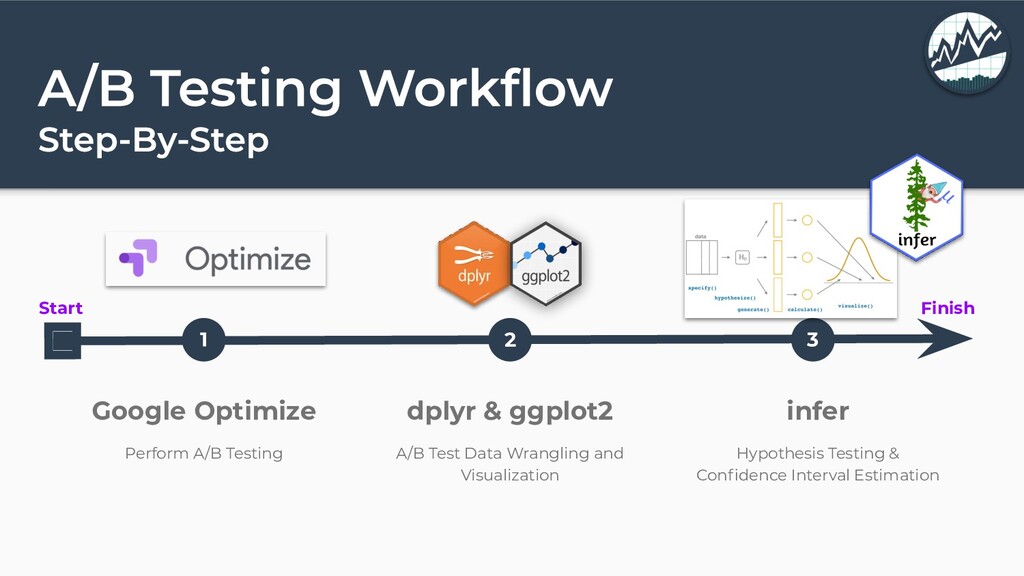
A/B Testing can 100X the ROI from your Website. In this presentation I show you how to A/B Test using tools like Google Optimize and the R Ecosystem (including the new infer R package). See how simple changes resulted in 3X increase in email conversion for our "Download My Cheat Sheet" signup form.

Topic Covered:
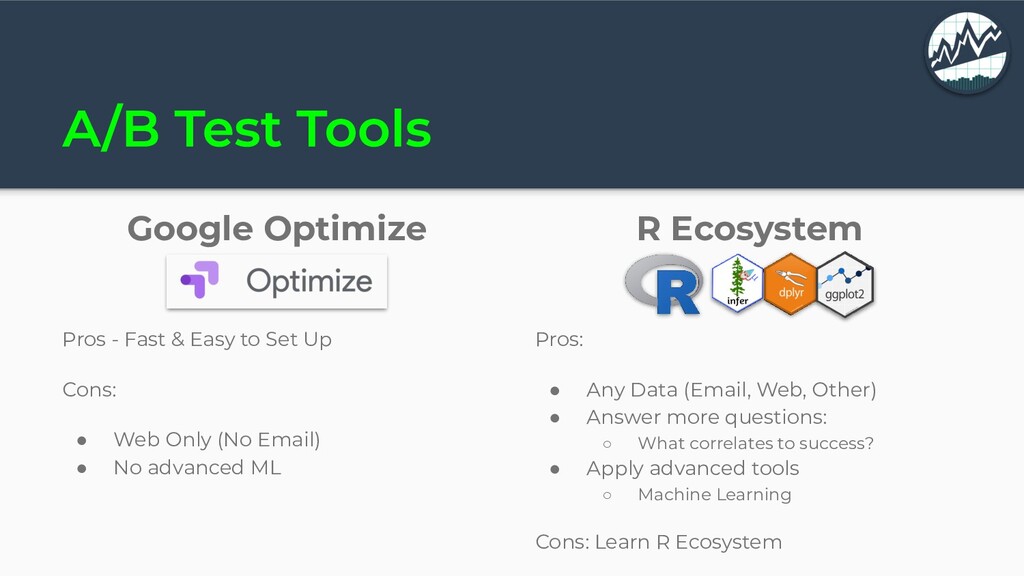
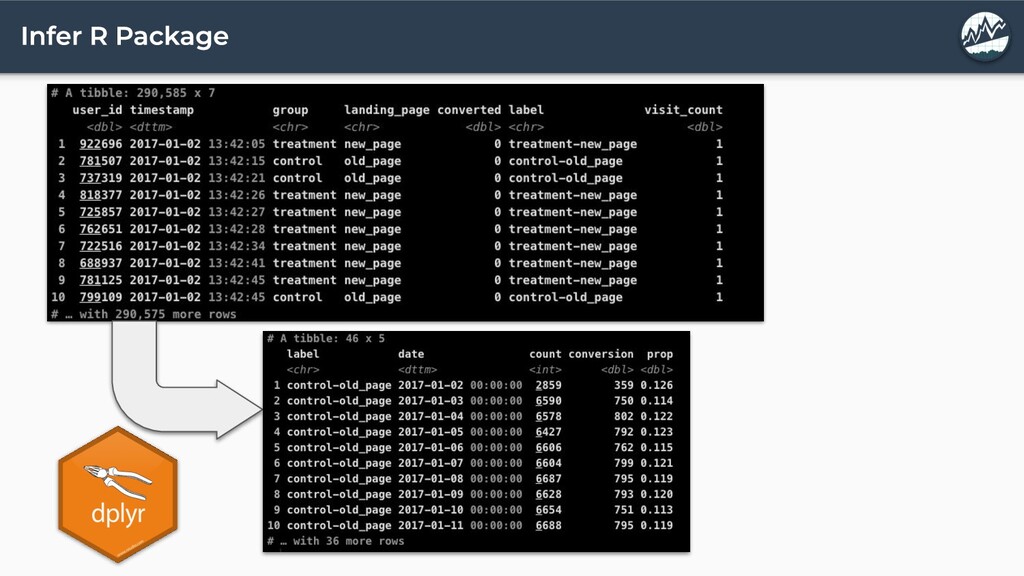
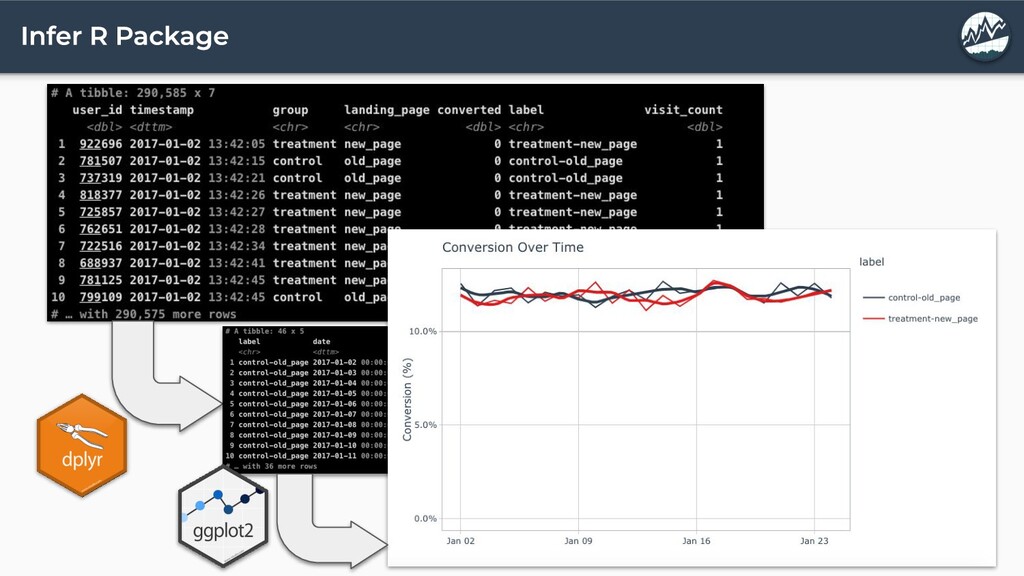
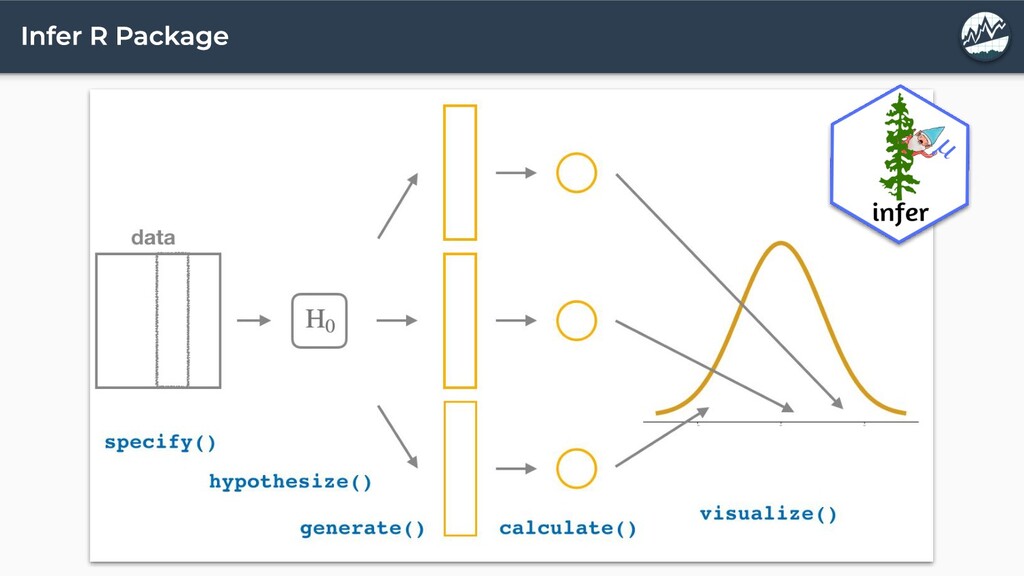
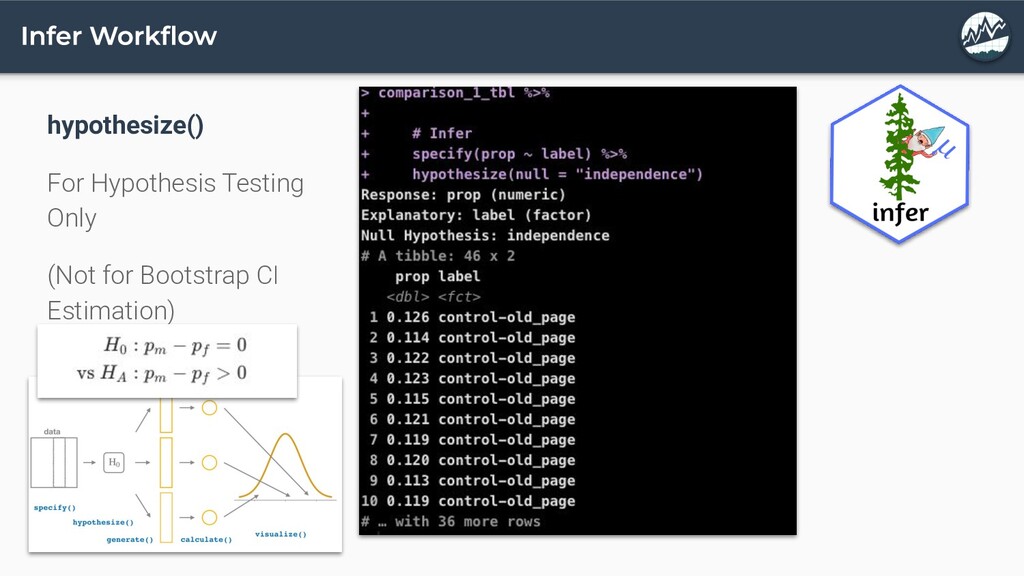
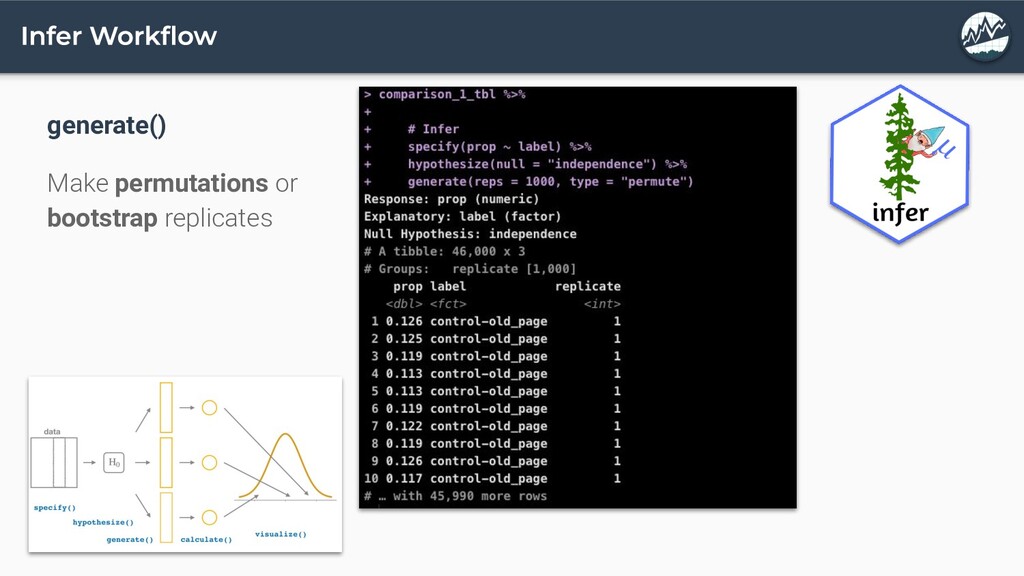
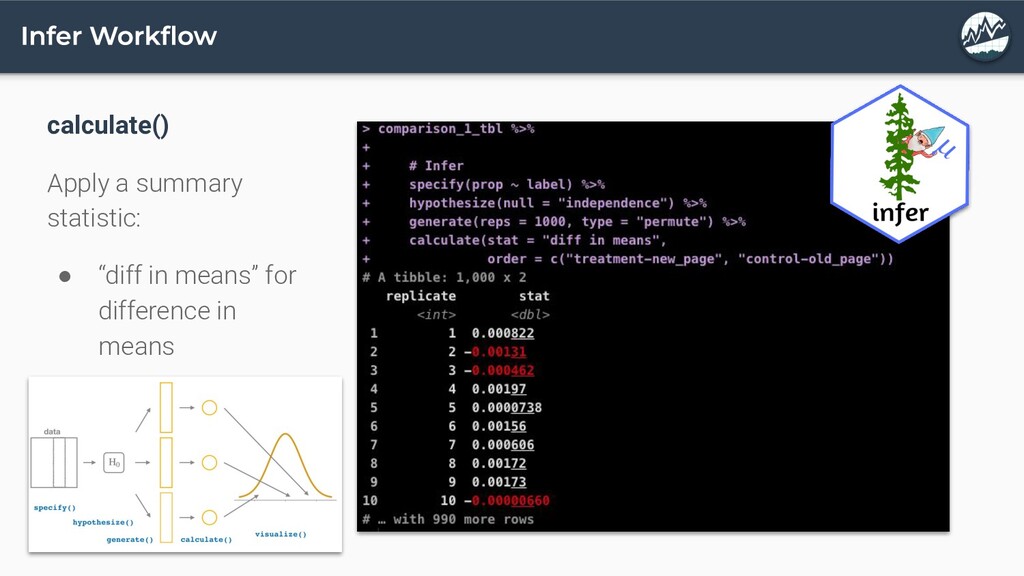
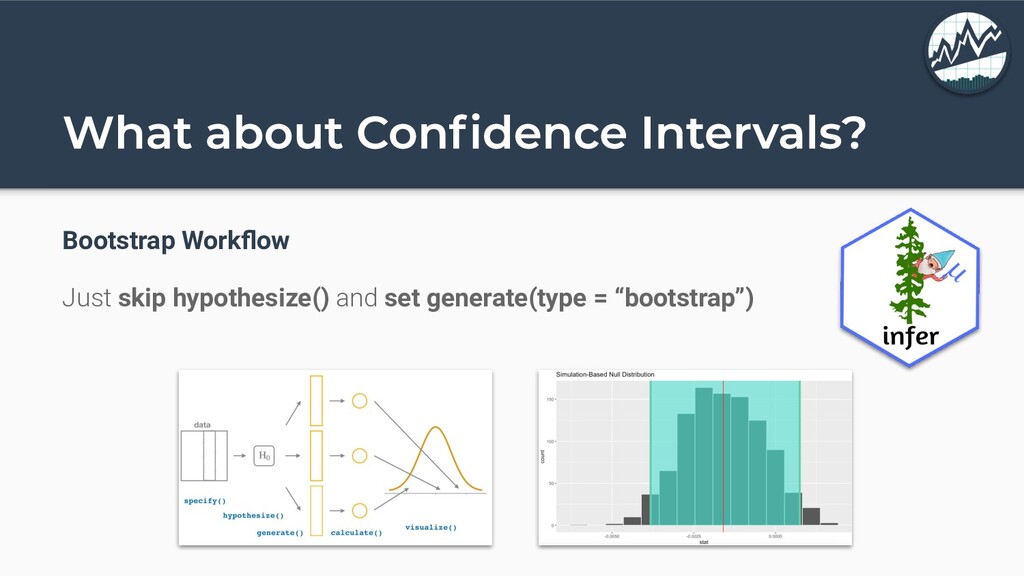
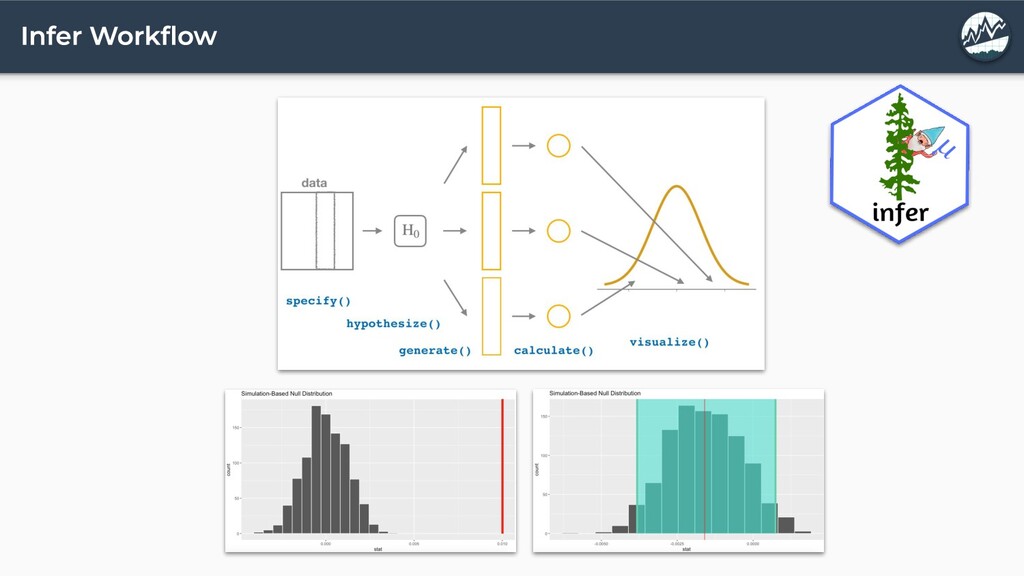
- infer - Tidy workflow for Hypothesis Testing & Bootstrap Confidence Interval Estimation
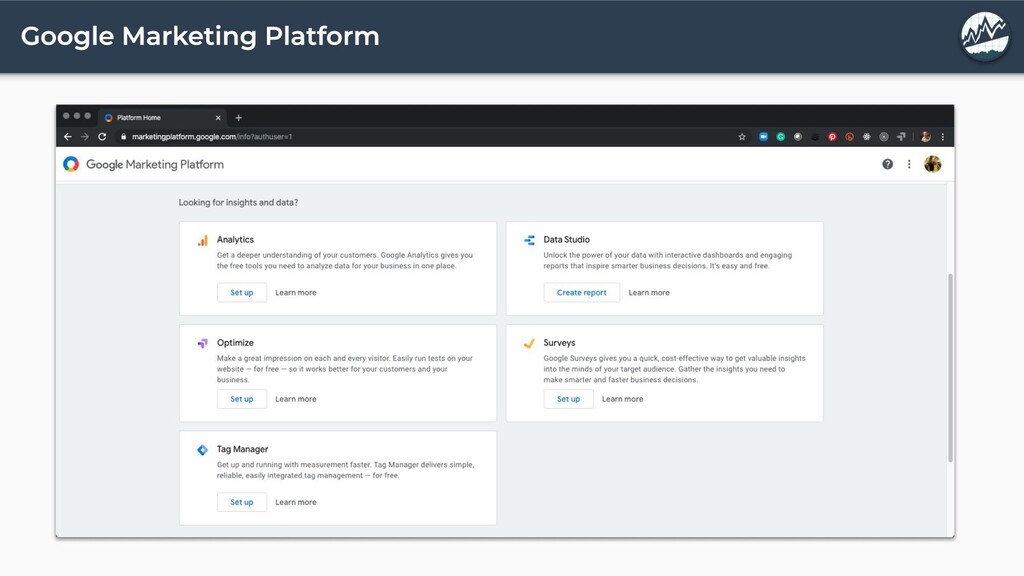
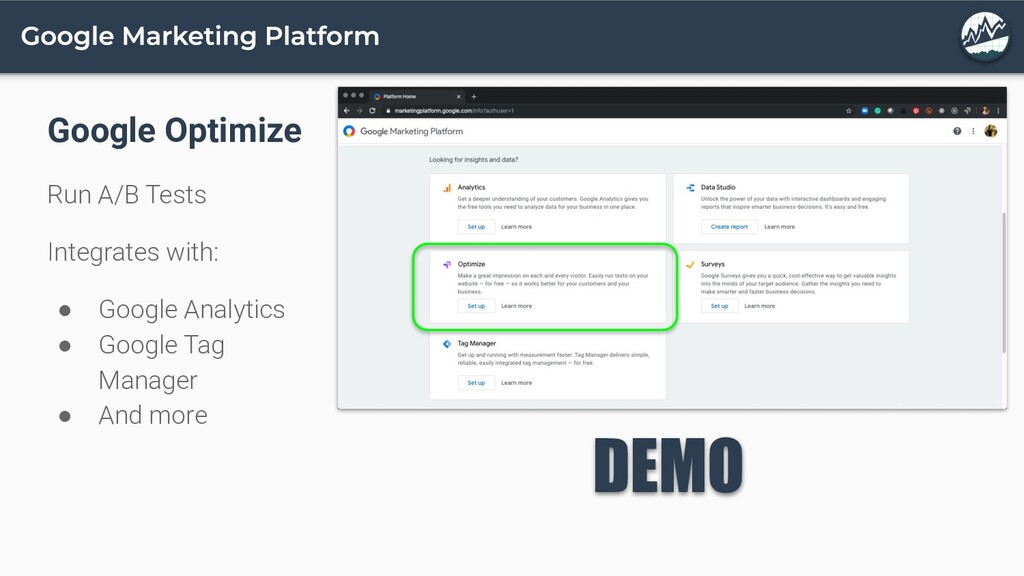
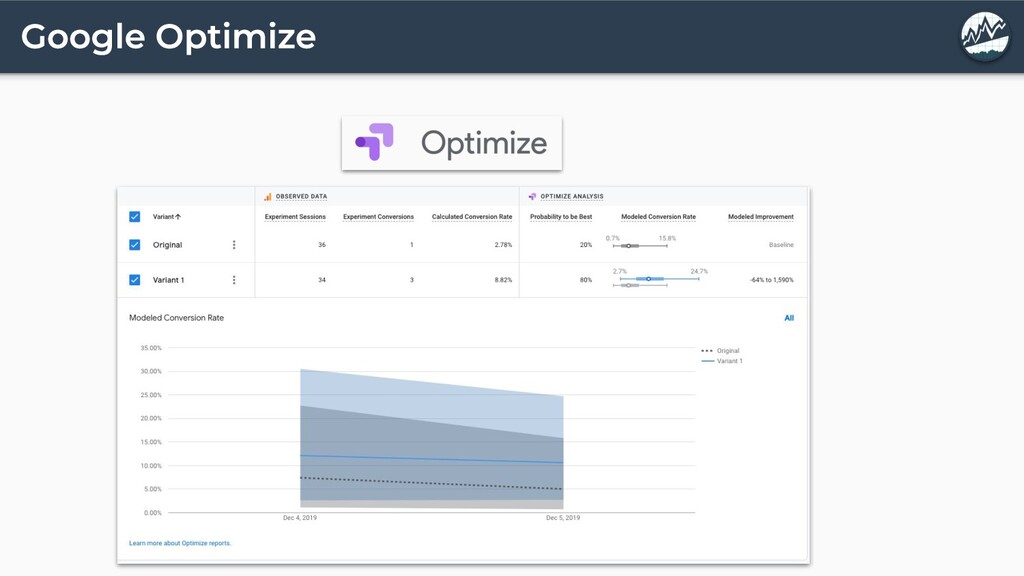
- Google Optimize - Part of Google Marketing Platform, used for A/B Testing Websites

Matt Dancho

December 05, 2019
Tweet

More Decks by Matt Dancho

Other Decks in Business

Transcript

  1. • Business Case Study ◦ Website Optimization ◦ A/B Testing

    • A/B Testing ◦ What is it? ◦ What can you do? • Google Optimize ◦ Free tool for A/B Testing • Statistical Inferences ◦ 80/20 Concepts ◦ R package infer • 30-Min Demo ◦ A/B Test Analysis in R w/ infer • Pro-Tips & Learning Guide ◦ Recap + Pro-Tips ◦ Learning Plan
  2. Every 2-Weeks 1-Hour Course Recordings + Code + Slack $19/month

    university.business-science.io Lab 23 BigQuery & Conversion Funnel Lab 22 SQL for Time Series Lab 21 SQL for Data Science Lab 20 Explainable Machine Learning Lab 19 Using Customer Credit Card History for Networks Analysis Lab 18 Time Series Anomaly Detection with anomalize Lab 17 Anomaly Detection with H2O Machine Learning Continuous Learning Jet Fuel for your Brain
  3. Email Signup • Email is critical to my business •

    Way to connect with my people • Relationship + Value = Trust • Email is the 1st Step towards building trust https://www.business-science.io/
  4. For Business Science 1. Google made a new tool Google

    Optimize that helps with A/B Testing for websites 2. All-in-one tool which helps streamline the A/B test process 3. Integrates with Google Tag Manager & Google Analytics 4. Other types of Conversions ◦ Email Marketing - Test email variants
  5. Control Variant 50% 50% 1700/week 2.5% 7.5% 3X Improvement Versus

    Control 1700/wk x 7.5% = 128 emails/wk 1700/wk x 2.5% = 43 emails/wk
  6. How to optimize? Improving your website using statistically significant results

    Website • Solve pain points • Improve ROI from web traffic • Reduce bounce rate • Improve customer experience • Achieve better results What interests your prospective subscribers? Finding content & topics that connect you to your people. Blog • Improve web traffic & click rates • Optimize title (traffic) • Optimize image (traffic) • Optimize content (click) What interests your current subscribers? Finding content & topics that grow your relationship with your people. Email • Improve Open & Click Rates • Optimize title (traffic) • Optimize image (click) • Optimize content (click)
  7. Google Optimize Pros - Fast & Easy to Set Up

    Cons: • Web Only (No Email) • No advanced ML R Ecosystem Pros: • Any Data (Email, Web, Other) • Answer more questions: ◦ What correlates to success? • Apply advanced tools ◦ Machine Learning Cons: Learn R Ecosystem
  8. Hypothesis (Permutation) Probability of a conversion more extreme than 1.0%

    Confidence Interval (Bootstrap) 95% of time the difference in conversion is within this Confidence Interval window
  9. #1. Visualize Over Time If conversion aggregation by day, run

    for at least 2 weeks Don’t just go off of mean: Outliers, changes in rates, can affect . #2. Use Bootstrap for Confidence Intervals Explain: 95% of time the range is between -0.38% and +0.01% with the mean of -0.16%. Use Significance: Say with significance that we should or should not make the change.
  10. Can I trust this number? Absolutely not. I haven’t run

    for 2 weeks. I don’t know if this trend will persist.
  11. Start Finish 1 2 3 Google Optimize Perform A/B Testing

    dplyr & ggplot2 A/B Test Data Wrangling and Visualization infer Hypothesis Testing & Confidence Interval Estimation
  12. 201

  13. Advanced Visualization Advanced Data Wrangling Advanced Functional Programming & Modeling

    Advanced Data Science Visualization Data Cleaning & Manipulation Functional Programming & Modeling Business Reporting Business Analysis with R (DS4B 101-R) Data Science For Business with R (DS4B 201-R) Web Apps & Shiny Developer (DS4B 102-R + DS4B 202A-R) Web Apps Data Science Foundations 7 Weeks Machine Learning & Business Consulting 10 Weeks Web Application Development 12 Weeks Business Science University R-Track 4-Course R-Track System
  14. - Fundamentals - Weeks 1-5 (25 hours of Video Lessons)

    - Data Manipulation (dplyr) - Time series (lubridate) - Text (stringr) - Categorical (forcats) - Visualization (ggplot2) - Programming & Iteration (purrr) - 3 Challenges - Machine Learning - Week 6 (8 hours of Video Lessons) - Clustering (3 hours) - Regression (5 hours) - 2 Challenges - Learn Business Reporting - Week 7 - RMarkdown & plotly - 2 Project Reports: 1. Product Pricing Algo 2. Customer Segmentation Visualization Data Cleaning & Manipulation Functional Programming & Modeling Business Reporting Business Analysis with R (DS4B 101-R) Data Science Foundations 7 Weeks
  15. Understanding the Problem & Preparing Data - Weeks 1-4 -

    Project Setup & Framework - Business Understanding / Sizing Problem - Tidy Evaluation - rlang - EDA - Exploring Data -GGally, skimr - Data Preparation - recipes - Correlation Analysis - 3 Challenges Machine Learning - Weeks 5, 6, 7 - H2O AutoML - Modeling Churn - ML Performance - LIME Feature Explanation Return-On-Investment - Weeks 7, 8, 9 - Expected Value Framework - Threshold Optimization - Sensitivity Analysis - Recommendation Algorithm Data Science For Business (DS4B 201-R) Machine Learning & Business Consulting 10 Weeks Advanced Visualization Advanced Data Wrangling Advanced Functional Programming & Modeling Advanced Data Science End-to-End Churn Project
  16. Learn Shiny & Flexdashboard - Build Applications - Learn Reactive

    Programming - Integrate Machine Learning App #1: Predictive Pricing App - Model Product Portfolio - XGBoost Pricing Prediction - Generate new products instantly App #2: Sales Dashboard with Demand Forecasting - Model Demand History - Segment Forecasts by Product & Customer - XGBoost Time Series Forecast - Generate new forecasts instantly Shiny Apps for Business (DS4B 102-R) Web Application Development 4 Weeks Web Apps Machine Learning
  17. Frontend + Backend + Production Deployment Frontend for Shiny -

    Bootstrap Backend for Shiny - MongoDB - Dynamic UI - User Authentication - Store & Write User Data Production Deployment - AWS - EC2 Server - VPC Connection - URL Routing Shiny Apps for Business (DS4B 202A-R) Web Application Development 6 Weeks