Upgrade to Pro — share decks privately, control downloads, hide ads and more …

SLOs that Lie

SLOs that Lie

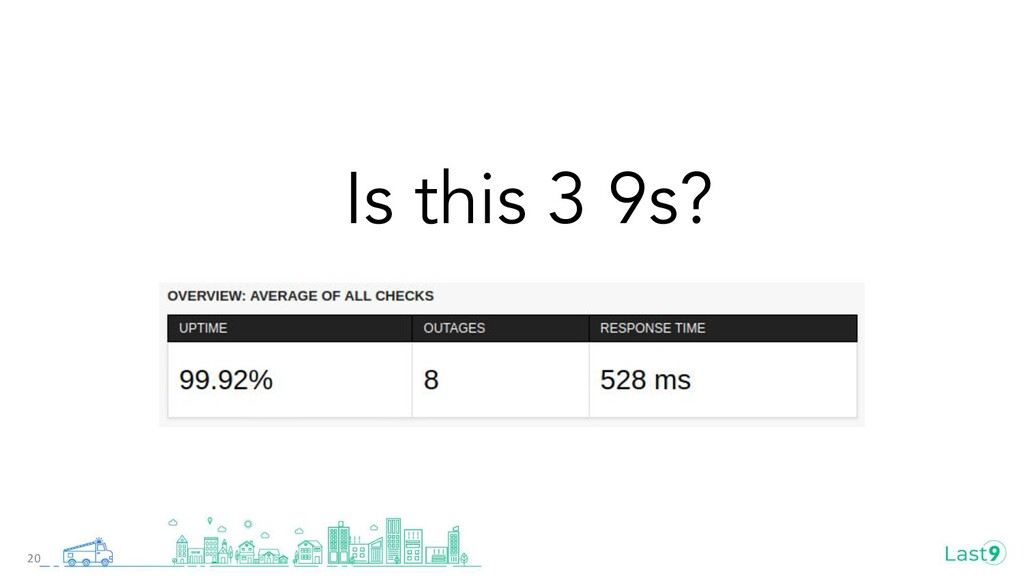
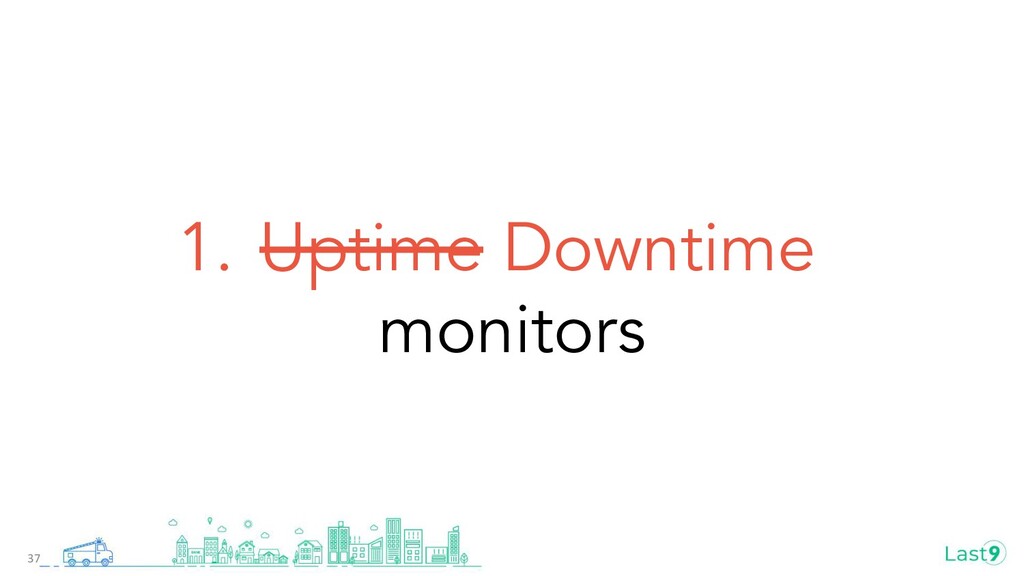
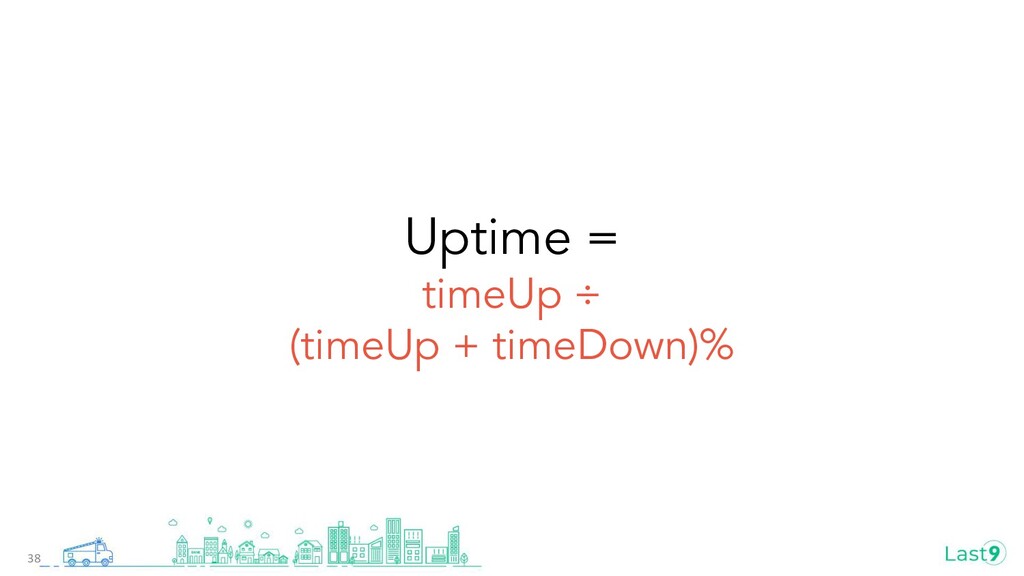
- Is uptime really the right measure of your reliability?
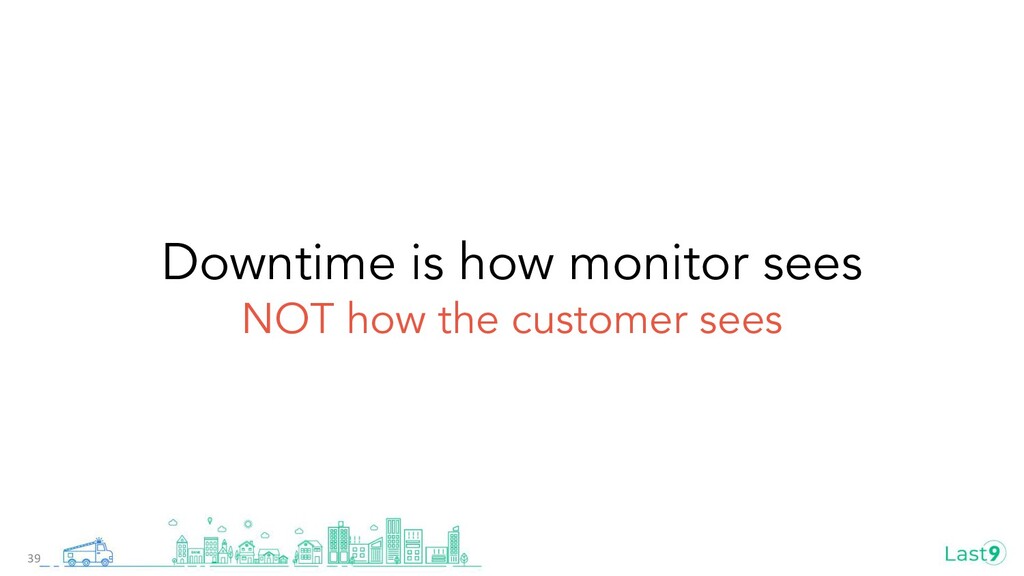
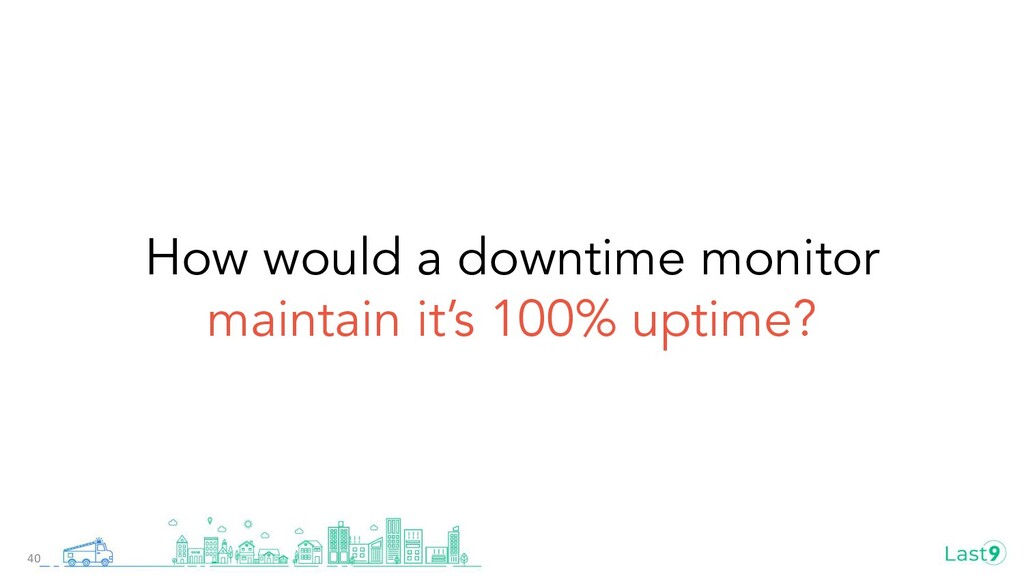
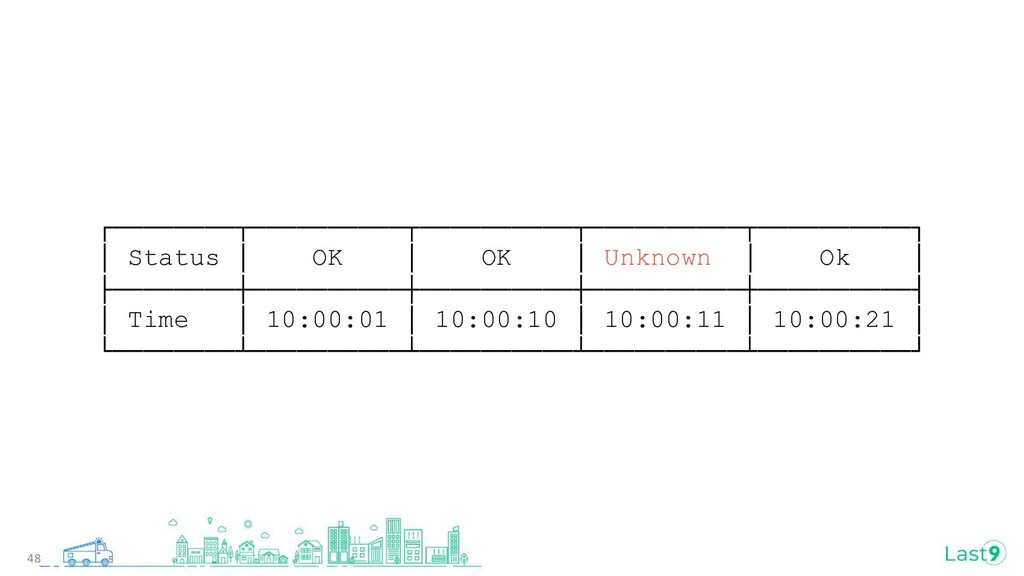
- What happens when that which monitors downtime has downtime?
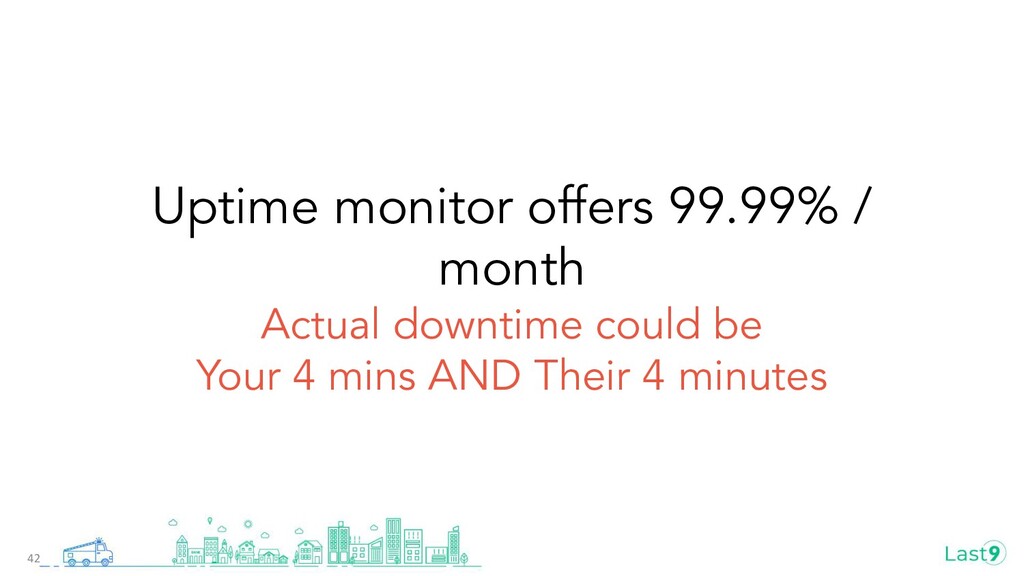
- If upstream/downstream is down - how does it impact your numbers?
- Find answers to these questions and more.
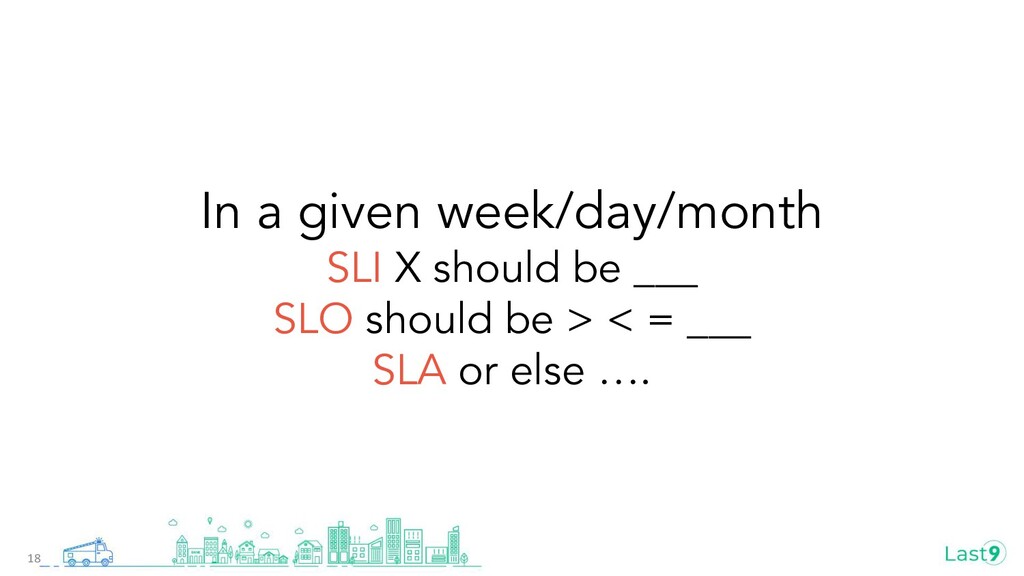
Piyush Verma

July 09, 2020
Tweet

More Decks by Piyush Verma

Other Decks in Programming

Transcript

  1. SLOs that Lie

    View Slide

  2. Piyush Verma
    CTO, last9.io
    @realmeson10
    2

    View Slide

  3. What’s in it for you?
     How the world views SLOs?
     How deep do they go?
     How do we measure them?
    - What do we leave out?
    - How that which we don’t notice botches the numbers?
     What should you do about it?
    3

    View Slide

  4. SLO
    Service Level Objectives
    4

    View Slide

  5. SLI
    Service Level Objectives
    5

    View Slide

  6. Service Levels
    6

    View Slide

  7. Availability
    7

    View Slide

  8. Speed
    8

    View Slide

  9. Correctness
    9

    View Slide

  10. Freshness
    10

    View Slide

  11. How to Measure a level
    11

    View Slide

  12. Availability
    hours
    12

    View Slide

  13. Speed
    mbps? ms?
    13

    View Slide

  14. Correctness
    ?
    14

    View Slide

  15. Freshness
    ?
    15

    View Slide

  16. SLI
    Service Level Objectives
    16

    View Slide

  17. SLO
    Service Level Objectives
    17

    View Slide

  18. In a given week/day/month
    SLI X should be ___
    SLO should be > < = ___
    SLA or else ….
    18

    View Slide

  19. Uptime
    19

    View Slide

  20. Is this 3 9s?
    20

    View Slide

  21. 21
    9s Per Day Per Week Per Month Per Year
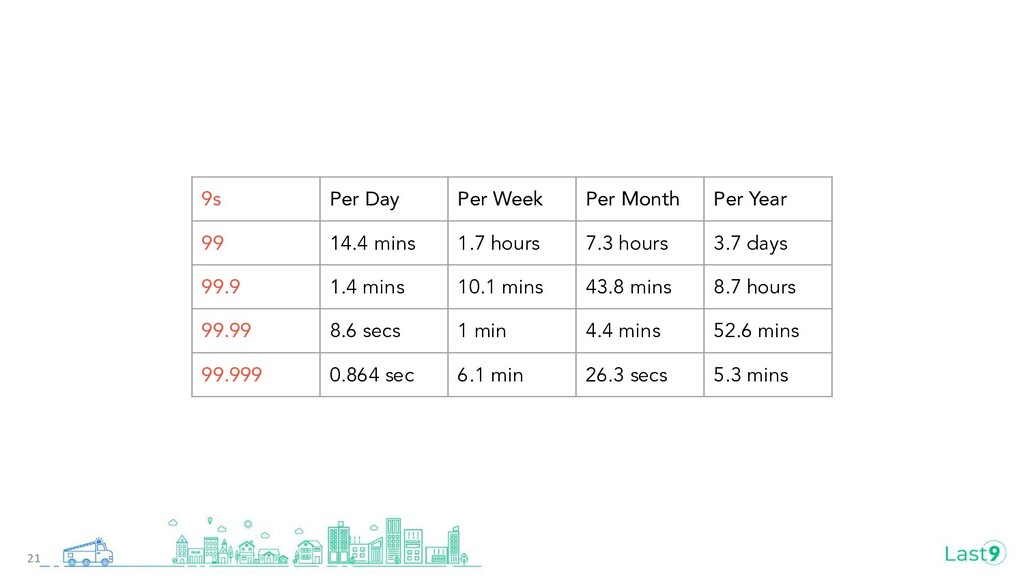
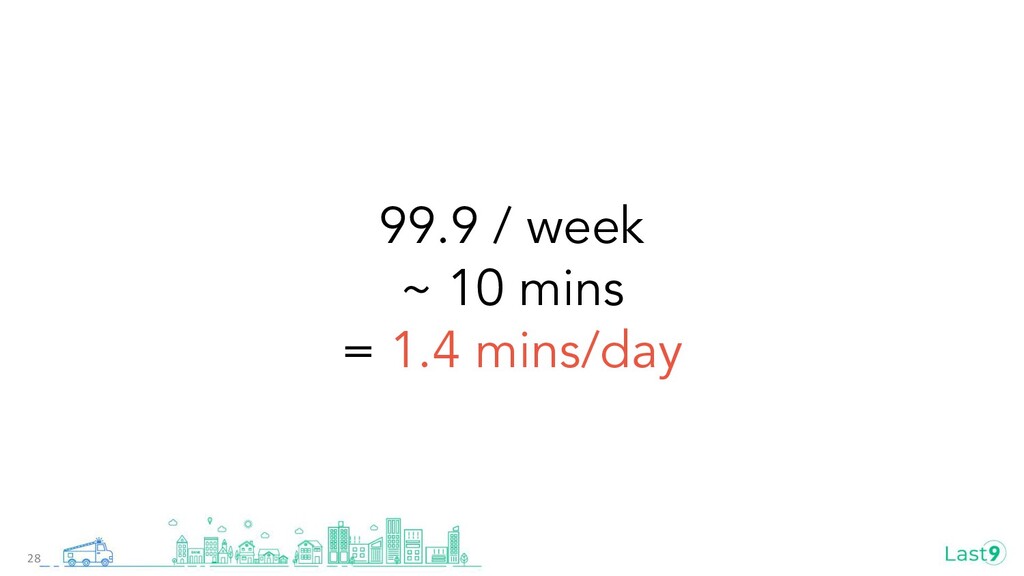
    99 14.4 mins 1.7 hours 7.3 hours 3.7 days
    99.9 1.4 mins 10.1 mins 43.8 mins 8.7 hours
    99.99 8.6 secs 1 min 4.4 mins 52.6 mins
    99.999 0.864 sec 6.1 min 26.3 secs 5.3 mins

    View Slide

  22. Window
    22

    View Slide

  23. To measure uptime
    Total - Down
    23

    View Slide

  24. Downtime
    24

    View Slide

  25. How long was I asleep?
    Try answering without external observation
    25

    View Slide

  26. Device SDK
    26

    View Slide

  27. Metrics
    emission
    27

    View Slide

  28. 99.9 / week
    ~ 10 mins
    = 1.4 mins/day
    28

    View Slide

  29. 29

    View Slide

  30. 30
    There are 10K devices.
    avg 500 ms to reach
    1.4 minutes to report AND fix

    View Slide

  31. 1% devices SDKs experience an
    ISP fault
    99.9% is 99% true
    31

    View Slide

  32. 60% of the time, it
    works every time
    [Anchorman]
    32

    View Slide

  33. Layered SLOs
    33

    View Slide

  34. Client ⇆
    Firewall ⇆
    Load Balancer ⇆
    Proxy

    Handler
    34

    View Slide

  35. SLOs is an aggregation of
    all the underlying layers
    35

    View Slide

  36. It’s possible that,
    the business calls this SLO Uptime,
    but you may need ErrorRatio!!
    36

    View Slide

  37. 1. Uptime Downtime
    monitors
    37

    View Slide

  38. Uptime =
    timeUp ÷
    (timeUp + timeDown)%
    38

    View Slide

  39. 39
    Downtime is how monitor sees
    NOT how the customer sees

    View Slide

  40. How would a downtime monitor
    maintain it’s 100% uptime?
    40

    View Slide

  41. Challenges
    41

    View Slide

  42. Uptime monitor offers 99.99% /
    month
    Actual downtime could be
    Your 4 mins AND Their 4 minutes
    42

    View Slide

  43. 2. Geo-Balanced Monitors
    Should a failure on 1 Geo- be called a
    downtime?
    43

    View Slide

  44. 3. State based
    monitors
    44

    View Slide

  45. Uptime is not requested
    every ms
    45

    View Slide

  46. Ok
    Unknown
    Down
    46

    View Slide

  47. Pop Quiz
    Measure the uptime
    47

    View Slide

  48. ┌────────┬──────────┬──────────┬──────────┬──────────┐
    │ Status │ OK │ OK │ Unknown │ Ok │
    ├────────┼──────────┼──────────┼──────────┼──────────┤
    │ Time │ 10:00:01 │ 10:00:10 │ 10:00:11 │ 10:00:21 │
    └────────┴──────────┴──────────┴──────────┴──────────┘
    48

    View Slide

  49. ┌────────┬──────────┬──────────┬──────────┬──────────┐
    │ Status │ OK │ Unknown │ Down │ Ok │
    ├────────┼──────────┼──────────┼──────────┼──────────┤
    │ Time │ 10:00:01 │ 10:00:10 │ 10:00:20 │ 10:00:21 │
    └────────┴──────────┴──────────┴──────────┴──────────┘
    49

    View Slide

  50. Monitor’s sleep period may
    overlap with actual downtime
    50

    View Slide

  51. Conclusion
    51

    View Slide

  52. There is no one true SLO
    Uptime of one layer could be error of
    another.
    52

    View Slide

  53. Uptime is mostly and
    massively aggregated
    53

    View Slide

  54. As the 9s increase,
    SLOs become a confirmation of proactivity
    than a measure of reactivity
    54

    View Slide

  55. Thank you
    last9.io/failures
    Piyush Verma

    View Slide