Upgrade to Pro — share decks privately, control downloads, hide ads and more …

Advanced Agile Planning - NDC 2014

Mike Cohn
June 06, 2014

Advanced Agile Planning - NDC 2014

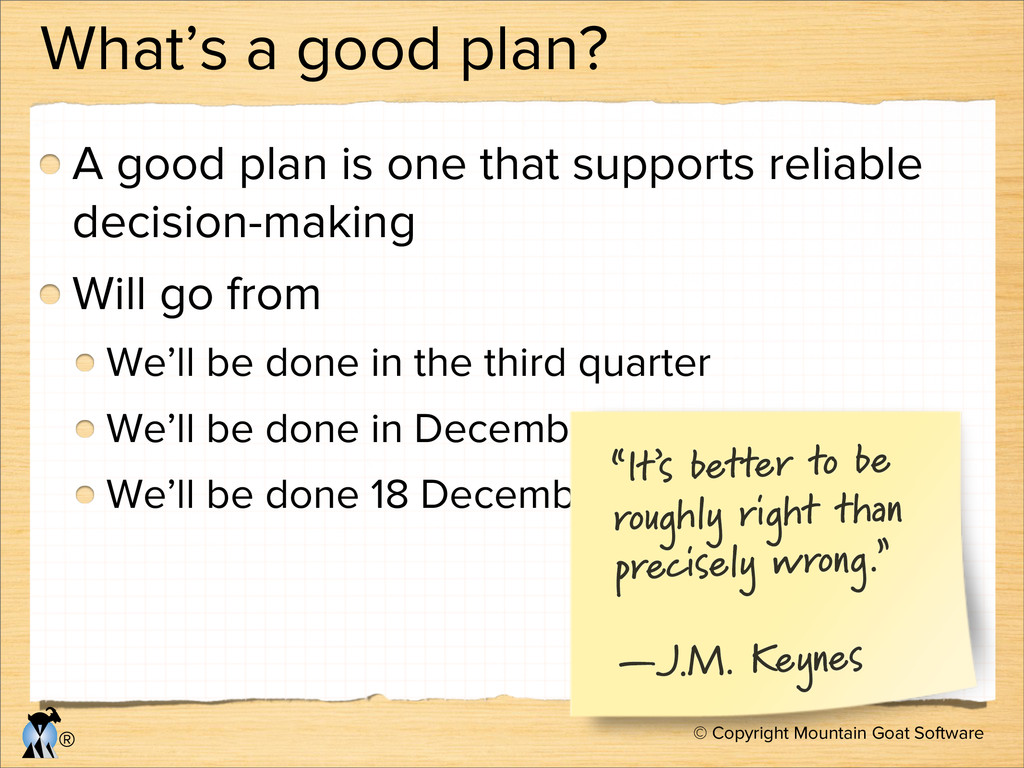
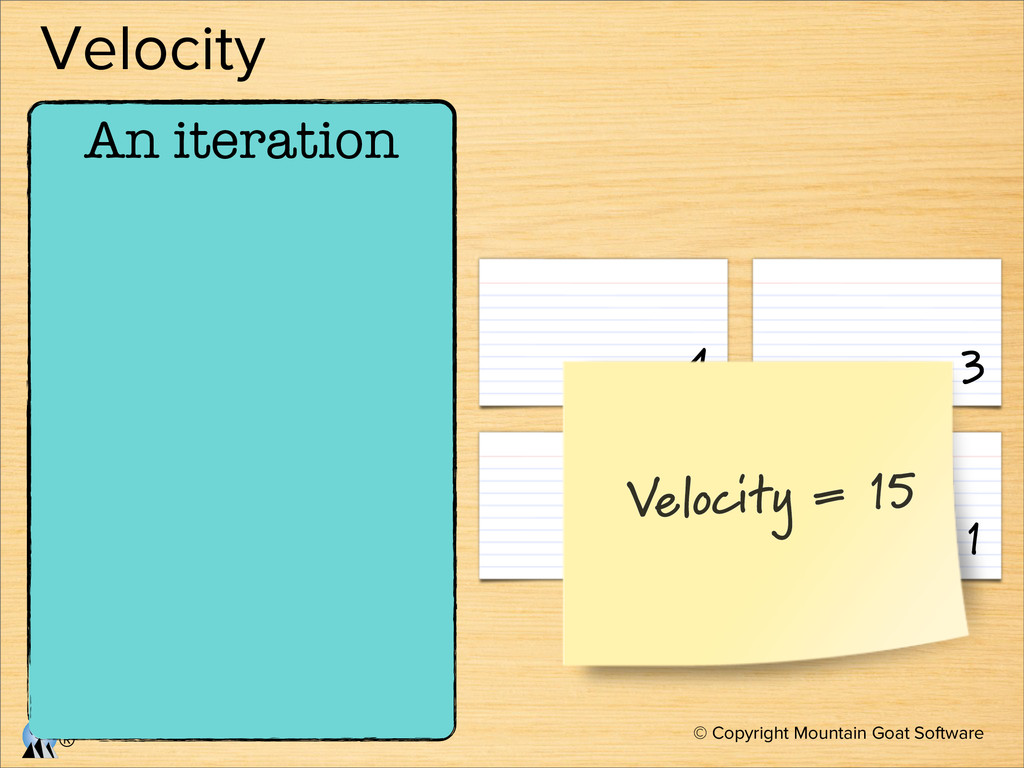
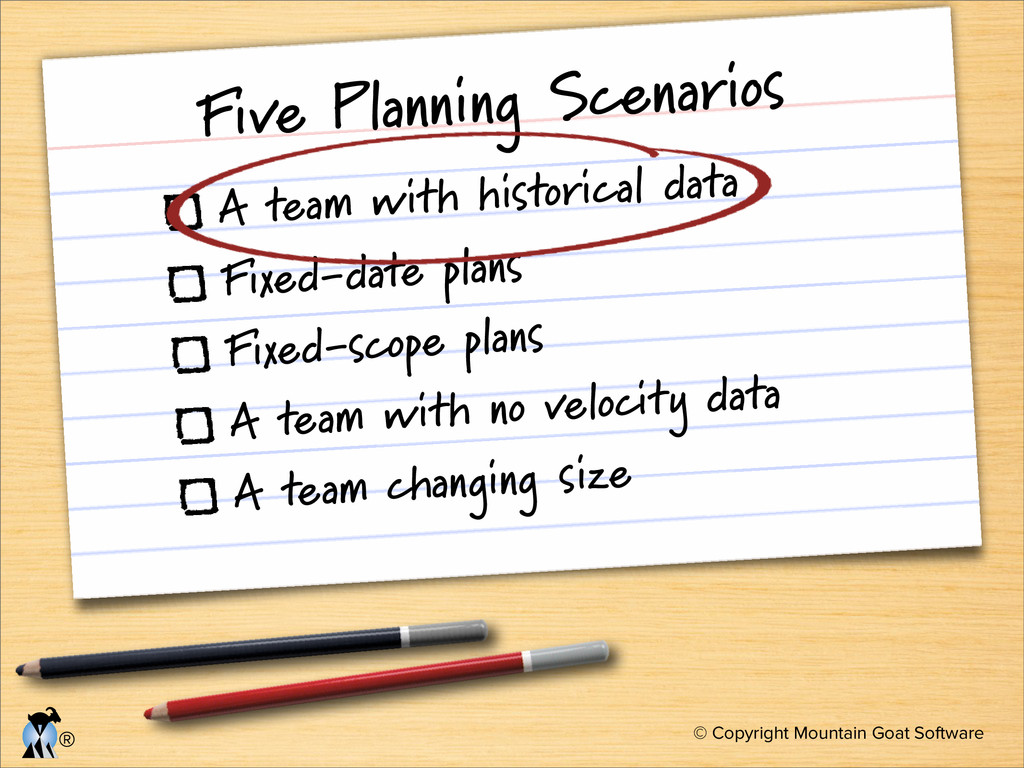
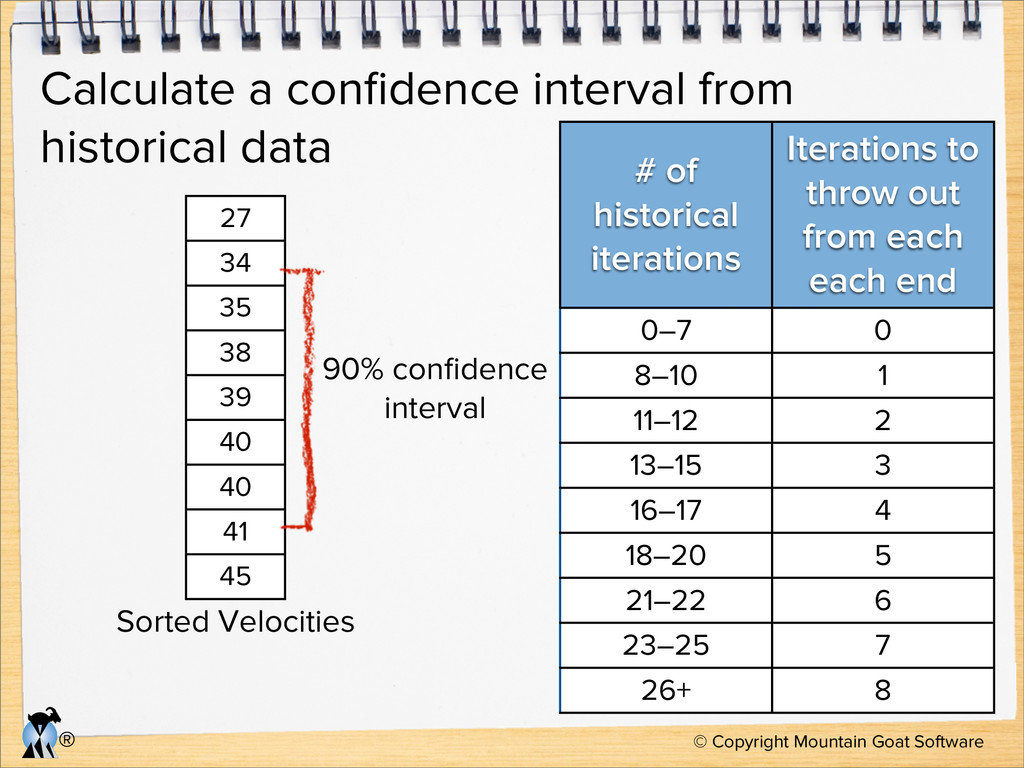
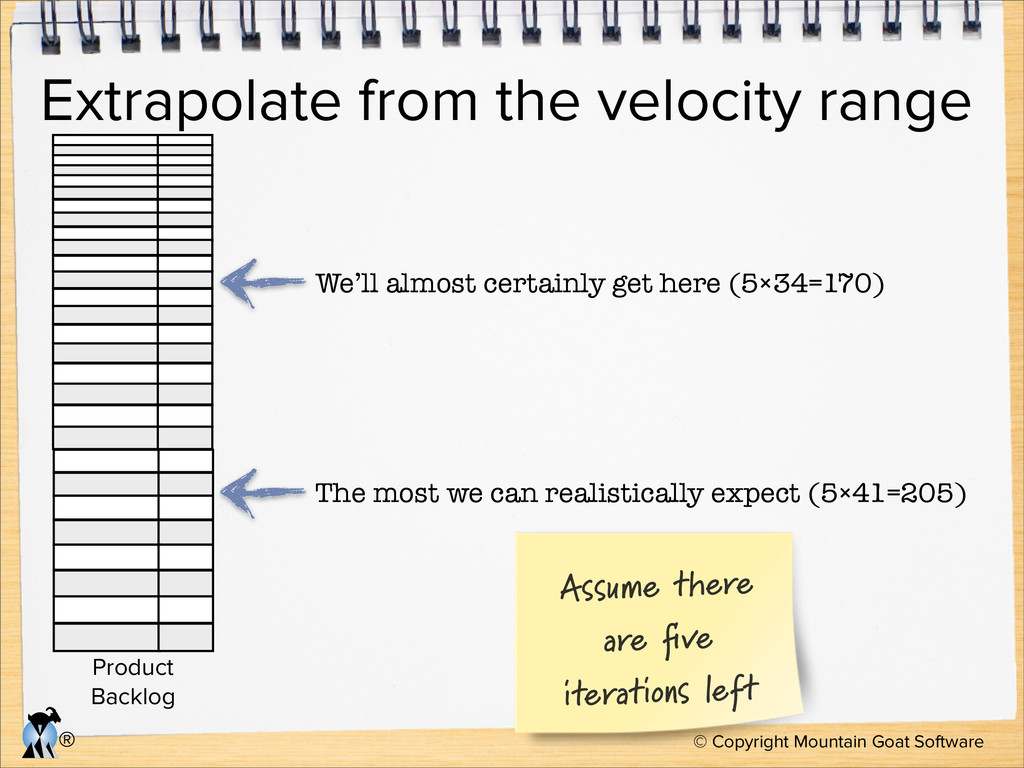
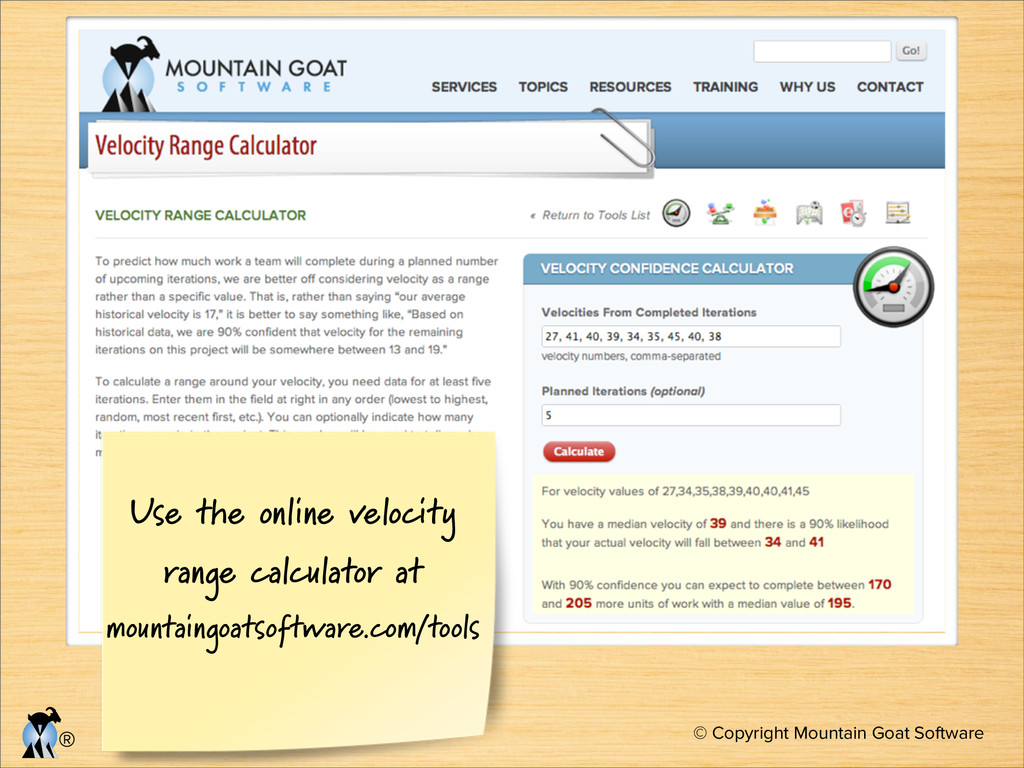
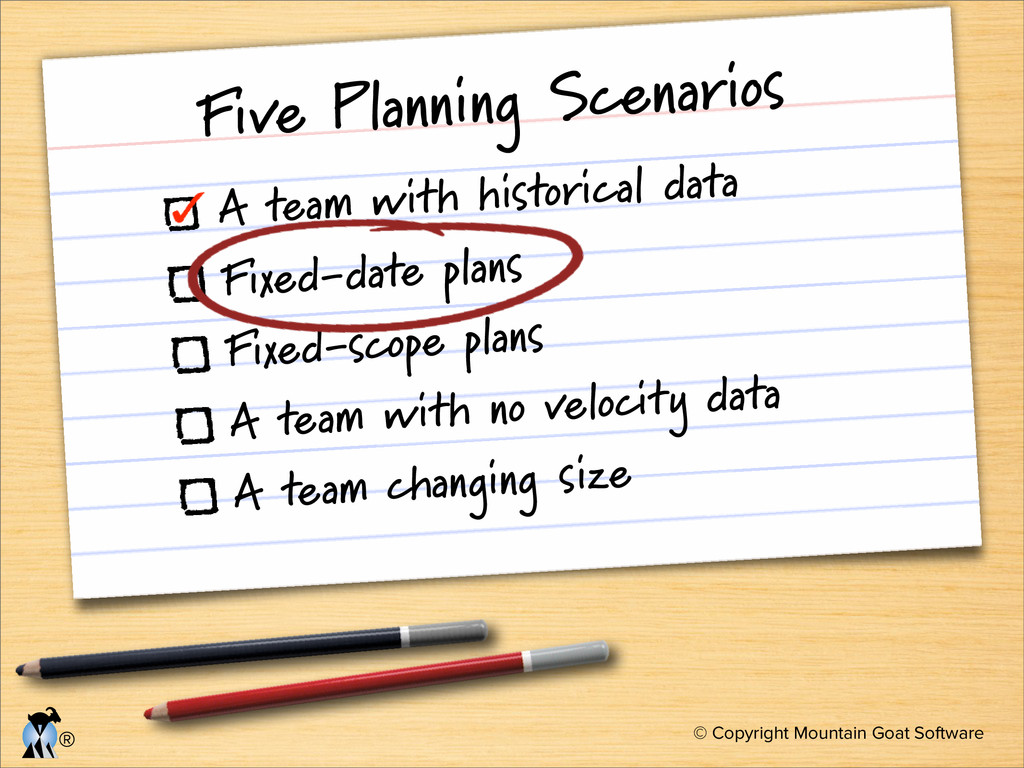
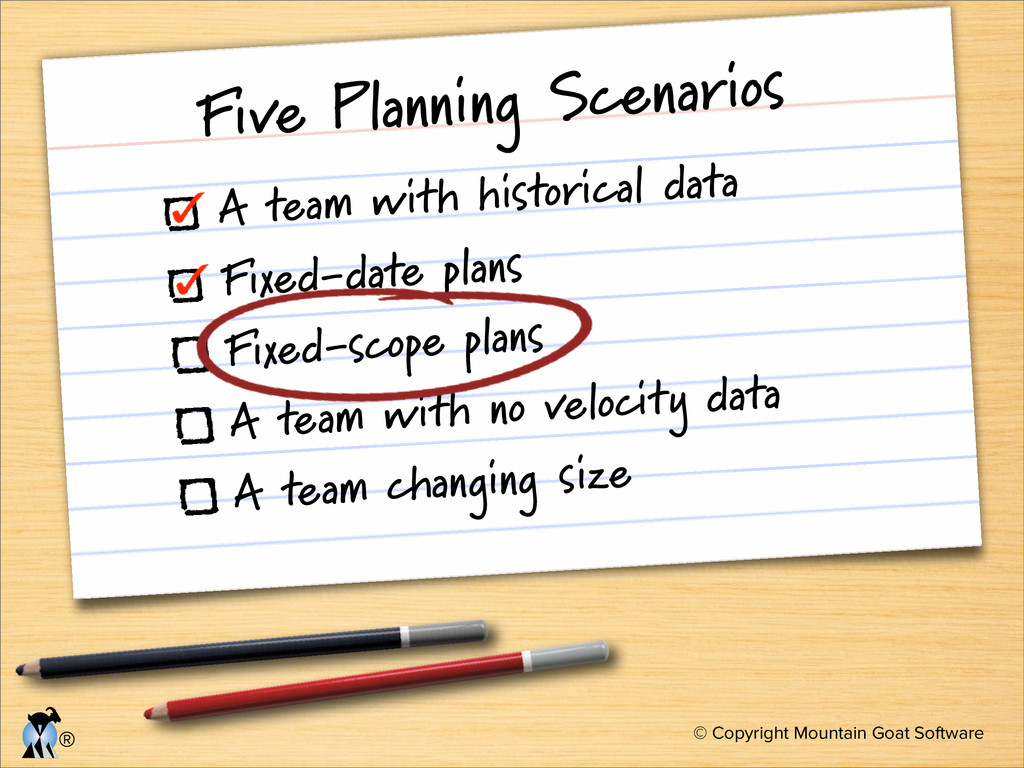
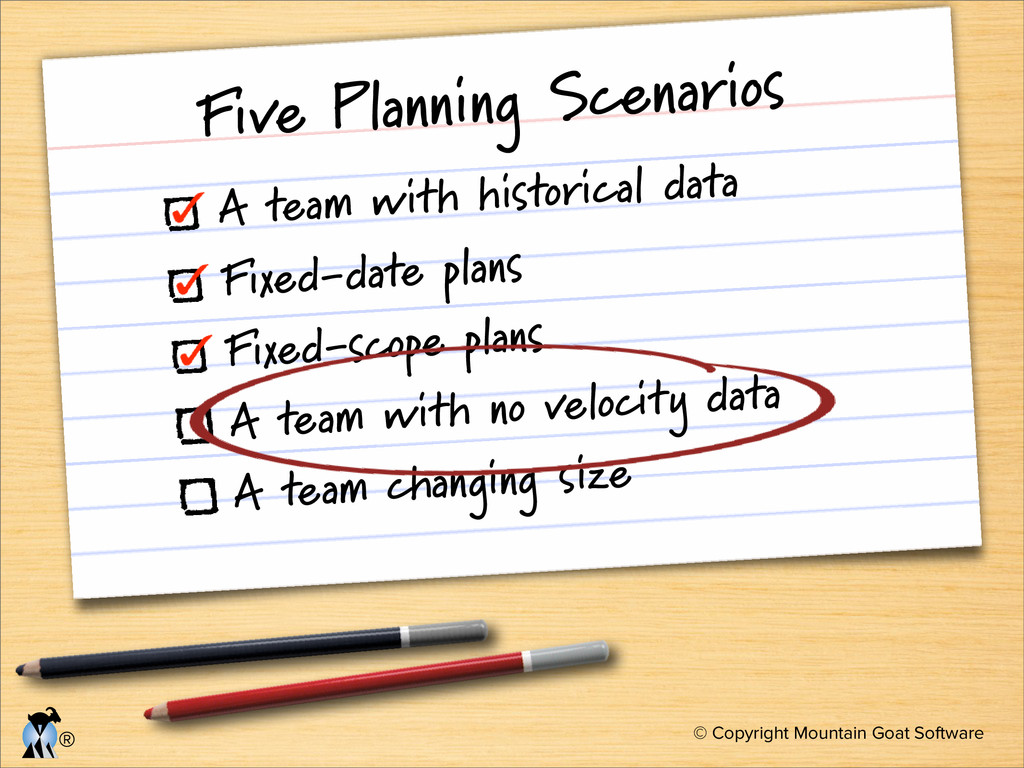
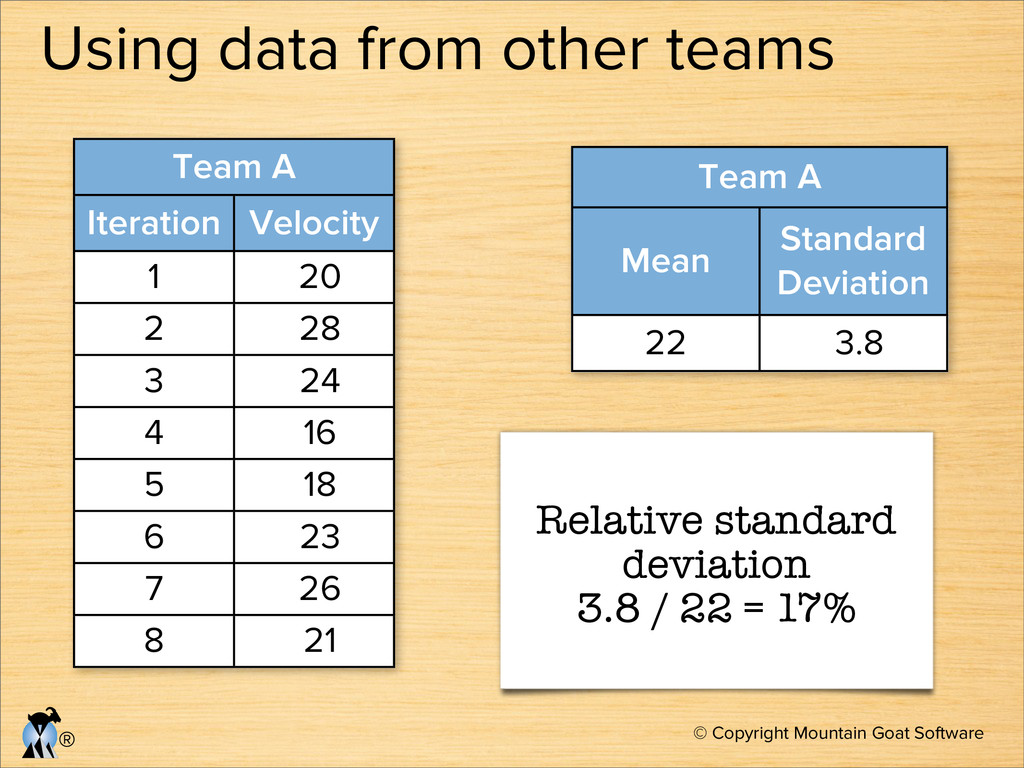
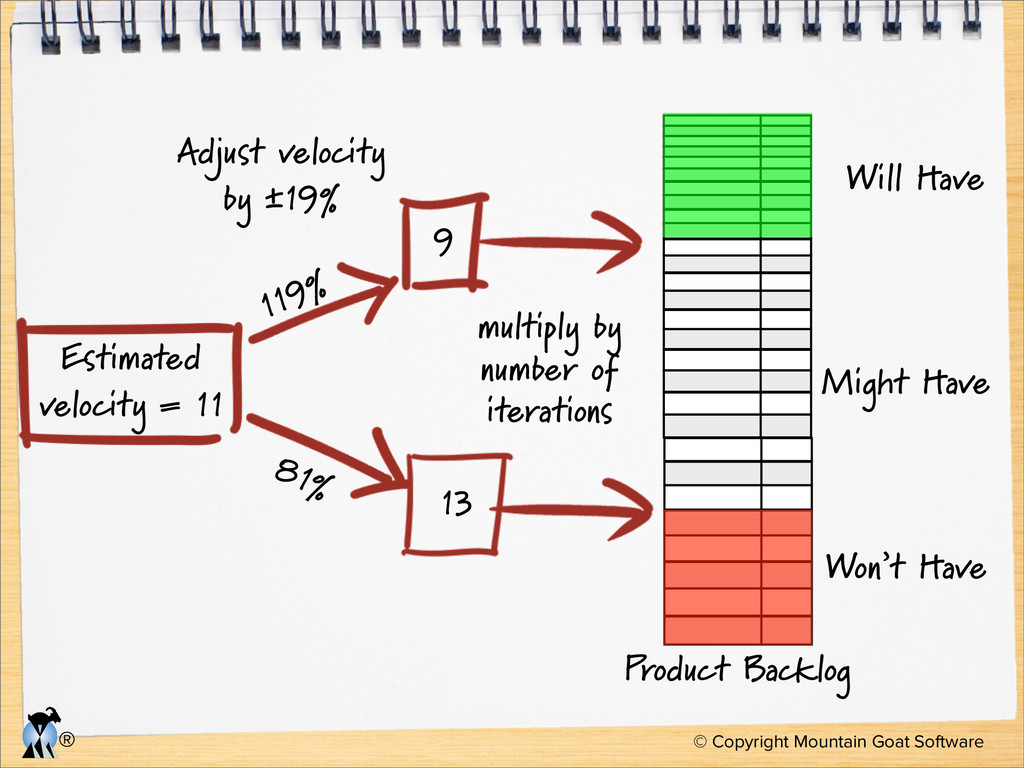
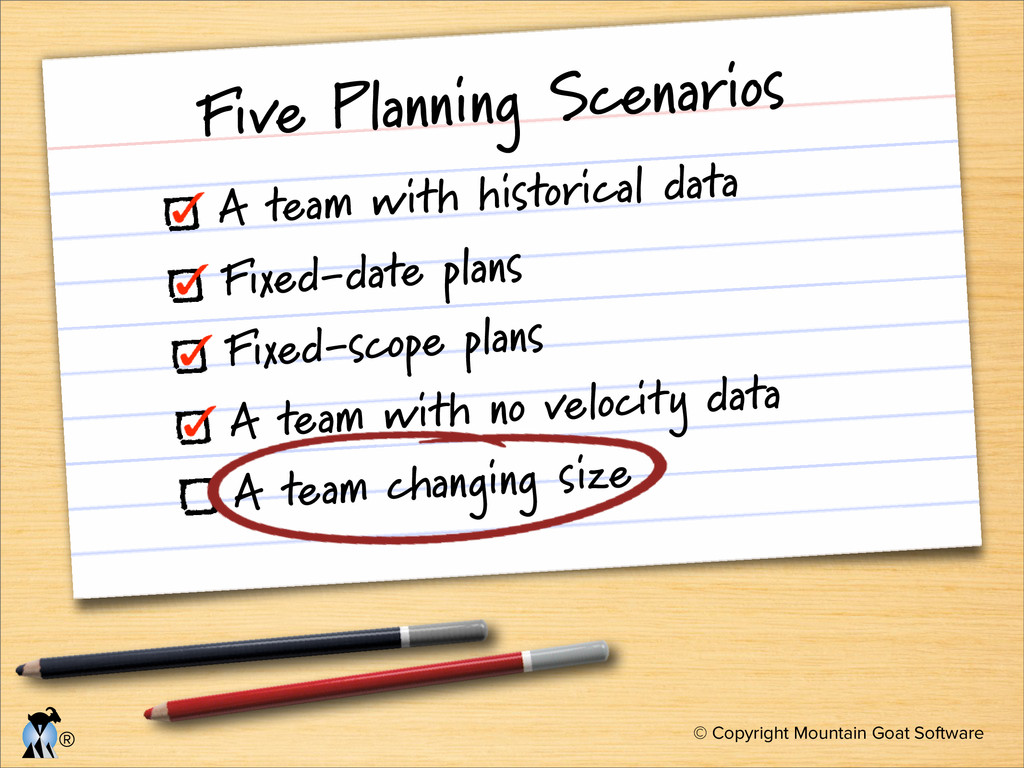
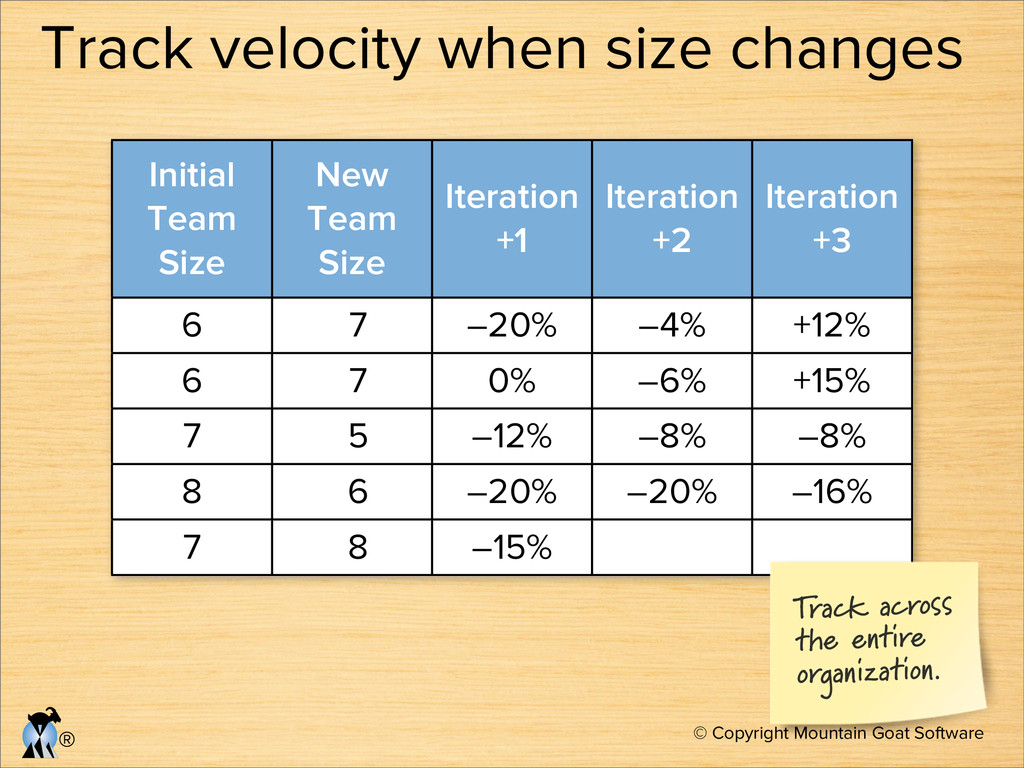
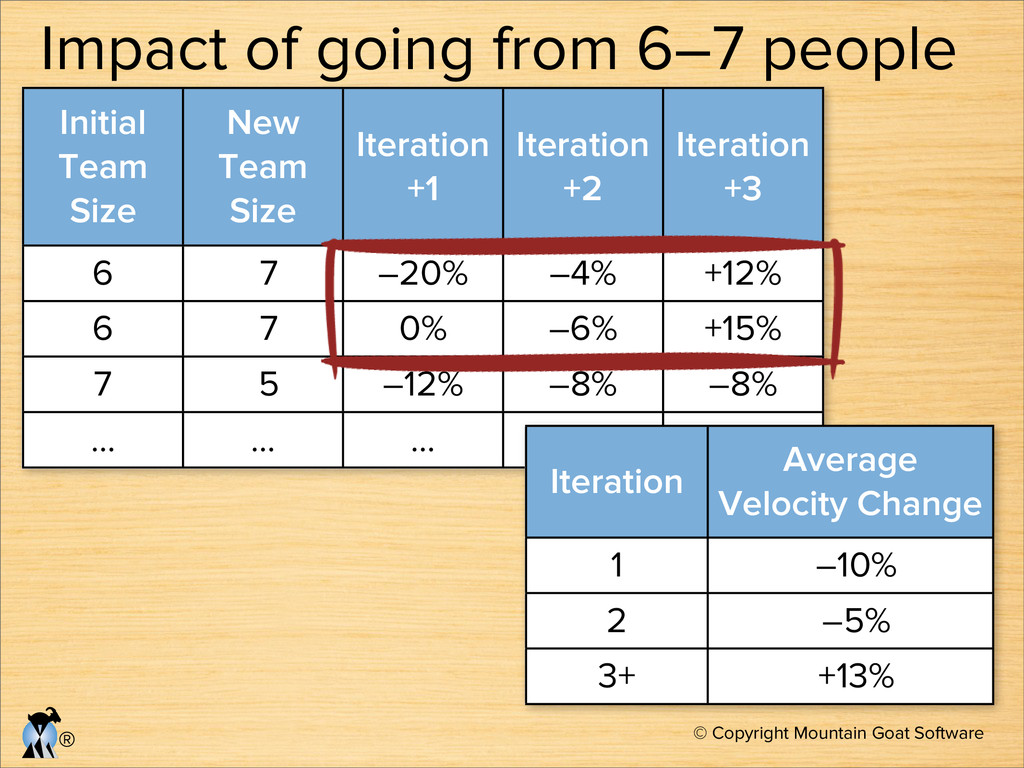
Velocity is perhaps the most useful metric available to agile teams. In this session we will look at advanced uses of velocity for planning under special but common circumstances. We will see how to forecast velocity in the complete absence of any historical data. We will look at how a new team can forecast velocity by looking at other teams. We will see how to predict the velocity of a team that will grow or shrink in size. Most importantly we will look at the use of confidence intervals to create plans we can be 90% confident in, even on fixed-price or fixed-date contracts.

Mike Cohn

June 06, 2014
Tweet

More Decks by Mike Cohn

Other Decks in Business

Transcript

  1. Mike Cohn
    Norwegian Developer’s Conference
    6 June 2014
    Advanced
    Agile Planning

    View Slide

  2. © Copyright Mountain Goat Software
    ®
    The planning onion
    Daily
    Iteration
    Release
    Product
    Portfolio
    Strategy
    Team focuses here
    Team focuses here
    Team focuses here

    View Slide

  3. © Copyright Mountain Goat Software
    ®
    Release and iteration planning
    Release Plan
    Iteration 2
    Iteration 1 Iteration 3 Iterations 4–7
    Code the … 8
    Test the … 12
    Design a … 8
    Code the … 6
    Iteration Plan
    Code the … 6
    Decide … 4
    Test the … 6
    Automate … 8
    Iteration Plan

    View Slide

  4. © Copyright Mountain Goat Software
    ®
    What’s a good plan?
    A good plan is one that supports reliable
    decision-making
    Will go from
    We’ll be done in the third quarter
    We’ll be done in December
    We’ll be done 18 December
    “It’s better to be
    roughly right than
    precisely wrong.”
    —J.M. Keynes

    View Slide

  5. © Copyright Mountain Goat Software
    ®
    Velocity
    An iteration
    4
    10 1
    3
    Velocity = 15

    View Slide

  6. © Copyright Mountain Goat Software
    ®
    Velocity
    A useful long-term measure of the amount of
    work completed per iteration
    Most useful over at least a handful of iterations
    0
    10
    20
    30
    40
    1 2 3 4 5 6 7 8 9
    Velocity is measured
    in the units you use
    to estimate product
    backlog items
    Velocity

    View Slide

  7. © Copyright Mountain Goat Software
    ®
    Five Planning Scenarios
    A team with historical data
    Fixed-date plans
    Fixed-scope plans
    A team with no velocity data
    A team changing size

    View Slide

  8. © Copyright Mountain Goat Software
    ®
    Calculate a confidence interval from
    historical data
    27
    34
    35
    38
    39
    40
    40
    41
    45
    90% confidence
    interval
    # of
    historical
    iterations
    Iterations to
    throw out
    from each
    each end
    0–7 0
    8–10 1
    11–12 2
    13–15 3
    16–17 4
    18–20 5
    21–22 6
    23–25 7
    26+ 8
    Sorted Velocities

    View Slide

  9. © Copyright Mountain Goat Software
    ®
    Extrapolate from the velocity range
    Product
    Backlog
    Assume there
    are five
    iterations left
    We’ll almost certainly get here (5ₒ34=170)
    The most we can realistically expect (5ₒ41=205)

    View Slide

  10. © Copyright Mountain Goat Software
    ®
    Use the online velocity
    range calculator at
    mountaingoatsoftware.com/tools

    View Slide

  11. © Copyright Mountain Goat Software
    ®
    Five Planning Scenarios
    A team with historical data
    Fixed-date plans
    Fixed-scope plans
    A team with no velocity data
    A team changing size

    View Slide

  12. © Copyright Mountain Goat Software
    ®
    Fixed-date planning
    Three steps
    1. Determine how many iterations
    you have.
    2. Estimate velocity as a range.
    3. Use that range × the number of
    iterations to partition the backlog
    into Will Have, Might Have, and
    Won’t Have.

    View Slide

  13. © Copyright Mountain Goat Software
    ®
    Count the iterations
    APRIL
    1
    8
    15
    22
    29
    2
    9
    16
    23
    30
    3
    10
    17
    24
    4
    11
    18
    25
    5
    12
    19
    26
    6
    13
    20
    27
    7
    14
    21
    28
    SUN MON TUE WED THU FRI SAT
    MAY
    6
    13
    20
    27
    7
    14
    21
    28
    1
    8
    15
    22
    29
    2
    9
    16
    23
    30
    3
    10
    17
    24
    31
    4
    11
    18
    25
    5
    12
    19
    26
    SUN MON TUE WED THU FRI SAT
    JUNE
    6
    13
    20
    27
    7
    14
    21
    28
    1
    8
    15
    22
    29
    2
    9
    16
    23
    30
    3
    10
    17
    24
    31
    4
    11
    18
    25
    5
    12
    19
    26
    3
    10
    17
    24
    4
    11
    18
    25
    5
    12
    19
    26
    6
    13
    20
    27
    7
    14
    21
    28
    1
    8
    15
    22
    29
    2
    9
    16
    23
    30
    SUN MON TUE WED THU FRI SAT

    View Slide

  14. © Copyright Mountain Goat Software
    ®
    Determine a velocity range
    0
    10
    20
    30
    40
    50
    Story Points
    Iterations
    30
    21
    25
    34
    25
    30 29 29

    View Slide

  15. © Copyright Mountain Goat Software
    ®
    Product
    Backlog
    Might have
    Won’t have
    Will have
    6ₒ25
    Determine what to commit to
    If you promise this
    •You probably won’t get
    the contract
    •But will probably finish
    everything if you do
    If you promise this
    •You will probably win
    the contract
    •But probably not finish
    everything in time

    View Slide

  16. © Copyright Mountain Goat Software
    ®
    Balancing risk
    Low
    Expectation Risk
    Delivery Risk
    Low High
    High
    Promise Just
    the
    Will-Haves
    Promise All
    the
    Might-Haves

    View Slide

  17. © Copyright Mountain Goat Software
    ®
    Five Planning Scenarios
    A team with historical data
    Fixed-date plans
    Fixed-scope plans
    A team with no velocity data
    A team changing size

    View Slide

  18. © Copyright Mountain Goat Software
    ®
    Fixed scope planning
    Three steps
    1. Sum the product backlog
    items.
    2. Estimate velocity as a range.
    3. Use the sum of the backlog
    divided by the velocity
    range to determine a date
    range.

    View Slide

  19. © Copyright Mountain Goat Software
    ®
    = 120 story points
    }=15–20
    0
    5
    10
    15
    20
    25
    Story Points
    Iterations

    View Slide

  20. © Copyright Mountain Goat Software
    ®
    120 ÷ 15 = JUNE
    6
    13
    20
    27
    7
    14
    21
    28
    1
    8
    15
    22
    29
    2
    9
    16
    23
    30
    3
    10
    17
    24
    31
    4
    11
    18
    25
    5
    12
    19
    26
    3
    10
    17
    24
    4
    11
    18
    25
    5
    12
    19
    26
    6
    13
    20
    27
    7
    14
    21
    28
    1
    8
    15
    22
    29
    2
    9
    16
    23
    30
    SUN MON TUE WED THU FRI SAT
    JANUARY
    7
    14
    21
    28
    1
    8
    15
    22
    29
    2
    9
    16
    23
    30
    3
    10
    17
    24
    31
    4
    11
    18
    25
    5
    12
    19
    26
    6
    13
    20
    27
    SUN MON TUE WED THU FRI SAT
    FEBRUARY
    4
    11
    18
    25
    5
    12
    19
    26
    6
    13
    20
    27
    7
    14
    21
    28
    1
    8
    15
    22
    2
    9
    16
    23
    3
    10
    17
    24
    SUN MON TUE WED THU FRI SAT
    MARCH
    4
    11
    18
    25
    5
    12
    19
    26
    6
    13
    20
    27
    7
    14
    21
    28
    1
    8
    15
    22
    29
    2
    9
    16
    23
    30
    3
    10
    17
    24
    31
    SUN MON TUE WED THU FRI SAT
    APRIL
    1
    8
    15
    22
    29
    2
    9
    16
    23
    30
    3
    10
    17
    24
    4
    11
    18
    25
    5
    12
    19
    26
    6
    13
    20
    27
    7
    14
    21
    28
    SUN MON TUE WED THU FRI SAT
    MAY
    6
    13
    20
    27
    7
    14
    21
    28
    1
    8
    15
    22
    29
    2
    9
    16
    23
    30
    3
    10
    17
    24
    31
    4
    11
    18
    25
    5
    12
    19
    26
    SUN MON TUE WED THU FRI SAT
    JULY
    1
    8
    15
    22
    29
    2
    9
    16
    23
    30
    3
    10
    17
    24
    31
    4
    11
    18
    25
    5
    12
    19
    26
    6
    13
    20
    27
    7
    14
    21
    28
    SUN MON TUE WED THU FRI SAT
    AUGUST
    5
    12
    19
    26
    6
    13
    20
    27
    7
    14
    21
    28
    1
    8
    15
    22
    29
    2
    9
    16
    23
    30
    3
    10
    17
    24
    31
    4
    11
    18
    25
    SUN MON TUE WED THU FRI SAT
    120 ÷ 20 = JUNE
    6
    13
    20
    27
    7
    14
    21
    28
    1
    8
    15
    22
    29
    2
    9
    16
    23
    30
    3
    10
    17
    24
    31
    4
    11
    18
    25
    5
    12
    19
    26
    3
    10
    17
    24
    4
    11
    18
    25
    5
    12
    19
    26
    6
    13
    20
    27
    7
    14
    21
    28
    1
    8
    15
    22
    29
    2
    9
    16
    23
    30
    SUN MON TUE WED THU FRI SAT
    JANUARY
    7
    14
    21
    28
    1
    8
    15
    22
    29
    2
    9
    16
    23
    30
    3
    10
    17
    24
    31
    4
    11
    18
    25
    5
    12
    19
    26
    6
    13
    20
    27
    SUN MON TUE WED THU FRI SAT
    FEBRUARY
    4
    11
    18
    25
    5
    12
    19
    26
    6
    13
    20
    27
    7
    14
    21
    28
    1
    8
    15
    22
    2
    9
    16
    23
    3
    10
    17
    24
    SUN MON TUE WED THU FRI SAT
    MARCH
    4
    11
    18
    25
    5
    12
    19
    26
    6
    13
    20
    27
    7
    14
    21
    28
    1
    8
    15
    22
    29
    2
    9
    16
    23
    30
    3
    10
    17
    24
    31
    SUN MON TUE WED THU FRI SAT
    APRIL
    1
    8
    15
    22
    29
    2
    9
    16
    23
    30
    3
    10
    17
    24
    4
    11
    18
    25
    5
    12
    19
    26
    6
    13
    20
    27
    7
    14
    21
    28
    SUN MON TUE WED THU FRI SAT
    MAY
    6
    13
    20
    27
    7
    14
    21
    28
    1
    8
    15
    22
    29
    2
    9
    16
    23
    30
    3
    10
    17
    24
    31
    4
    11
    18
    25
    5
    12
    19
    26
    SUN MON TUE WED THU FRI SAT
    If you promise the long
    duration
    •You probably will not
    get the contract
    •But it should be easy to
    finish everything
    If you promise the short
    duration
    •You probably get the
    contract
    •But may not finish
    everything in time

    View Slide

  21. © Copyright Mountain Goat Software
    ®
    Ranges
    Notice in both cases we had a range
    For a fixed date project, use a scope
    range:
    “By that date you’ll have all of these features
    and some of these.”
    For a fixed-scope project, use a date
    range:
    “It will take us between 6 and 8 iterations to
    deliver all of those features.”

    View Slide

  22. © Copyright Mountain Goat Software
    ®
    The impending tradeshow
    Your company develops tools for managing agile
    projects.
    You’ve finished version 1.0 (on time, of course).
    Now the boss needs a new version for the big
    trade show that is 4 iterations away.
    • Which features can you “guarantee” will be in
    for the trade show?
    • Which features are likely to be in? Use the following
    user stories,
    estimates and
    velocities.

    View Slide

  23. © Copyright Mountain Goat Software
    ®
    Past velocities
    Historical Data
    Historical Data
    Iteration Velocity
    1 20
    2 14
    3 23
    4 18
    5 25
    6 30
    7 12
    8 22
    9 15
    10 23
    Your estimates

    View Slide

  24. © Copyright Mountain Goat Software
    ®
    Product backlog item Estimate
    1. As the product owner I want to drag items onto a release
    burndown chart and see the impact to the release date.
    20
    2. As a user at a company with lots of cash, I want your product to
    support touch screens so I can put a large one in our team
    room.
    13
    3. As a user I would like performance to be about twice as fast as
    now during peak use periods.
    20
    4. As a team member, I’d like to be able to do online planning
    poker estimating right inside the tool.
    13
    5. As a third party, I would like an SOA interface so that I can
    integrate my product with yours.
    8
    6. As a team member I want RSS support for all changes to tasks
    or user stories so that I’m notified.
    8
    7. As the product owner, I want a new report that shows
    differences in the product backlog between different time
    periods.
    3
    8. As a team member I’d like to define templates of tasks that
    recur for lots of different stories so that I can reuse them
    13

    View Slide

  25. © Copyright Mountain Goat Software
    ®
    Five Planning Scenarios
    A team with historical data
    Fixed-date plans
    Fixed-scope plans
    A team with no velocity data
    A team changing size

    View Slide

  26. © Copyright Mountain Goat Software
    ®
    Forecast an initial velocity
    Get the team together as though there were going
    to plan a real iteration (2–4 weeks)
    Iteration planning involves
    Breaking product backlog items (features) into
    tasks
    Estimating the hours for each task
    Repeating until the iteration feels full
    See how many points are represented by the work
    they select
    Consider planning a second iteration this way

    View Slide

  27. © Copyright Mountain Goat Software
    ®
    Consider this team
    Person Hours/Day Hours / Iteration
    Trond 4–6 40–60
    Tore 4–6 40–60
    Christine 2–3 20–30
    Total
    Total 100–150

    View Slide

  28. © Copyright Mountain Goat Software
    ®
    Establishing their velocity
    100–150 hours per iteration
    Capacity
    Code… 12
    Design … 6
    Test … 8
    Decide … 8
    Automate … 12
    … 22
    46
    22
    Story Points
    As a frequent
    flyer …
    3
    As a visitor … 5
    As a vacation
    planner …
    5
    As a frequent
    flyer …
    2
    Code… 8
    Test … 6
    Design … 12
    Test … 5
    … 48
    31
    48

    View Slide

  29. © Copyright Mountain Goat Software
    ®
    Turn the point estimate into a range
    If you don’t have historical data
    Take a wild guess, perhaps:
    +/– 10% for a known team working in a known
    domain with known technologies
    +/– 50% if all that is unknown
    If you have historical data from other
    teams
    Calculate the relative standard deviation of
    those teams

    View Slide

  30. © Copyright Mountain Goat Software
    ®
    Using data from other teams
    Team A
    Team A
    Iteration Velocity
    1 20
    2 28
    3 24
    4 16
    5 18
    6 23
    7 26
    8 21
    Team A
    Team A
    Mean
    Standard
    Deviation
    22 3.8
    Relative standard
    deviation
    3.8 / 22 = 17%

    View Slide

  31. © Copyright Mountain Goat Software
    ®
    Product Backlog
    Will Have
    Might Have
    Won’t Have
    Estimated
    velocity = 11
    13
    9
    119%
    81%
    Adjust velocity
    by ±19%
    multiply by
    number of
    iterations

    View Slide

  32. © Copyright Mountain Goat Software
    ®
    Five Planning Scenarios
    A team with historical data
    Fixed-date plans
    Fixed-scope plans
    A team with no velocity data
    A team changing size

    View Slide

  33. © Copyright Mountain Goat Software
    ®
    Initial
    Team
    Size
    New
    Team
    Size
    Iteration
    +1
    Iteration
    +2
    Iteration
    +3
    6 7 –20% –4% +12%
    6 7 0% –6% +15%
    7 5 –12% –8% –8%
    8 6 –20% –20% –16%
    7 8 –15%
    Track across
    the entire
    organization.
    Track velocity when size changes

    View Slide

  34. © Copyright Mountain Goat Software
    ®
    Initial
    Team
    Size
    New
    Team
    Size
    Iteration
    +1
    Iteration
    +2
    Iteration
    +3
    6 7 –20% –4% +12%
    6 7 0% –6% +15%
    7 5 –12% –8% –8%
    … … … … …
    Impact of going from 6–7 people
    Iteration
    Average
    Velocity Change
    1 –10%
    2 –5%
    3+ +13%

    View Slide

  35. © Copyright Mountain Goat Software
    ®
    FrontRowAgile.com
    Online
    video
    training

    View Slide

  36. © Copyright Mountain Goat Software
    ®
    [email protected]
    www.mountaingoatsoftware.com
    twitter: mikewcohn
    (888) 61-AGILE
    Mike Cohn

    View Slide