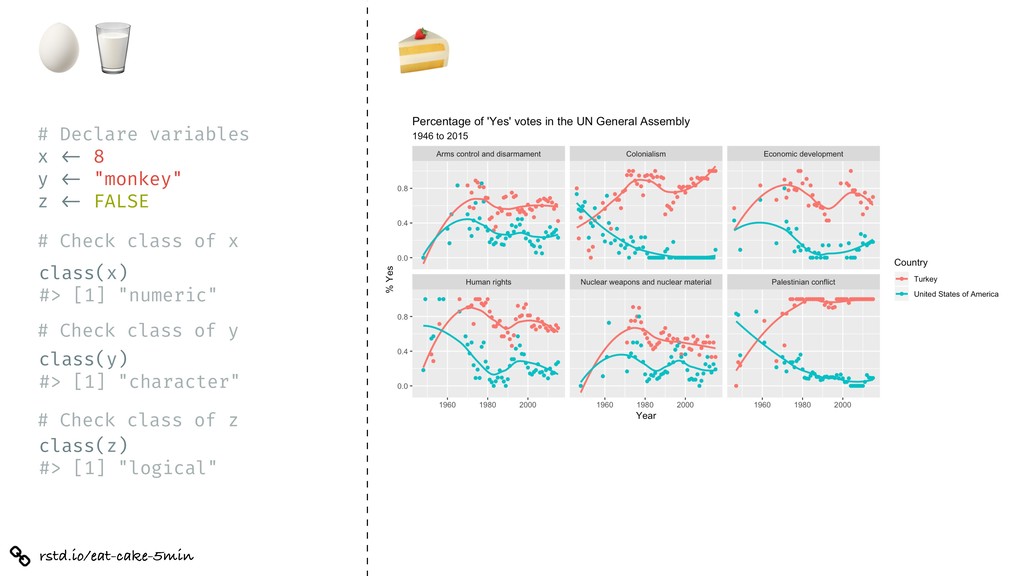
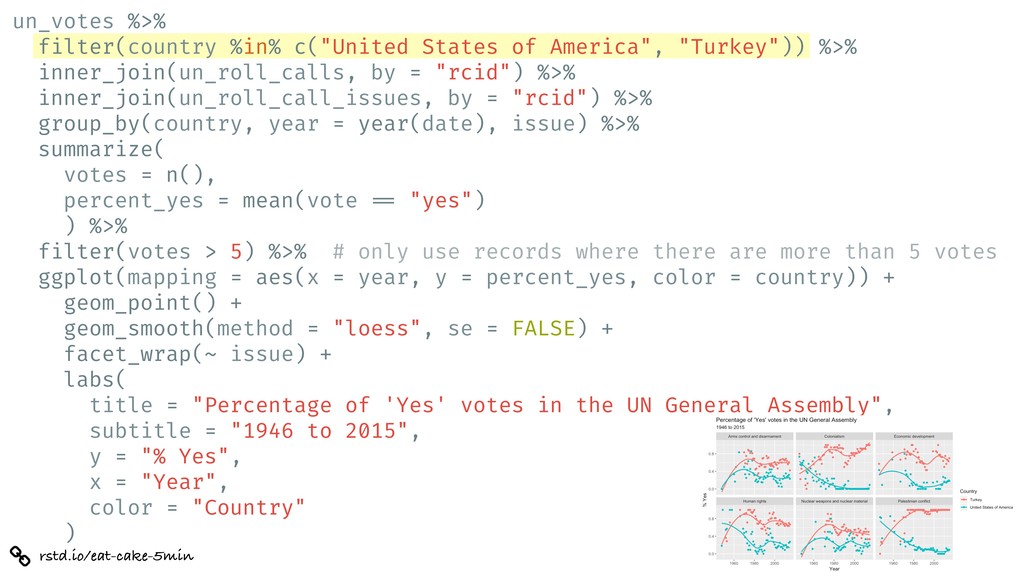
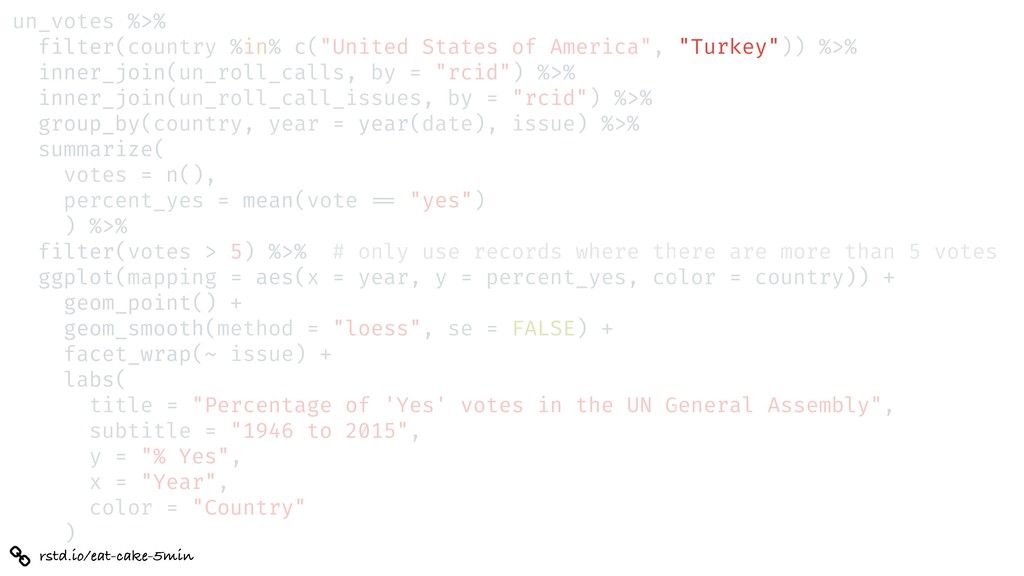
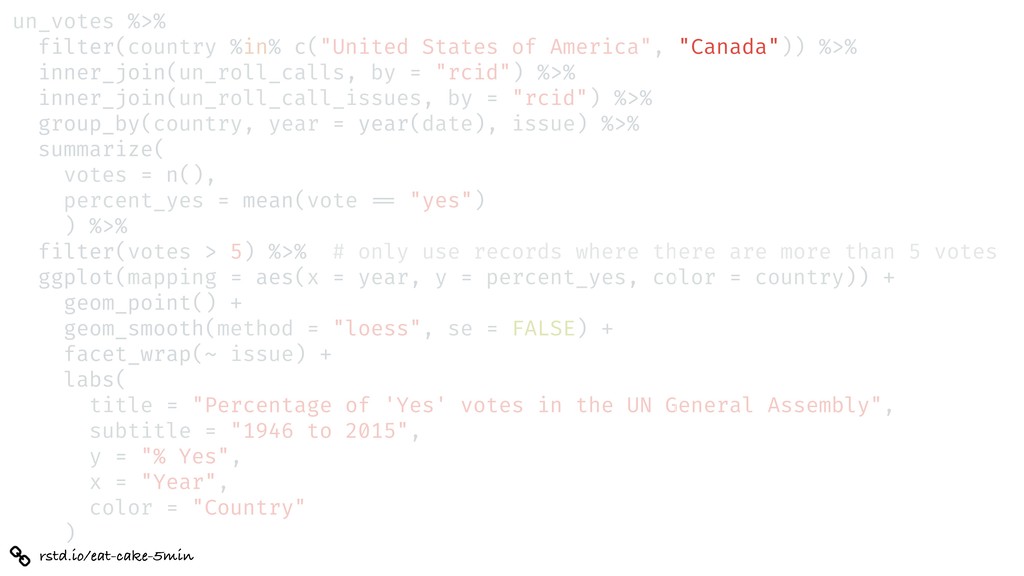
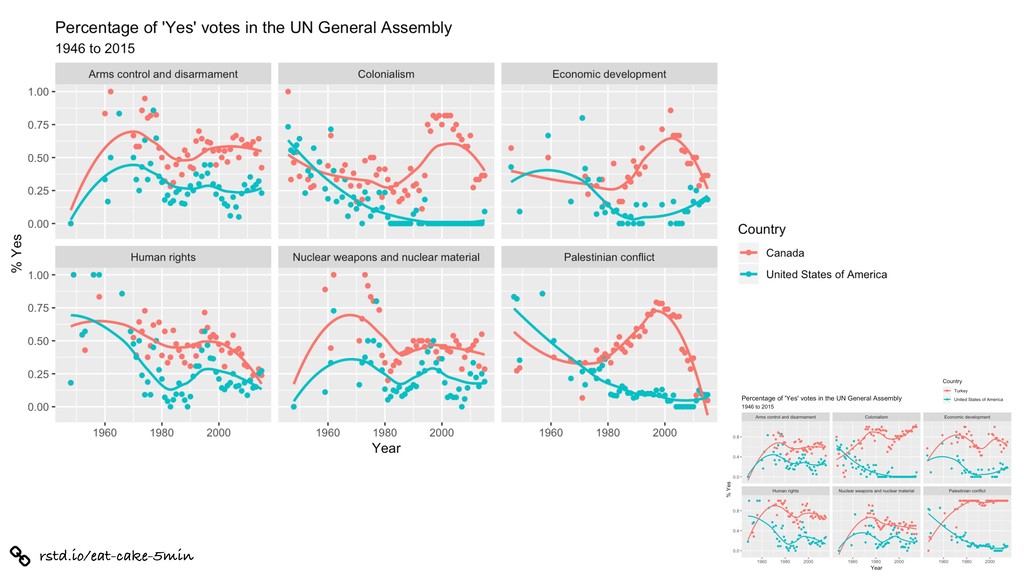
%>% inner_join(un_roll_calls, by = "rcid") %>% inner_join(un_roll_call_issues, by = "rcid") %>% group_by(country, year = year(date), issue) %>% summarize( votes = n(), percent_yes = mean(vote !== "yes") ) %>% filter(votes > 5) %>% # only use records where there are more than 5 votes ggplot(mapping = aes(x = year, y = percent_yes, color = country)) + geom_point() + geom_smooth(method = "loess", se = FALSE) + facet_wrap(~ issue) + labs( title = "Percentage of 'Yes' votes in the UN General Assembly", subtitle = "1946 to 2015", y = "% Yes", x = "Year", color = "Country" )
%>% inner_join(un_roll_calls, by = "rcid") %>% inner_join(un_roll_call_issues, by = "rcid") %>% group_by(country, year = year(date), issue) %>% summarize( votes = n(), percent_yes = mean(vote !== "yes") ) %>% filter(votes > 5) %>% # only use records where there are more than 5 votes ggplot(mapping = aes(x = year, y = percent_yes, color = country)) + geom_point() + geom_smooth(method = "loess", se = FALSE) + facet_wrap(~ issue) + labs( title = "Percentage of 'Yes' votes in the UN General Assembly", subtitle = "1946 to 2015", y = "% Yes", x = "Year", color = "Country" )
%>% inner_join(un_roll_calls, by = "rcid") %>% inner_join(un_roll_call_issues, by = "rcid") %>% group_by(country, year = year(date), issue) %>% summarize( votes = n(), percent_yes = mean(vote !== "yes") ) %>% filter(votes > 5) %>% # only use records where there are more than 5 votes ggplot(mapping = aes(x = year, y = percent_yes, color = country)) + geom_point() + geom_smooth(method = "loess", se = FALSE) + facet_wrap(~ issue) + labs( title = "Percentage of 'Yes' votes in the UN General Assembly", subtitle = "1946 to 2015", y = "% Yes", x = "Year", color = "Country" )
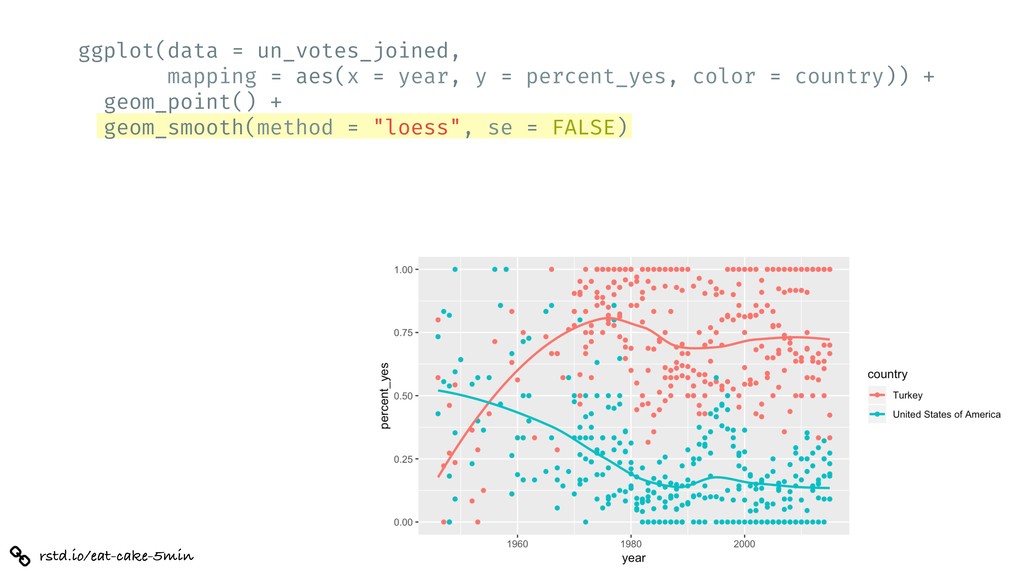
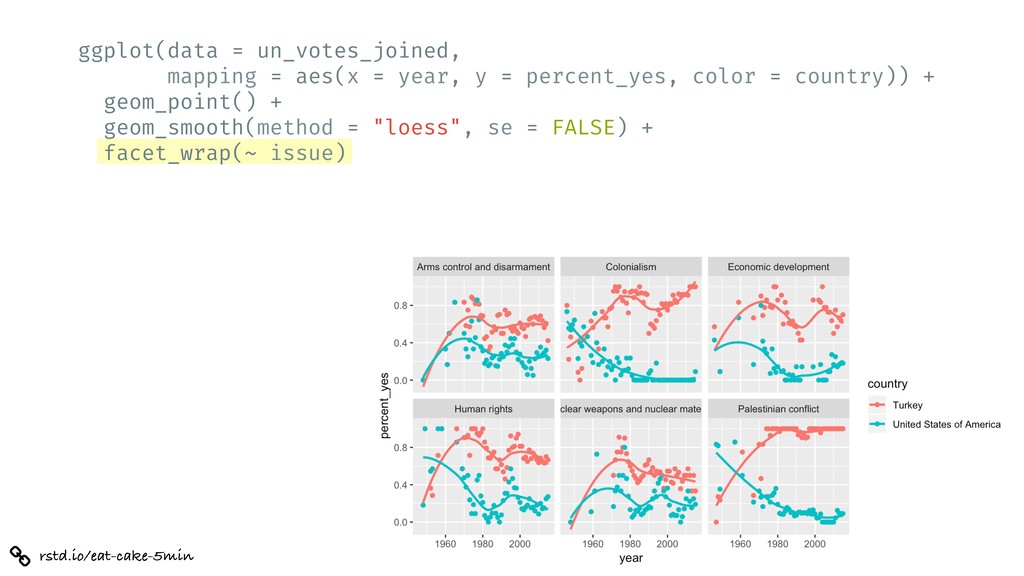
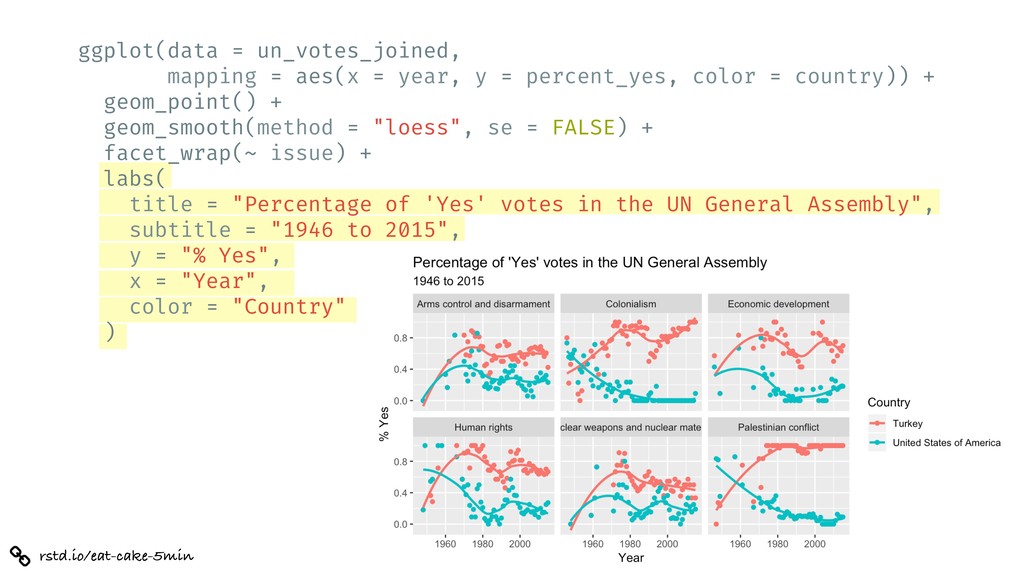
= percent_yes, color = country)) + geom_point() + geom_smooth(method = "loess", se = FALSE) + facet_wrap(~ issue) + labs( title = "Percentage of 'Yes' votes in the UN General Assembly", subtitle = "1946 to 2015", y = "% Yes", x = "Year", color = "Country" )
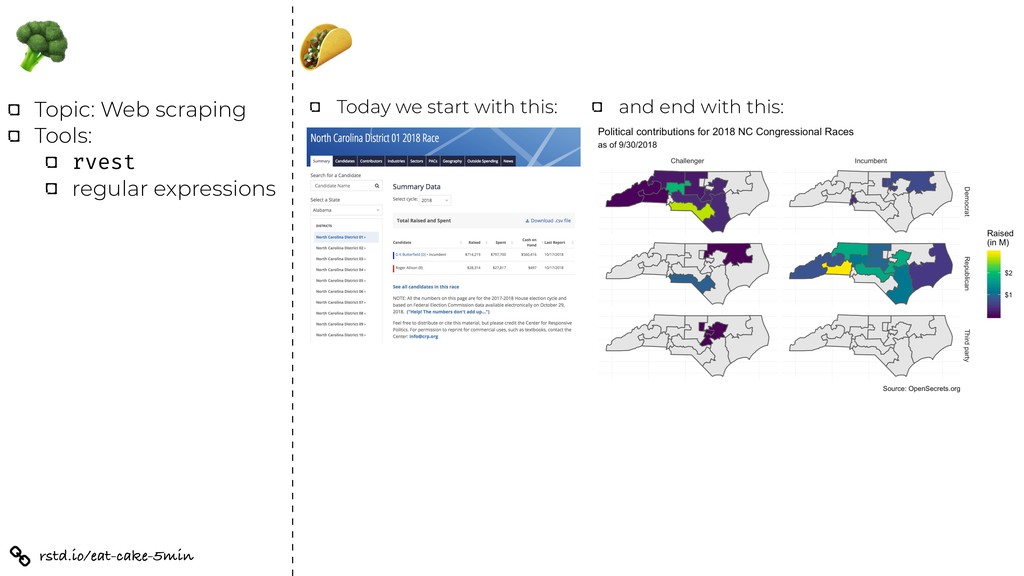
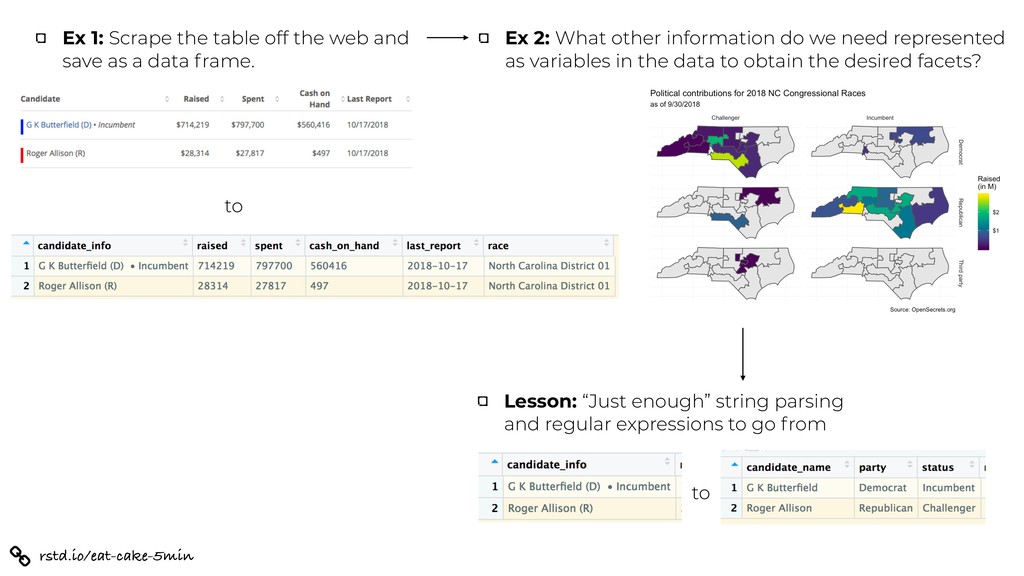
as variables in the data to obtain the desired facets? Lesson: “Just enough” string parsing and regular expressions to go from to Ex 1: Scrape the table off the web and save as a data frame. to
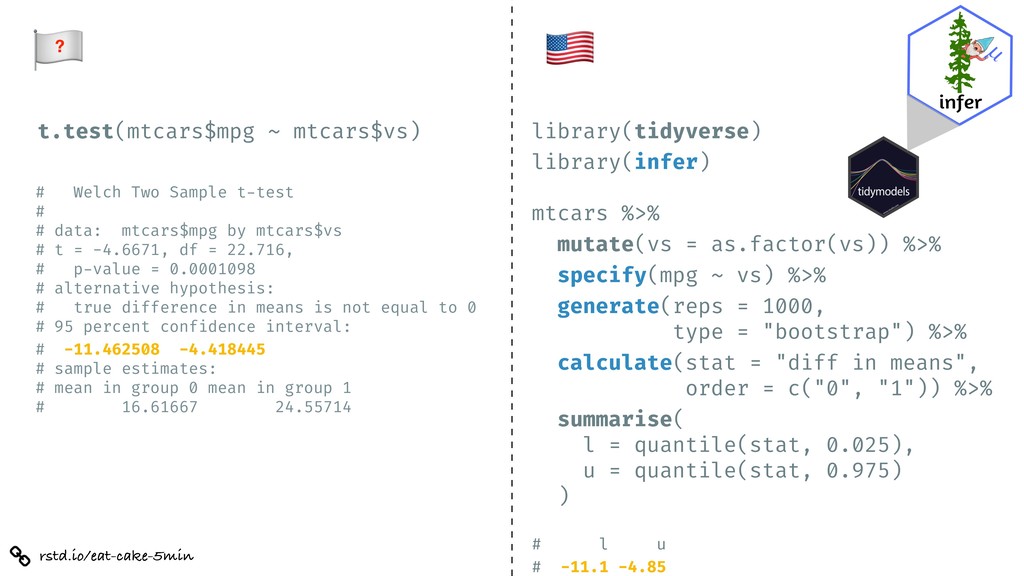
# # data: mtcars$mpg by mtcars$vs # t = -4.6671, df = 22.716, # p-value = 0.0001098 # alternative hypothesis: # true difference in means is not equal to 0 # 95 percent confidence interval: # -11.462508 -4.418445 # sample estimates: # mean in group 0 mean in group 1 # 16.61667 24.55714 library(tidyverse) library(infer) mtcars %>% mutate(vs = as.factor(vs)) %>% specify(mpg ~ vs) %>% generate(reps = 1000, type = "bootstrap") %>% calculate(stat = "diff in means", order = c("0", "1")) %>% summarise( l = quantile(stat, 0.025), u = quantile(stat, 0.975) ) # l u # -11.1 -4.85 ?
![rstd.io/eat-cake-5min Let them eat cake (first)!* mine-cetinkaya-rundel [email protected] @minebocek *](https://files.speakerdeck.com/presentations/e1712613158540b9b36a4dd92e9c70ac/slide_33.jpg)