Upgrade to Pro — share decks privately, control downloads, hide ads and more …

10 Key Performance Indicators - Christian Kvalheim, 10gen

mongodb
April 05, 2012

10 Key Performance Indicators - Christian Kvalheim, 10gen

MongoDB Berlin 2012

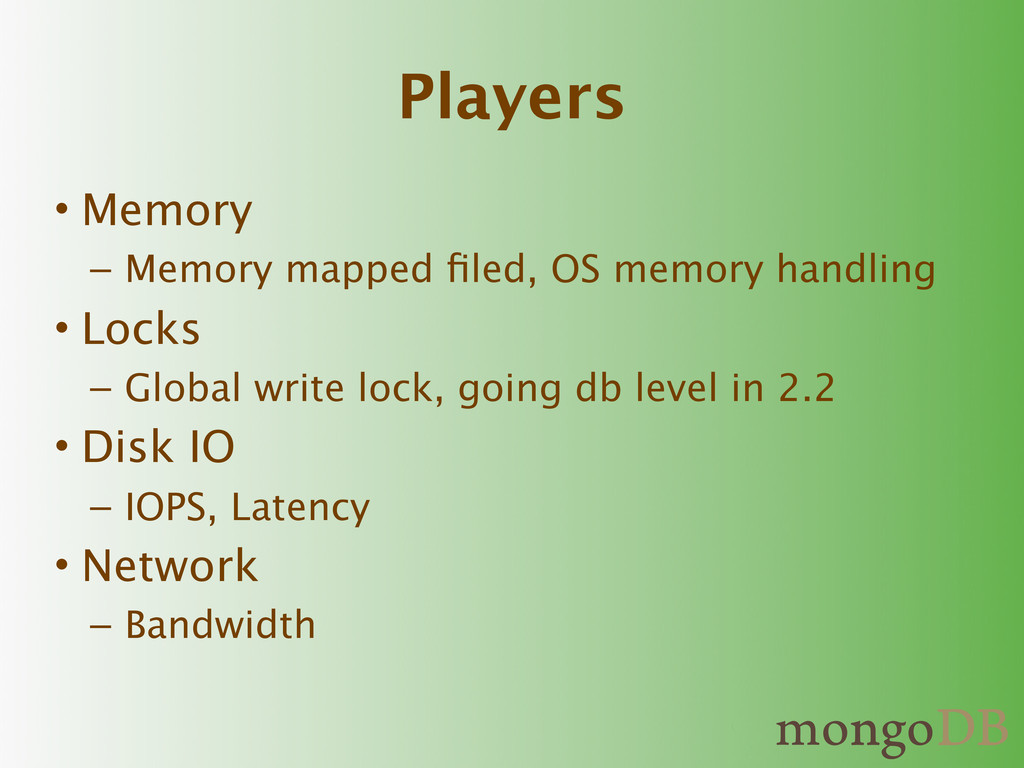
That's right: you too can learn to read the omens and ensure that your MongoDB deployment stays in tip-top shape. We'll look at memory usage, file sizes, flushing, journaling, and all the special incantations that reveal MongoDB's true inner self. By the end of the talk, you'll have ten concrete steps you can take to address performance degradation before it happens. You'll also get a few tips on application design and pointers on remote monitoring.
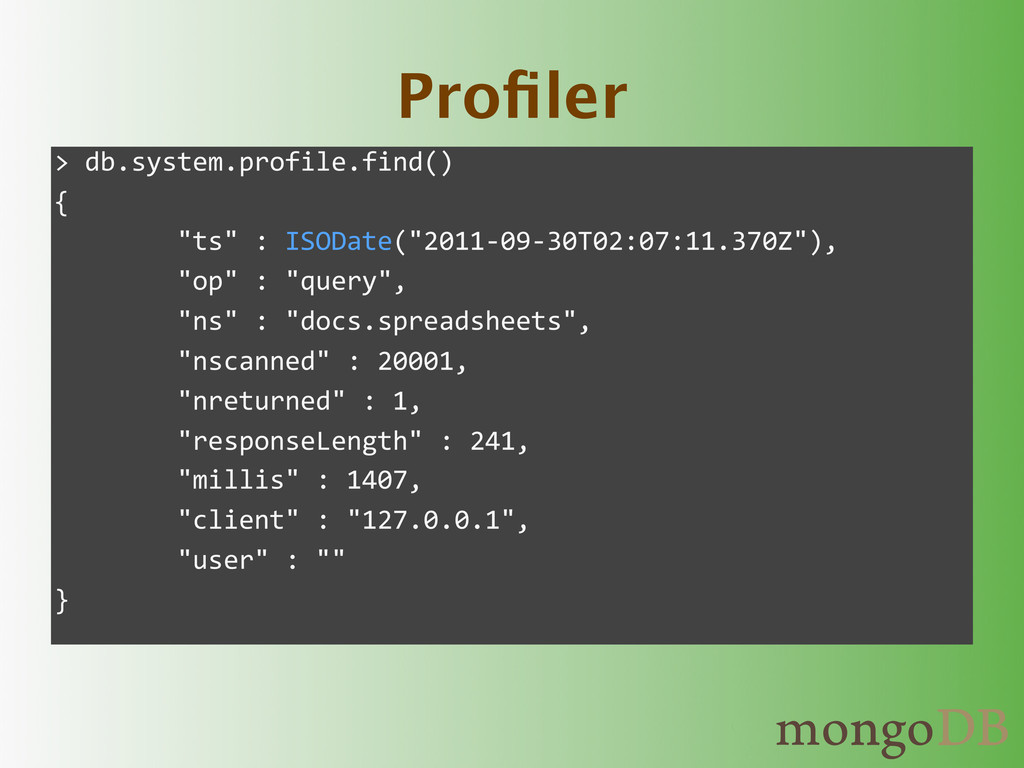
mongodb

April 05, 2012
Tweet

More Decks by mongodb

Other Decks in Technology

Transcript

  1. Speed MongoDB is a high-performance database, but how do I

    know that I’m getting the best performance
  2. Players • Memory – Memory mapped filed, OS memory handling

    • Locks – Global write lock, going db level in 2.2 • Disk IO – IOPS, Latency • Network – Bandwidth
  3. The stats • Flushes • Mapped memory • Virtual memory

    size (Vsize) • Resident memory • Faults • Locked percentage
  4. db.serverStatus >  db.serverStatus(); {     "host"  :  “MacBook.local",  

                 "version"  :  "2.0.1",                "process"  :  "mongod",                "uptime"  :  619052, //  Lots  more  stats... }
  5. Profiling • 3 levels – off – slower than x

    ms – all • Capped collection, 1MB default • Some performance overhead but minimal
  6. Profiler >  db.system.profile.find() {            

       "ts"  :  ISODate("2011-­‐09-­‐30T02:07:11.370Z"),                "op"  :  "query",                "ns"  :  "docs.spreadsheets",                "nscanned"  :  20001,                "nreturned"  :  1,                "responseLength"  :  241,                "millis"  :  1407,                "client"  :  "127.0.0.1",                "user"  :  "" }
  7. Slow Operations Sun  May  22  19:01:47  [conn10] query  docs.spreadsheets  ntoreturn:100

     reslen: 510436 nscanned:19976  {  username:    “Hackett,  Bernie”} nreturned:100      147ms
  8. Replication lag • replication lag is difference in time between

    the primaries last operation and the last operation the secondary committed
  9. Resident Memory >  db.serverStatus().mem {          

         "bits"  :  64,    //  Need  64,  not  32                "resident"  :  7151,  //  Physical  memory                "virtual"  :  14248,  //  Files  +  heap                "mapped"  :  6942  //  Data  files }
  10. Resident Memory >  db.stats() {          

         "db"  :  "docs",                "collections"  :  3,                "objects"  :  805543,                "avgObjSize"  :  5107.312096312674,                "dataSize"  :  4114159508,  //  ~4GB                "storageSize"  :  4282908160,  //  ~4GB                "numExtents"  :  33,                "indexes"  :  3,                "indexSize"  :  126984192,    //  ~126MB                "fileSize"  :  8519680000,  //  ~8.5GB                "ok"  :  1 }
  11. Page Faults >  db.serverStatus().extra_info {     "note"  :  "fields

     vary  by  platform",   “heap_usage_bytes”  :  210656,   “page_faults”  :  2381 }
  12. Page Faults • The number of times the OS needs

    to read and write a new page of data into memory • Very high number indicates thrashing – OS spends more time reading/writing data to disk than doing work
  13. Write Lock Percentage >  db.serverStatus().globalLock {        

           "totalTime"  :  2809217799,                "lockTime"  :  13416655,                "ratio"  :  0.004775939766854653, }
  14. Write lock percentage • the total amount of time the

    server spent in global write lock during the last sample period (one second)
  15. Concurrency • One writer or many readers • Global RW

    Lock • Yields on long-running ops and if we’re likely to go to disk.
  16. Current Op • db.currentOp() let’s you see the current operation

    executing • db.killOp(id) lets you kill a blocking long running operation
  17. Background Flushing • Tells you how often the data is

    written to disk • A high value might indicate IO performance issue – Might happen with network attached storage • Lower the time for flushing to disk to write less data more often
  18. Background Flushing >  db.serverStatus().backgroundFlushing {          

         "flushes"  :  5634,                "total_ms"  :  83556,                "average_ms"  :  14.830670926517572,                "last_ms"  :  4,                "last_finished"  :  ISODate ("2011-­‐09-­‐30T03:30:59.052Z") }
  19. Connections • Each connection takes up heap space • The

    more connections the more context switching for the CPU • Clean up your connections after use
  20. Network Speed • Application might saturate connection leaving little replication

    bandwidth • Slow interconnect between app and db servers might limit your performance – Measure available bandwidth between servers, scp can be used for a sanity check of this. • If a problem bond connections, get 10Gbp cards. • Control the write speed doing
  21. Fragmentation db.spreadsheets.stats() {              

     "ns"  :  "docs.spreadhseets",                "size"  :  8200046932,                                      //  ~8GB                "storageSize"  :  11807223808,            //  ~11GB                "paddingFactor"  :  1.4302,                "totalIndexSize"  :  345964544,            //  ~345MB                "indexSizes"  :  {                        "_id_"  :  66772992,    “username_1_filename_1”  :  146079744,    “username_1_updated_at_1”  :  133111808                },                "ok"  :  1 }
  22. Fragmentation • Padding factor is the extra space MongoDB allocates

    for each document growth when saving documents – doc is 1000 bytes – padding factor 1.5 – total memory allocated 1500 bytes for doc
  23. storageSize / size > 2 • Might not be reclaiming

    free space fast enough • Padding factor might not be correctly calibrated db.spreadsheets.runCommand(“compact”)
  24. paddingFactor > 2 • You might have the wrong data

    model • You might be growing documents too much – embedded documents • Should review Schema Design
  25. Summary • Ensuring dataset in memory is important – Avoid

    page faults • Find slow queries – Minimize time spent in write lock • Make sure you don’t flood Mongo with connections • Ensure you padding factor is < 2 – Check you schema design