Upgrade to Pro — share decks privately, control downloads, hide ads and more …

Unifying logs and metrics with Elastic Beats

Unifying logs and metrics with Elastic Beats

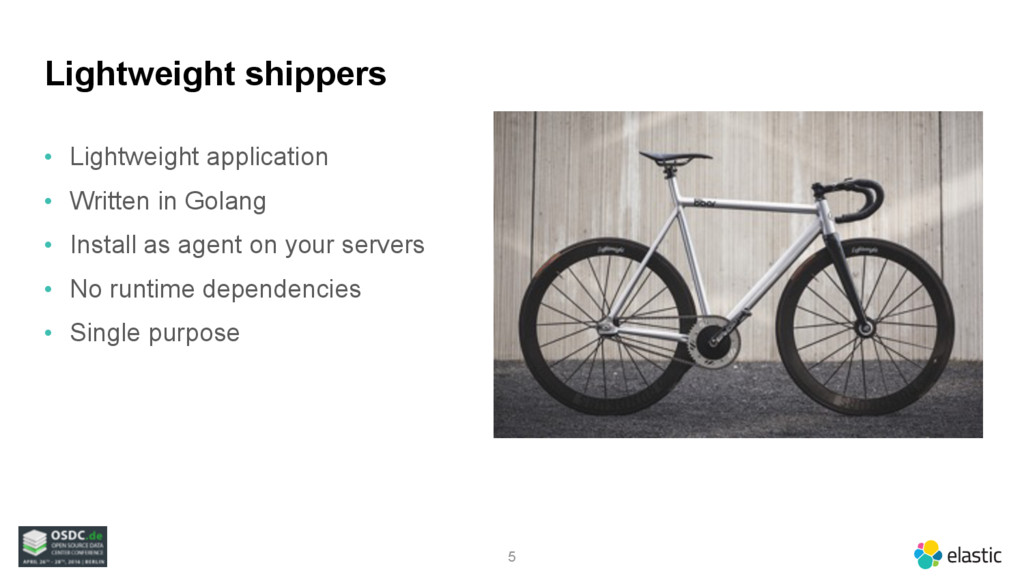
The Beats are a friendly army of lightweight agents that installed on your servers capture operational data and ship it to Elasticsearch for analysis. They are open source, written in Golang, and maintained by Elastic, the company behind Elasticsearch, Logstash, and Kibana.

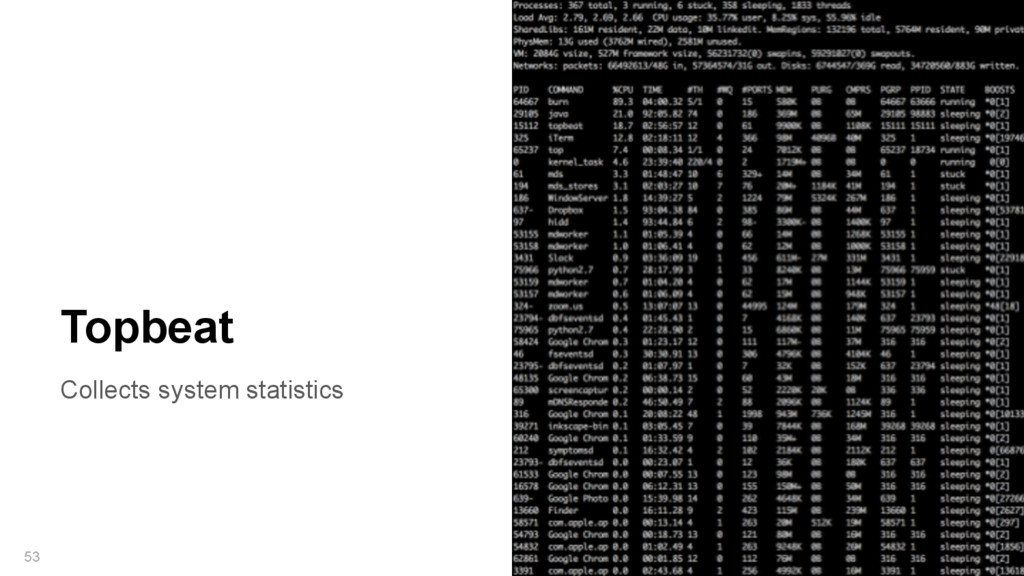
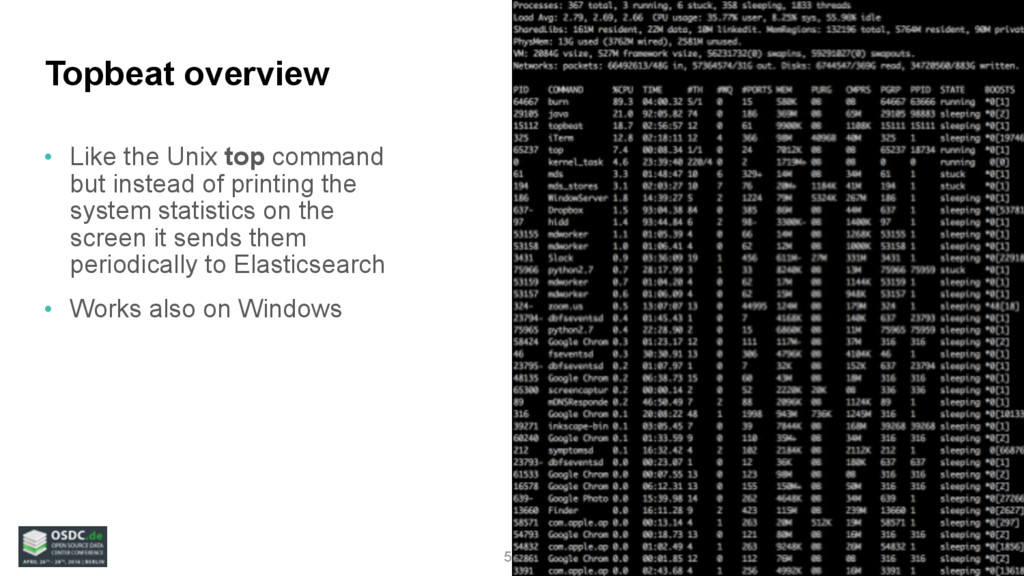
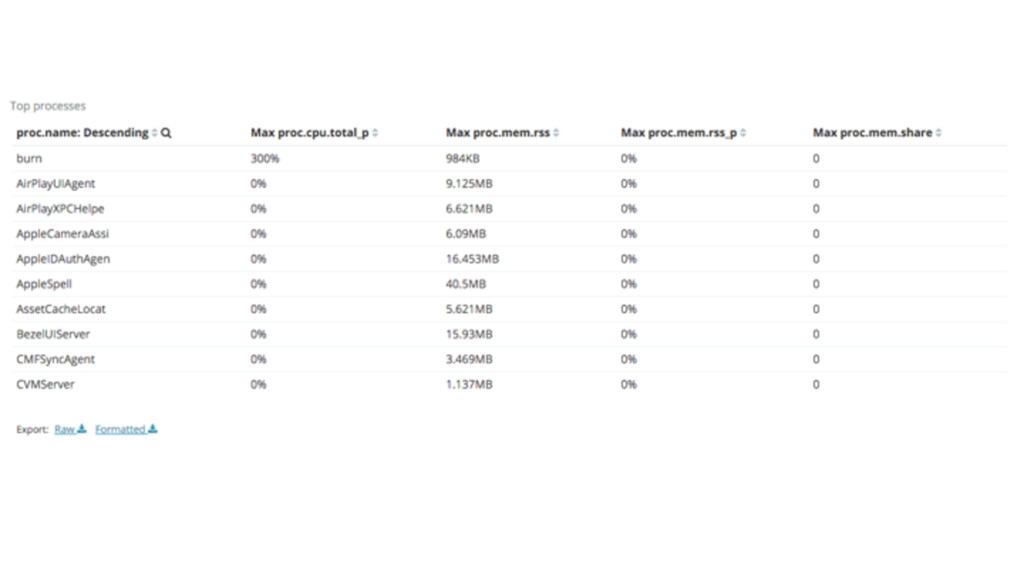
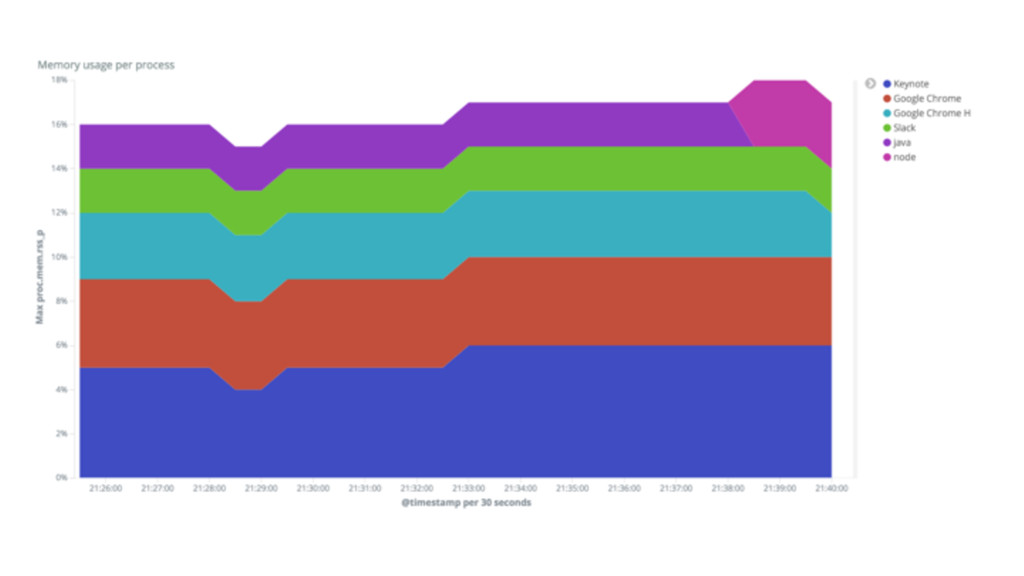
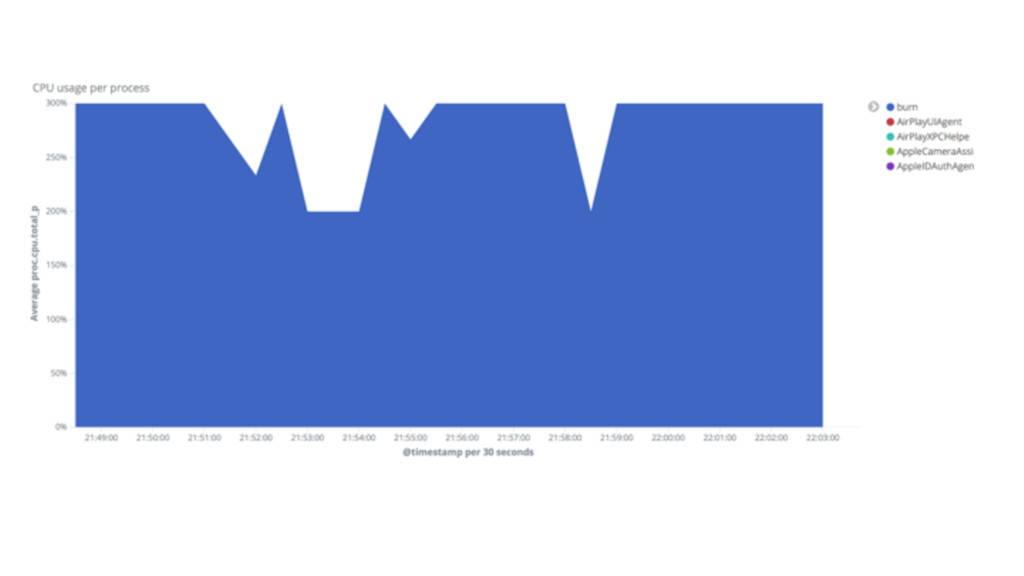
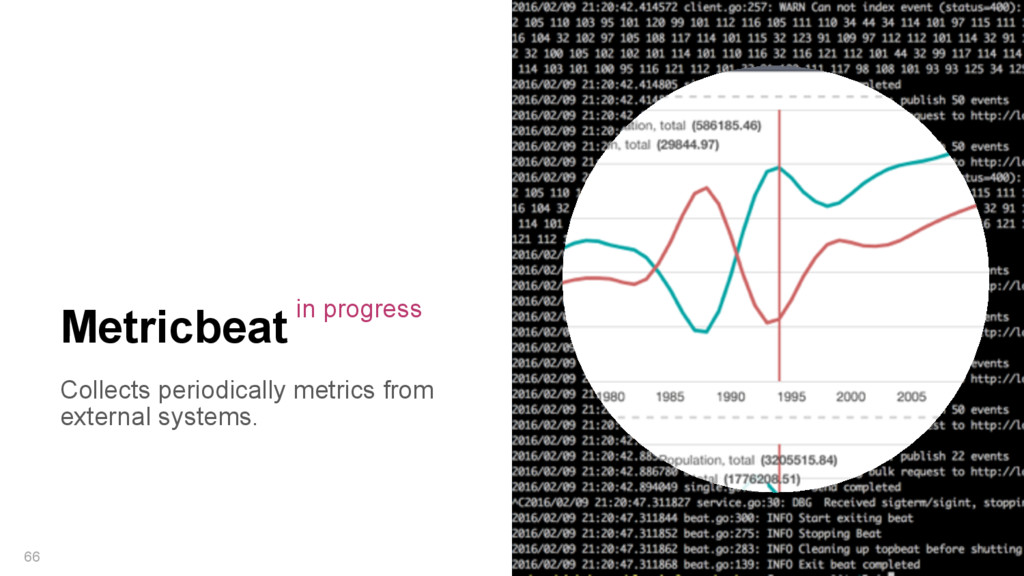
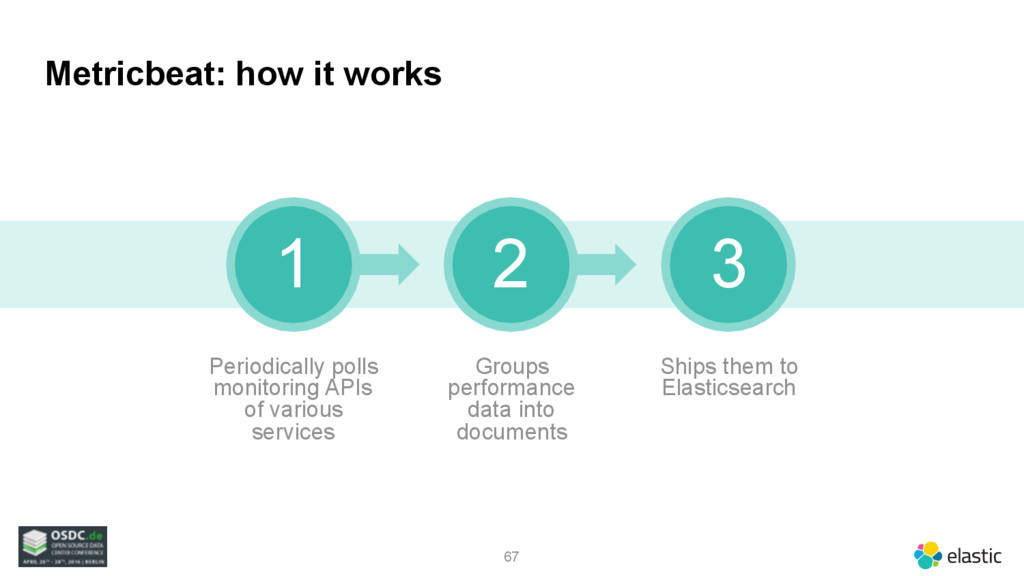
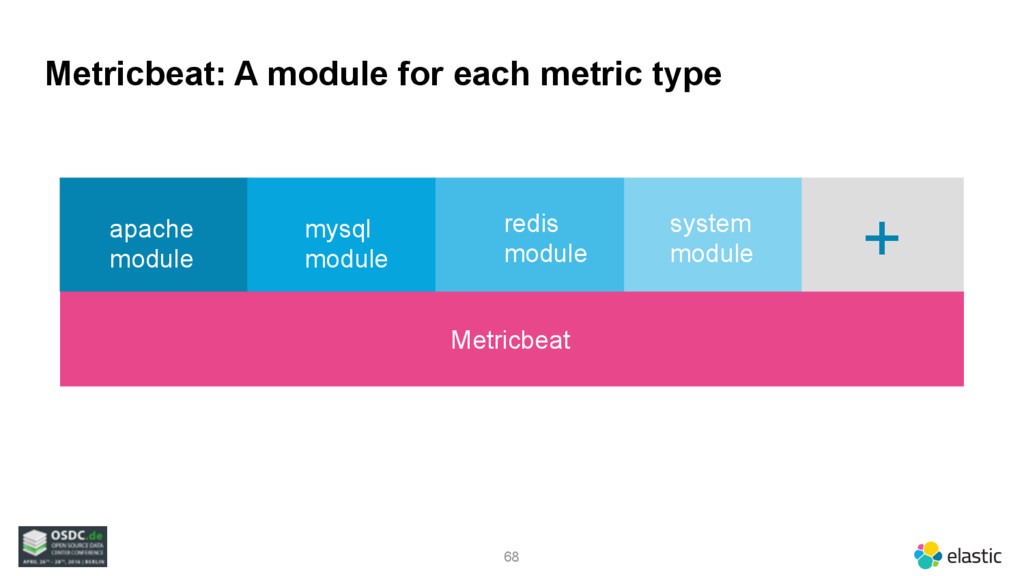
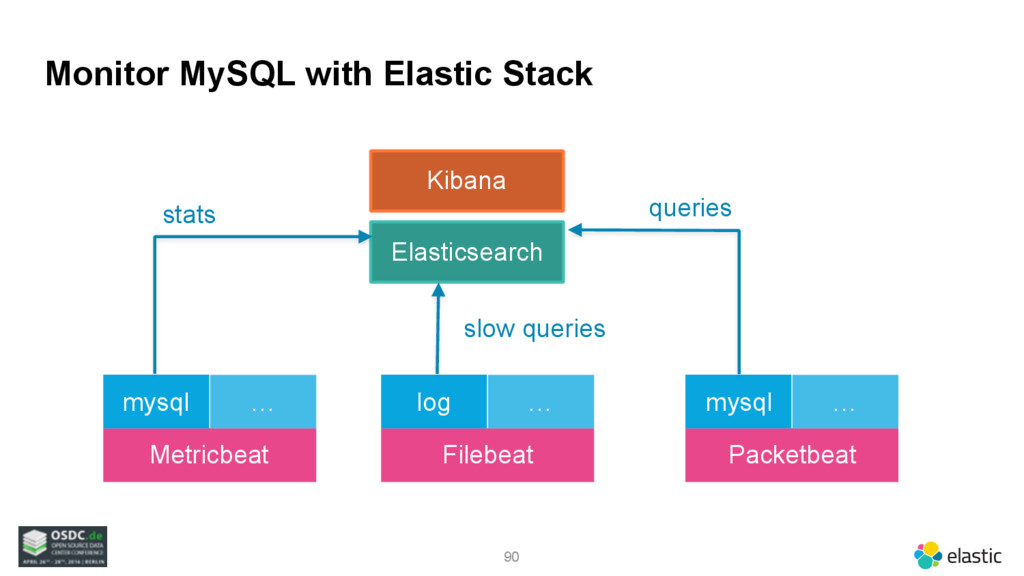
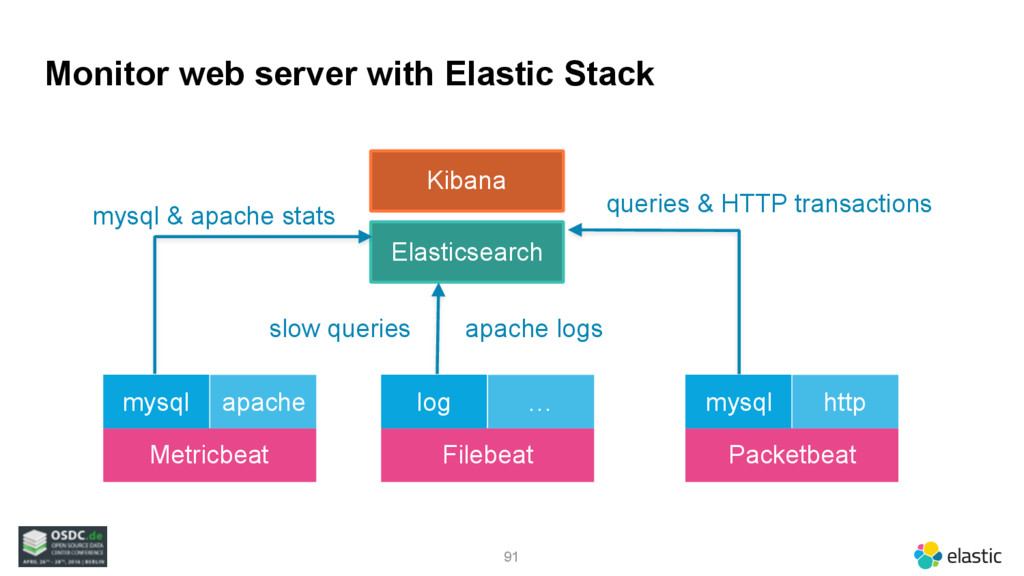
This talk presents the Beats: Topbeat for system level metrics, Filebeat for log files, Packetbeat for wire data and Metricbeat (soon to come) for gathering metrics from external systems.

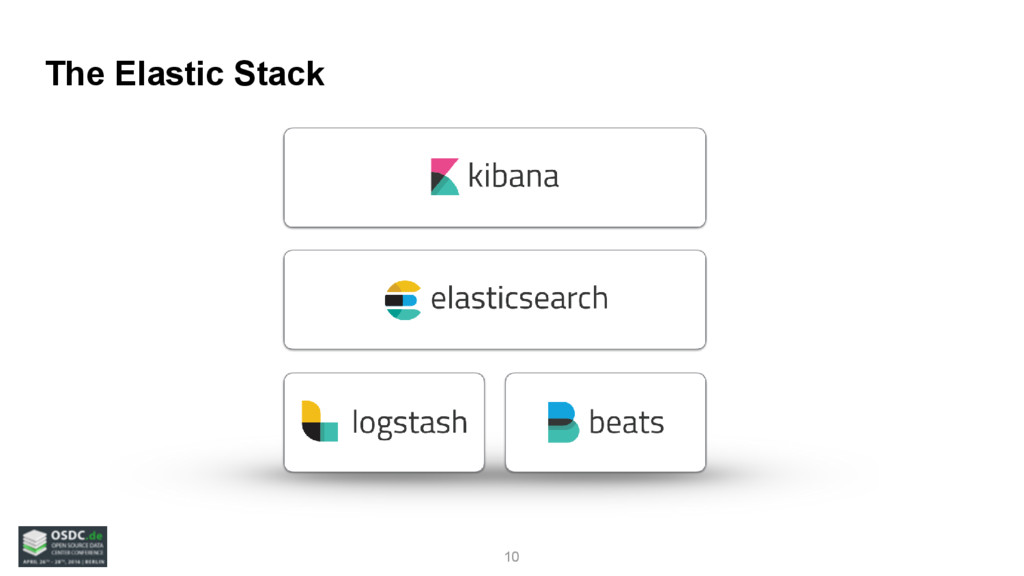
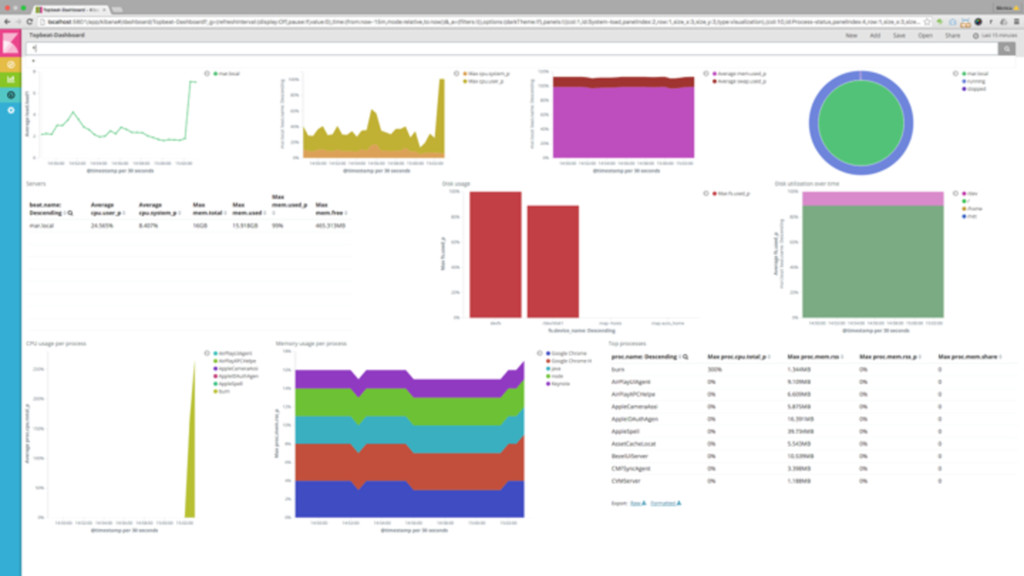
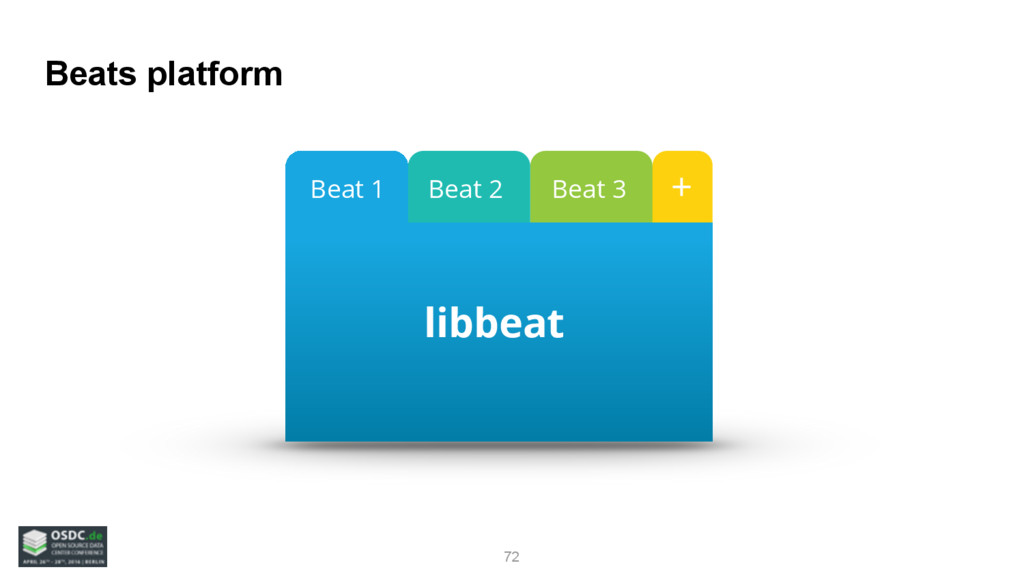
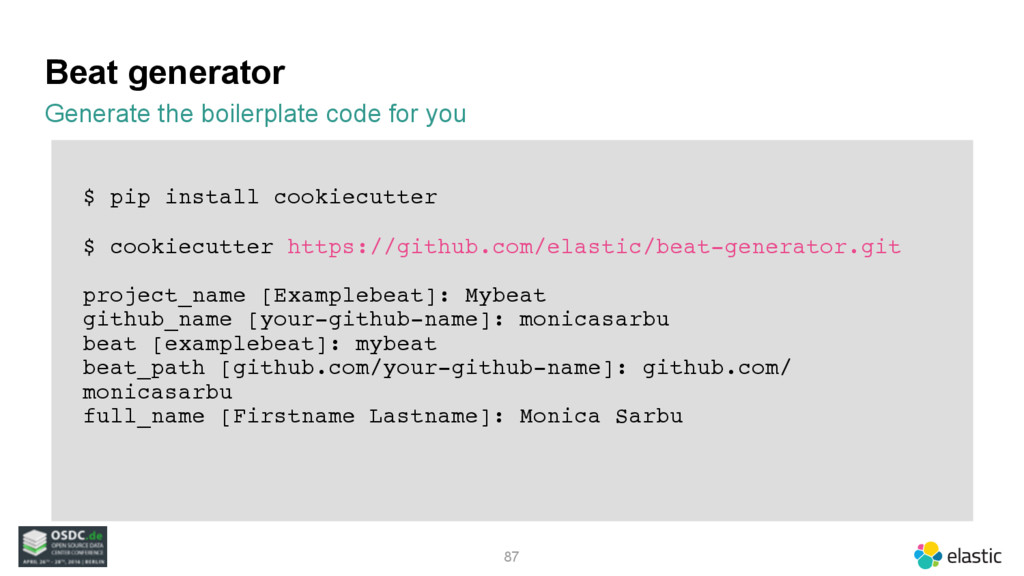
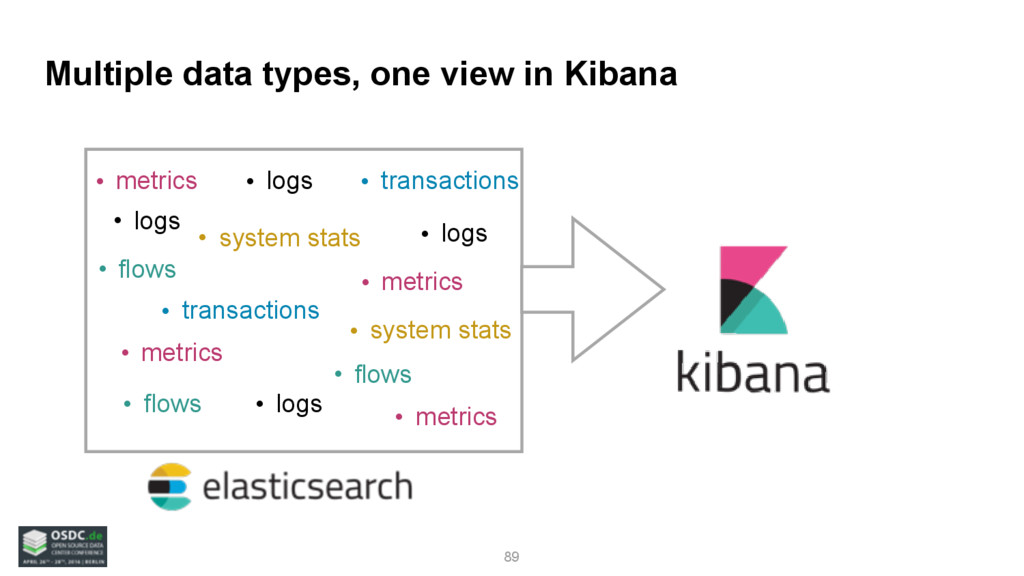
It also demonstrates how to combine the Beats with Logstash and Kibana in one advanced monitoring solution, unifying log management, metrics monitoring and system stats. Finally, you learn how to create a new Beat from scratch using Golang and the libbeat framework to capture any type of information and ship it to Elasticsearch.

Monica Sarbu

April 27, 2016
Tweet

More Decks by Monica Sarbu

Other Decks in Technology

Transcript

  1. Who am I 2 https://www.flickr.com/photos/ofernandezberrios/7176474422 • Team lead at Elastic

    Beats • Software engineer • Joined Elastic 1 year ago @monicasarbu
  2. 5 Lightweight shippers • Lightweight application • Written in Golang

    • Install as agent on your servers • No runtime dependencies • Single purpose
  3. 7 All kinds of operational data • Filebeat • collects

    logs • Winlogbeat • collects Windows event logs • Packetbeat • collects insides from the network packets not released • Topbeat • collects system statistics like CPU usage, disk usage, memory usage per process, etc • Metricbeat • collects metrics by interrogating periodically external services
  4. ‹#› In Elasticsearch .. you are storing the raw value

    … You have the ability to ask and answer questions that you didn’t think about when the data was stored! Felix Barnsteiner
  5. Sniffing the network traffic 13 • Copy traffic at OS

    or hardware level • ZERO latency overhead • Not in the request/response path, cannot break your application Client Server sniff sniff
  6. 14 Sniffing use cases • Security • Intrusion Detection Systems

    • Troubleshooting network issues • Troubleshooting applications • Performance analysis
  7. Monitor the network traffic with OSS tools 15 1 2

    3 4 ssh to each of your server start a trace using tcpdump on each of your server download trace from each server to a common location merge all traces 5 analyze it with Wireshark
  8. The Problem 16 1 2 3 you have lots of

    servers challenging to see the traffic exchanged between your servers Packetbeat makes it easy
  9. Packetbeat overview It does all of this in real time

    directly on the target servers 17 1 2 3 4 capture network traffic decodes network traffic correlates request & response into transactions extract measurements 5 send data to Elasticsearch
  10. Packetbeat: Available decoders 18 HTTP MySQL PostgreSQL MongoDB (community) Memcache

    ICMP (community) + Add your own Thrift-RPC DNS (community) Redis AMQP (community) NFS (community)
  11. Packetbeat: Configuration 19 # Network interfaces where to sniff the

    data interfaces: device: any # Specify the type of your network data protocols: dns: ports: [53] http: ports: [80, 8080, 8081, 5000, 8002] mysql: ports: [3306] …
  12. 20

  13. 21

  14. 22

  15. 23

  16. 24

  17. 25

  18. 26

  19. 27

  20. 28

  21. 29

  22. 30

  23. ‹#› 31 Packetbeat flows • Look into data for which

    we don’t understand the application layer protocol • TLS • Protocols we don’t yet support • Get data about IP / TCP / UDP layers • number of packets • retransmissions • inter-arrival time flows: # network flow timeout timeout: 30s # reporting period period: 10s
  24. 32

  25. 33

  26. 34

  27. 36 Filebeat overview • Simple log forwarder that sends the

    log lines to Elasticsearch • Successor of Logstash Forwarder • It remembers how far it read, so it never loses log line • Reads the log files line by line • It doesn’t parse the log lines!
  28. Filebeat: Parse logs with Logstash 37 • Filebeat sends out

    unparsed log lines • Use filters like Grok, mutate, geoip to parse the log lines • Combine the filters with conditionals or create custom filters in ruby • Forward data to other systems using the Logstash output plugins Filebeat Elasticsearch Logstash Other systems
  29. Filebeat: Parse logs with Ingest Node 38 • Ingest node

    plugin is available starting with Elasticsearch 5.0.0- alpha1 • Filebeat sends out unparsed log lines directly to Elasticsearch • Use Ingest Node processors to parse the log lines • Easier to setup Filebeat Elasticsearch
  30. Filebeat: Configuration Configure prospectors to forward the log lines 39

    filebeat: # List of prospectors to fetch data. prospectors: # Type of files: log or stdin - input_type: log # Files that should be crawled and fetched. paths: - “/var/log/apache2/*” # File encoding: plain, utf-8, big5, gb18030, … encoding: plain
  31. 40

  32. 41

  33. ‹#› Multiline 42 multiline: # Sticks together all lines #

    that don’t start with a [ pattern: ^\[ negate: true match: after Filebeat extra power • Sticks together related log lines in a single event • For all those long exceptions • Can also be done by Logstash, but it’s sometimes easier to configure the patterns closer to the source
  34. 43

  35. ‹#› 45 json: keys_under_root: false message_key: “message” overwrite_keys: false add_error_key:

    false Filebeat extra power JSON logs • application logs in JSON format • you don’t have to choose what data to include in the log line • don’t need to use grok filters from Logstash to parse the application logs
  36. 46

  37. 47

  38. ‹#› Basic filtering 48 # Only send lines starting with

    # ERR or WARN include_lines: [“^ERR”, “^WARN”] # Exclude lines containing # a keyword exclude_lines: [“Request received”] # Exclude files all together exclude_files: [“.gz$”] Filebeat extra power • Because removing stuff at the source is more efficient • Flexible Whitelist + Blacklist regexp log line filtering • Efficient log files filtering (excluded files are never opened) • Works on multiline too
  39. 50 Winlogbeat overview • Sends out unparsed Windows event logs

    • Remembers how far it read, so it never loses any Windows event logs • Use Ingest Node or Logstash to parse the Windows event logs
  40. Winlogbeat: Configuration Specify the event logs that you want to

    monitor 51 winlogbeat: #list of event logs to monitor event_logs: - name: Application - name: Security - name: System
  41. 52

  42. 54 Topbeat overview • Like the Unix top command but

    instead of printing the system statistics on the screen it sends them periodically to Elasticsearch • Works also on Windows
  43. Topbeat: Exported data 55 • system load • total CPU

    usage • CPU usage per core • Swap, memory usage System wide • state • name • command line • pid • CPU usage • memory usage Per process • available disks • used, free space • mounted points Disk usage
  44. Topbeat configuration Specify the system statistics that you want to

    monitor 56 topbeat: # how often to send system statistics period: 10 # specify the processes to monitor procs: [".*"] # Statistics to collect (all enabled by default) stats: system: true process: true filesystem: true
  45. 57

  46. Metricbeat: how it works 67 1 2 3 Periodically polls

    monitoring APIs of various services Groups performance data into documents Ships them to Elasticsearch
  47. Metricbeat: A module for each metric type 68 Metricbeat apache

    module mysql module redis module system module +
  48. 69 Metricbeat: It is also a library! • Use the

    Metricbeat infrastructure, to create a standalone Beat • You can create a Beat with a single module that exports your custom data • Can use the built in Metricbeat modules Metricbeat df module github.com/ruflin/df2beat
  49. Metricbeat module vs standalone Beat 70 • Contributed via PR

    to the elastic/beats Github repository • Officially supported • Supports common systems • Docker based integration tests Metricbeat module • In a separate Github repository • Supported by the community • Supports specialized systems • Optional Docker based integration tests Standalone Beat
  50. libbeat 73 • Written in Go • Provide common functionality

    for reading configuration files, for handling CLI arguments, for logging • Makes sure reliably send the data out • Provide things like encryption, authentication with certificates • Has support for different outputs: Elasticsearch, Logstash, Redis, Kafka libbeat Outputs
  51. Community Beats 75 libbeat Community Beats Elastic Beats Collect, Parse

    & Ship • Standalone projects • Written in Go • Use libbeat • Concentrate only on collecting the data • Solve a specific use case
  52. Official vs Community Beats 76 • In the elastic/beats Github

    repository • Officially supported • Synced releases with the whole stack Official Beats • In another Github repository • Supported by the community • Releases at any time Community Beats
  53. 77 1 Apachebeat 2 Dockerbeat 3 Elasticbeat 4 Execbeat 5

    Factbeat 6 Hsbeat 20 COMMUNITY BEATS Sending all sorts of data to Elasticsearch 7 Httpbeat 8 Nagioscheckbeat 9 Nginxbeat 10 Phpfpmbeat 11 Pingbeat 13 Unifiedbeat 12 Redisbeat 14 Uwsgibeat 15 Flowbeat 16 Lmsensorsbeat 17 Twitterbeat 18 Upbeat 19 Wmibeat 20 Packagebeat
  54. ‹#› 78 input: # Loop every 5 seconds period: 5

    # Use raw sockets for ping # Requires root! privileged: true # Whether to perform IPv4/v6 pings useipv4: true useipv6: false # List targets under the tag # you want assigned to targets: # tag: google google: - google.com.au - google.com You know, for pings • Sends ICMP (v4 or v6) pings periodically to a list of hosts • Can send also UDP pings (no root required) • Resolves DNS • Records RTT Pingbeat
  55. Pingbeat output 79 { "@timestamp": "2016-02-08T11:02:22.675Z", "beat": { "hostname": "Tudors-MBP",

    "name": "Tudors-MBP" }, "count": 1, "rtt": 25.336089, "tag": "google", "target_addr": "216.58.213.227", "target_name": "google.com.au", "type": "pingbeat" }
  56. ‹#› 80 Execbeat execbeat: execs: # Each - Commands to

    execute. - # Cron expression # Default is every 1 minute. cron: "@every 10s" # The command to execute command: echo args: "Hello World" document_type: jolokia fields: host: test2 • Accepts cron expressions • Sends stdout and stderr to Elastic search • Use Logstash and Grok to further parse the output Run any command
  57. Execbeat output 81 { "@timestamp": "2016-02-08T11:59:36.007Z", "beat": { "hostname": "Tudors-MBP",

    "name": "Tudors-MBP" }, "exec": { "command": "echo", "stdout": "Hello World\n" }, "fields": { "host": "test2" }, "type": "jolokia" }
  58. ‹#› 82 Dockerbeat Docker Monitoring • Uses the Docker API

    • Exports per container stats about: • CPU • Memory • Disk • Network • IO access • Log input: # In seconds, defines how often to # read server statistics period: 5 # Define the docker socket path # By default, this will get the # unix:///var/run/docker.sock socket:
  59. Dockerbeat output 83 { "@timestamp": "2016-02-08T12:44:56.136Z", "containerID": "17021c571d69fe4e93ee395b129c0f073d8aed6d618c9d0d805f68e0b66b2c3f", "containerName": "kibana",

    "memory": { "failcnt": 0, "limit": 1044586496, "maxUsage": 68485120, "usage": 9732096, "usage_p": 0.009316697121077851 }, "type": "memory" }
  60. ‹#› 84 Nagioscheckbeat Run Nagios checks • Can execute any

    Nagios plugin • Execution period configurable per check • Sends alerts (Warning/Critical) to Elasticsearch • Sends performance data to Elasticsearch input: checks: - name: "disks" cmd: "plugins/check_disk" args: "-w 80 -c 90 -x /dev" period: "1h" - name: "load" cmd: "plugins/check_load" args: "-w 5 -c 10" period: "1m"
  61. Nagioscheckbeat output 85 { "@timestamp": "2015-12-30T18:56:33.933Z", "args": "-w 5 -c

    10", "cmd": "/usr/lib64/nagios/plugins/check_load", "count": 1, "message": "OK - load average: 0.16, 0.05, 0.06", "status": "OK", "took_ms": 14, "type": "nagioscheck" }
  62. Beat generator Generate the boilerplate code for you 87 $

    pip install cookiecutter $ cookiecutter https://github.com/elastic/beat-generator.git project_name [Examplebeat]: Mybeat github_name [your-github-name]: monicasarbu beat [examplebeat]: mybeat beat_path [github.com/your-github-name]: github.com/ monicasarbu full_name [Firstname Lastname]: Monica Sarbu
  63. 88 Beats Packer • Cross-compiles to all our supported platforms

    • Produces RPMs, DEBs, • Same tools that we use to build the official Elastic Beats • Can be executed from Travis CI
  64. Multiple data types, one view in Kibana 89 • metrics

    • flows • logs • system stats • transactions • transactions • metrics • metrics • logs • logs • system stats • flows • flows • metrics • logs
  65. Monitor MySQL with Elastic Stack 90 Metricbeat mysql … Filebeat

    log … Packetbeat mysql … Elasticsearch Kibana stats queries slow queries
  66. Monitor web server with Elastic Stack 91 Metricbeat mysql apache

    Filebeat log … Packetbeat mysql http Elasticsearch Kibana mysql & apache stats queries & HTTP transactions slow queries apache logs
  67. ‹#› 93 Want to hear more about Logstash? Don’t miss

    Ingest Logs with Style by Pere Urbon-Bayes Thursday 12:00pm - 1:00pm in MOA 05
  68. ‹#› Q&A Find us on: • github.com/elastic/beats • discuss.elastic.co •

    @elastic #elasticbeats • #beats on freenode Or Here. In Real Life!
  69. ‹#› Please attribute Elastic with a link to elastic.co Except

    where otherwise noted, this work is licensed under http://creativecommons.org/licenses/by-nd/4.0/ Creative Commons and the double C in a circle are registered trademarks of Creative Commons in the United States and other countries. Third party marks and brands are the property of their respective holders. 95