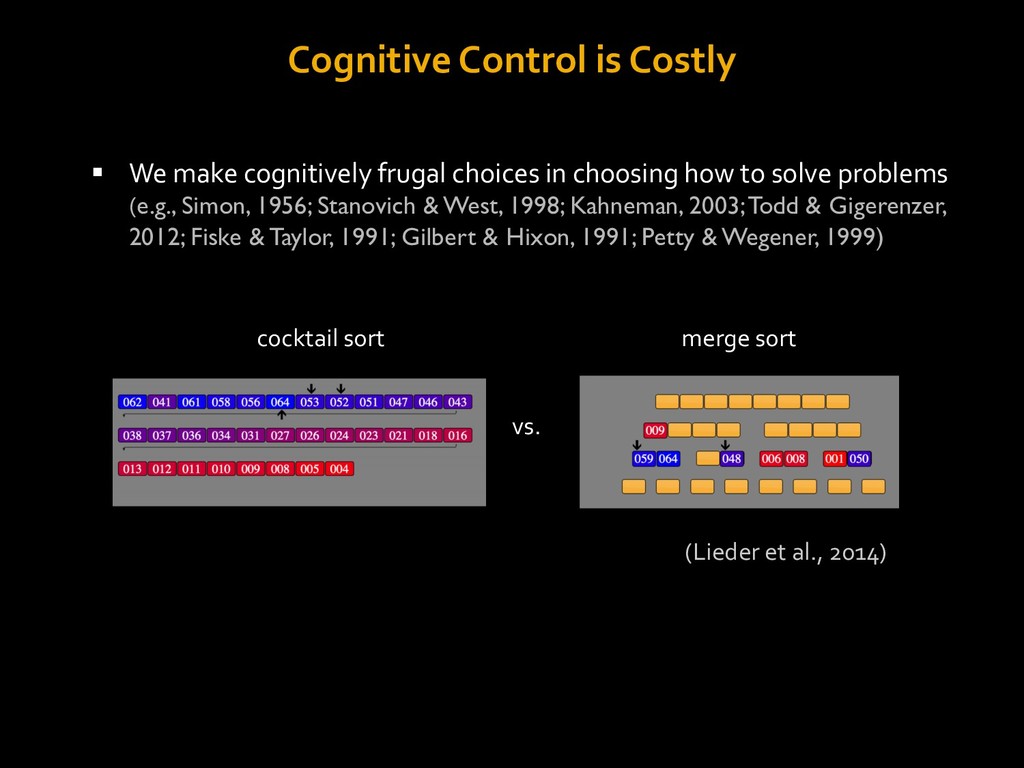
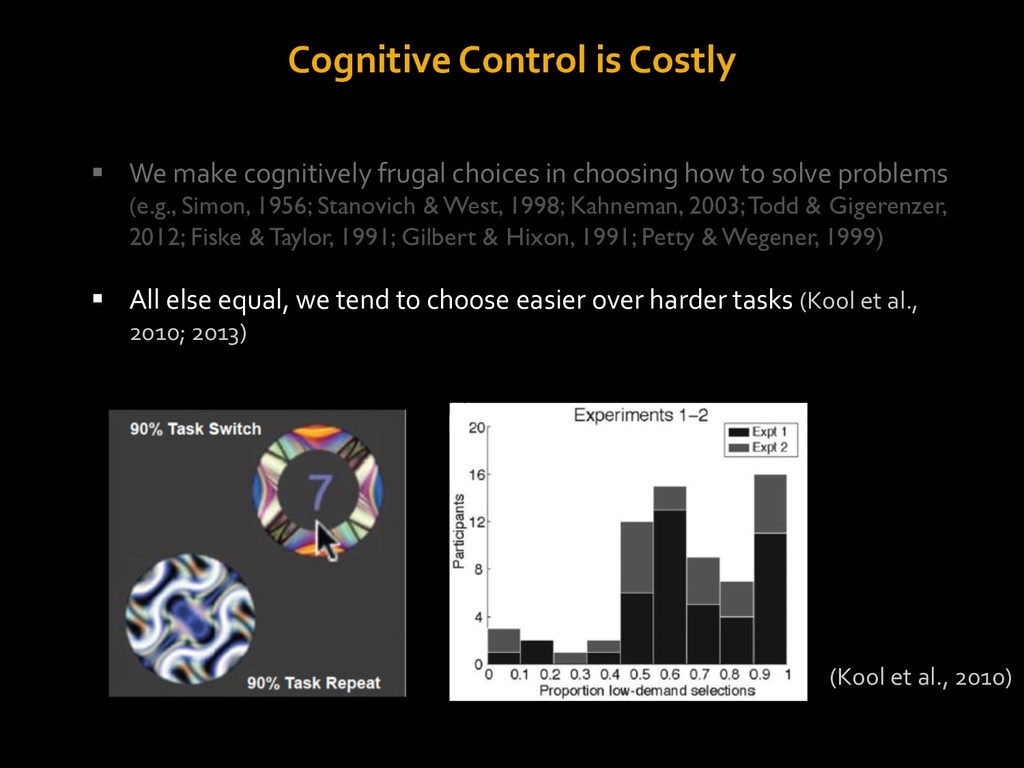
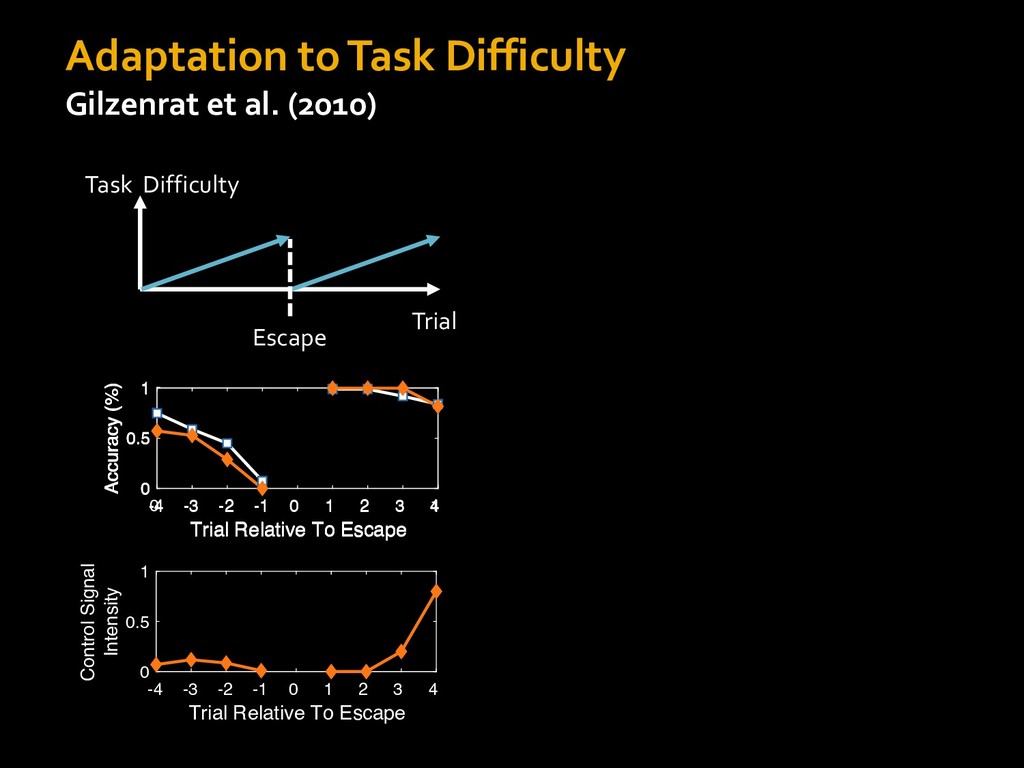
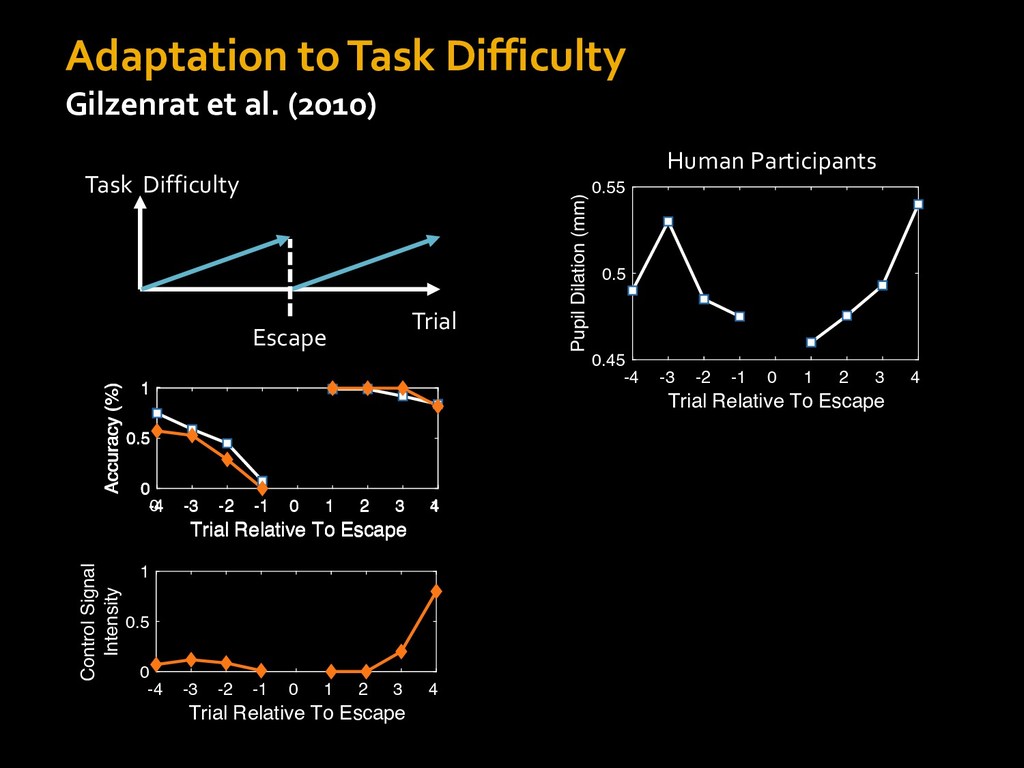
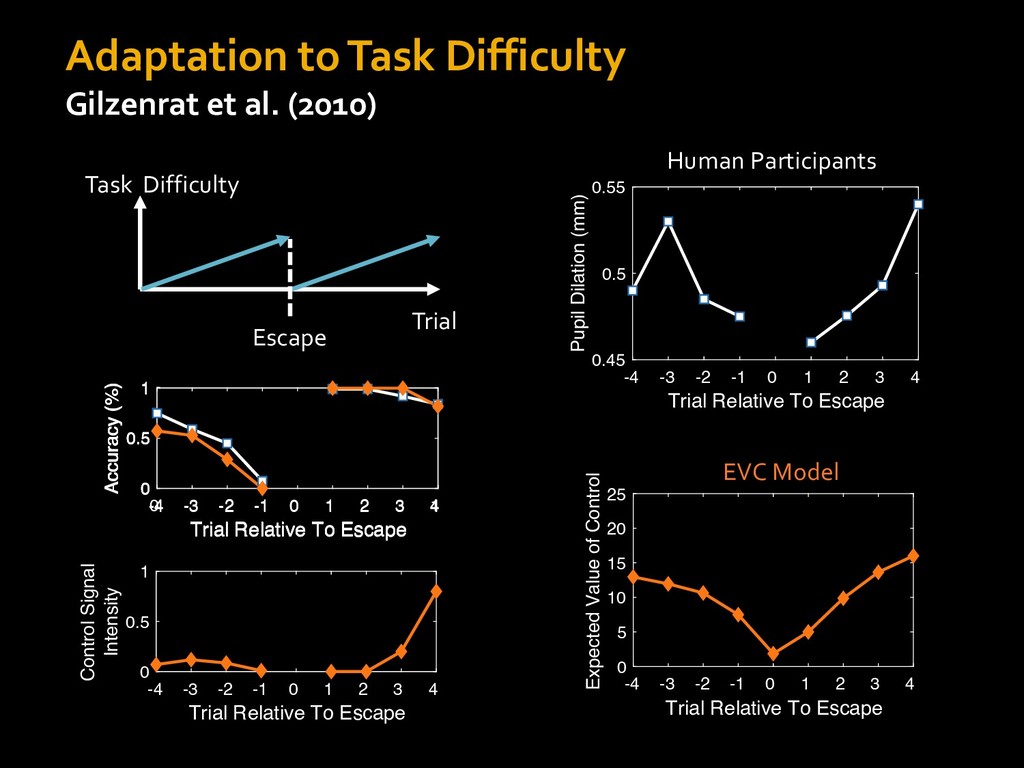
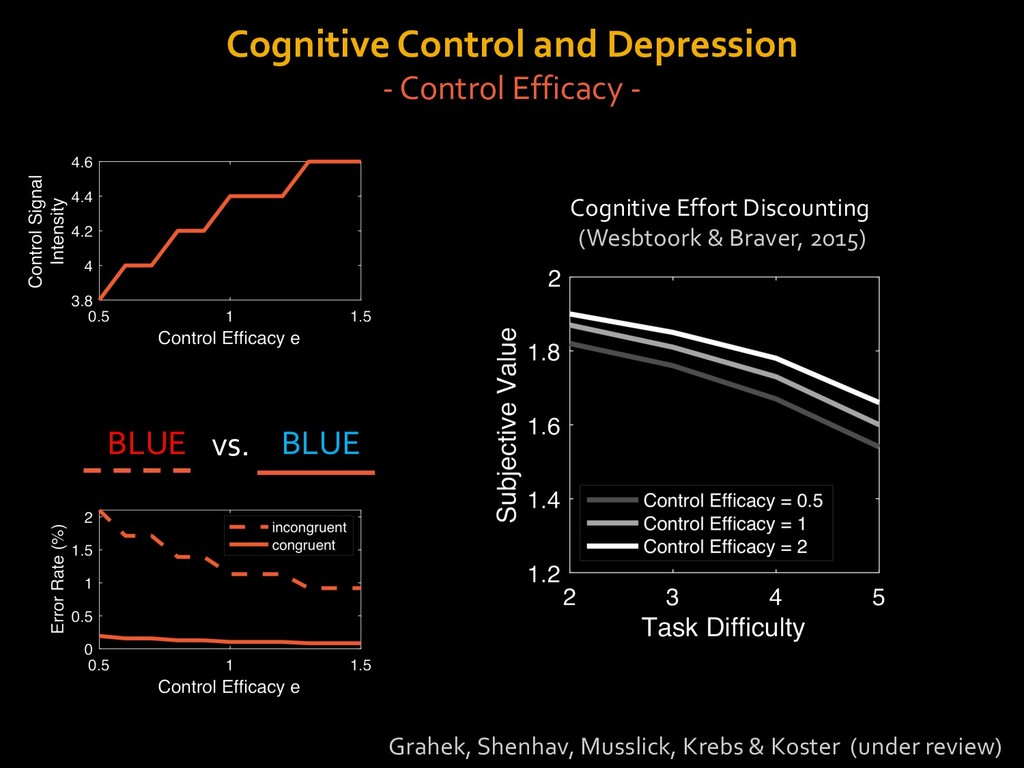
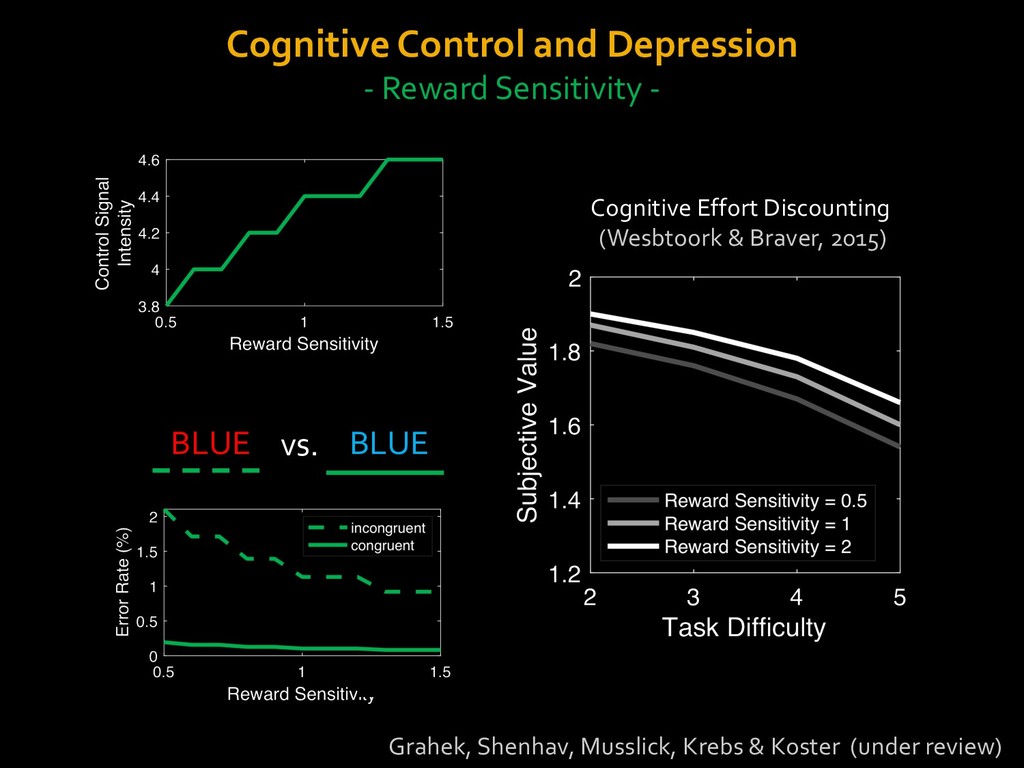
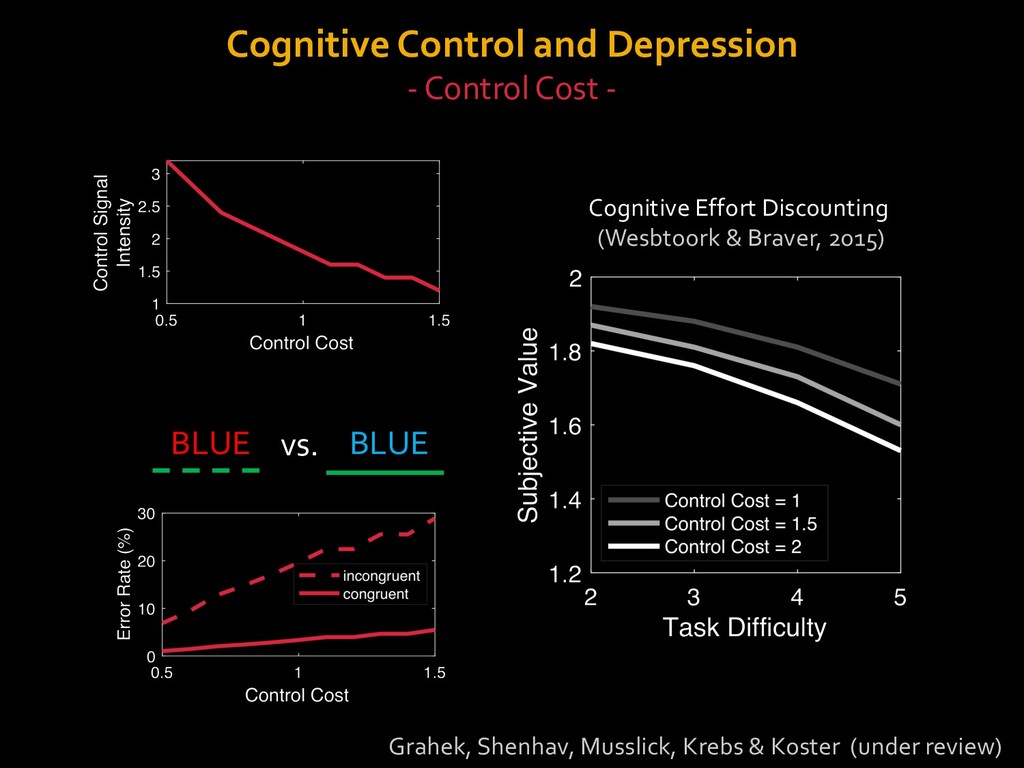
in choosing how to solve problems (e.g., Simon, 1956; Stanovich & West, 1998; Kahneman, 2003; Todd & Gigerenzer, 2012; Fiske & Taylor, 1991; Gilbert & Hixon, 1991; Petty & Wegener, 1999) § All else equal, we tend to choose easier over harder tasks (Kool et al., 2010; 2013) § We are willing to forgo rewards to avoid investing cognitive effort (Westbrook & Braver,2015) Task Difficulty (Westbrook & Braver,2015)