Upgrade to Pro — share decks privately, control downloads, hide ads and more …

On the Rational Bounds of Cognitive Control

On the Rational Bounds of Cognitive Control

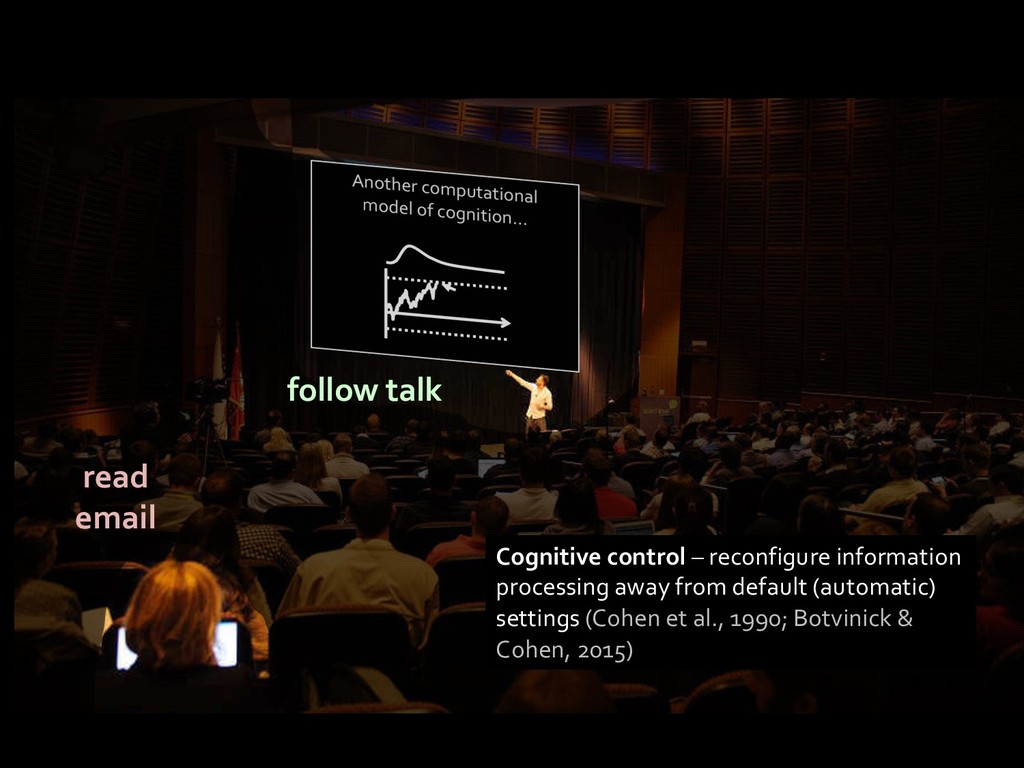
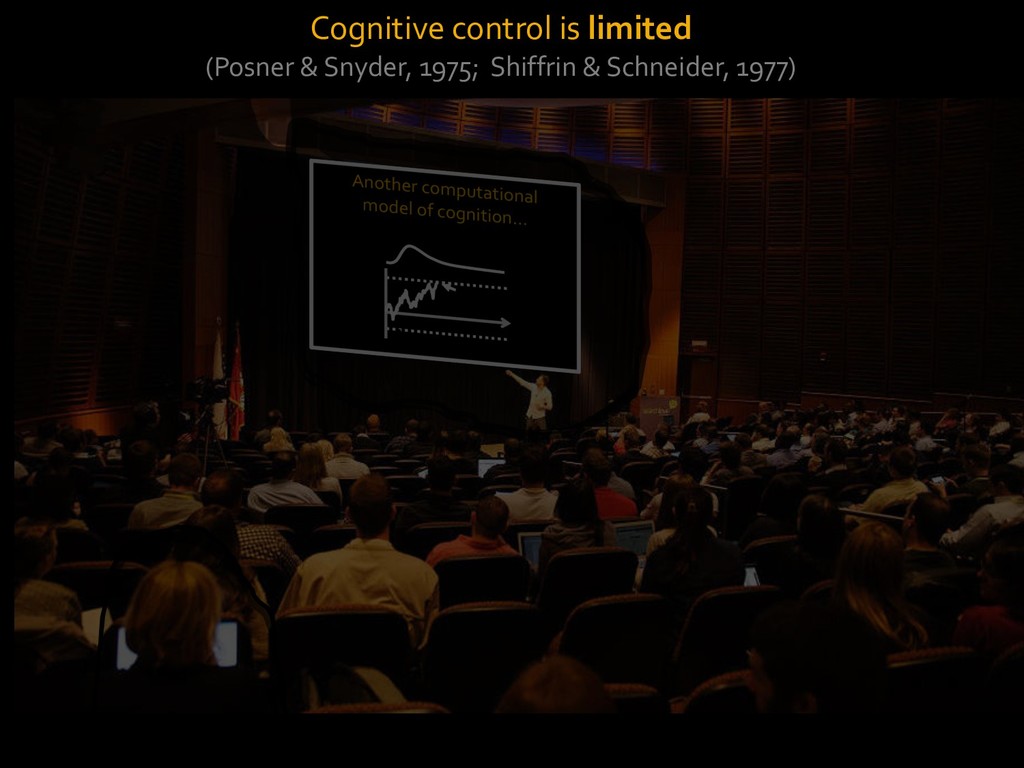
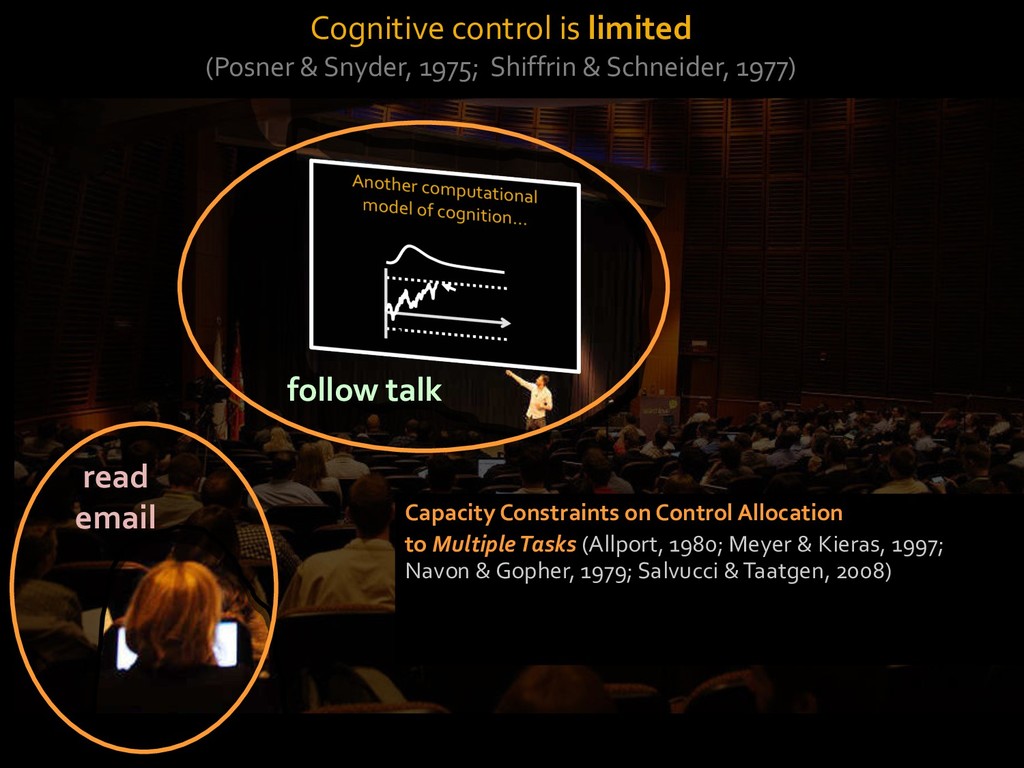
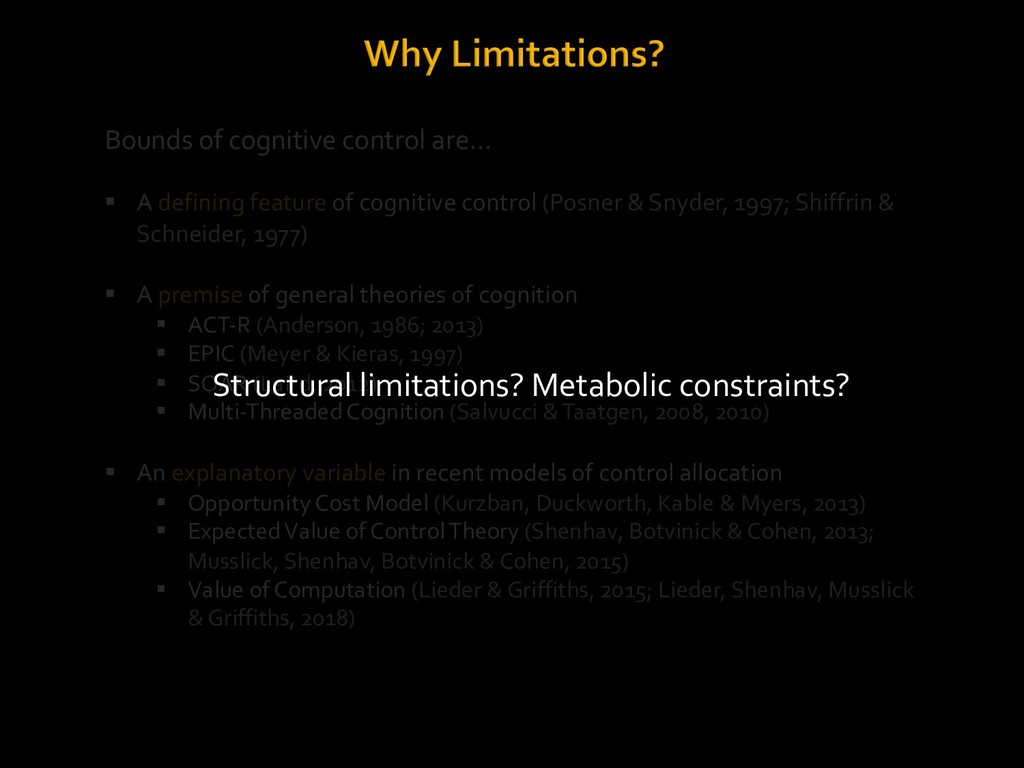
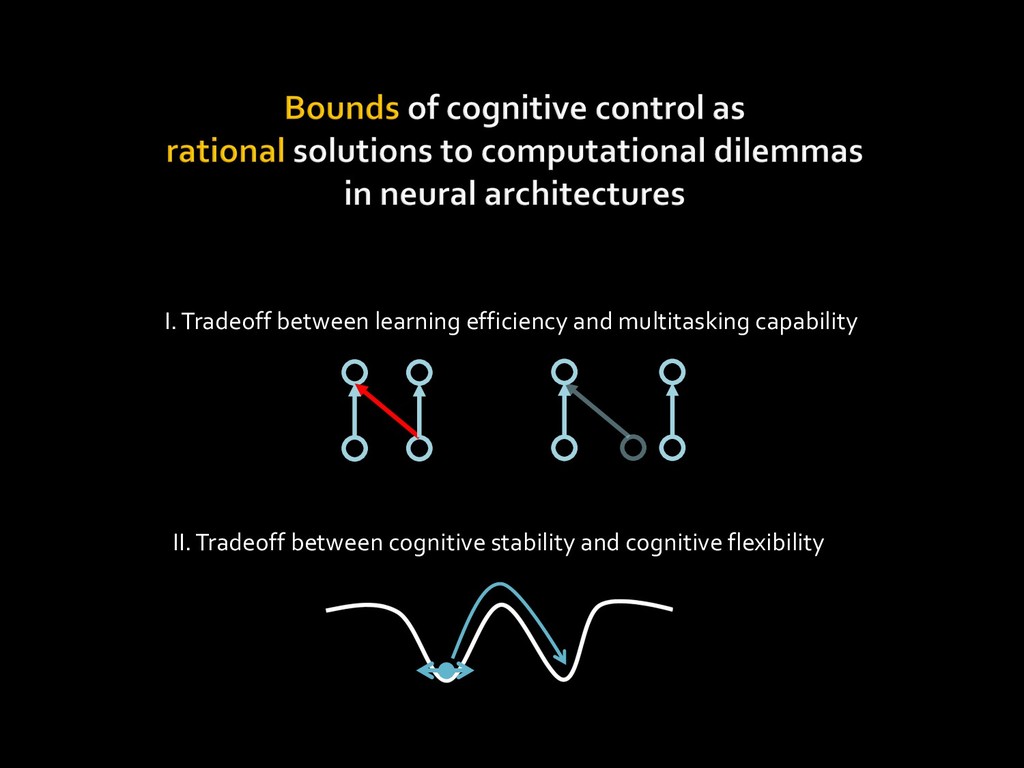
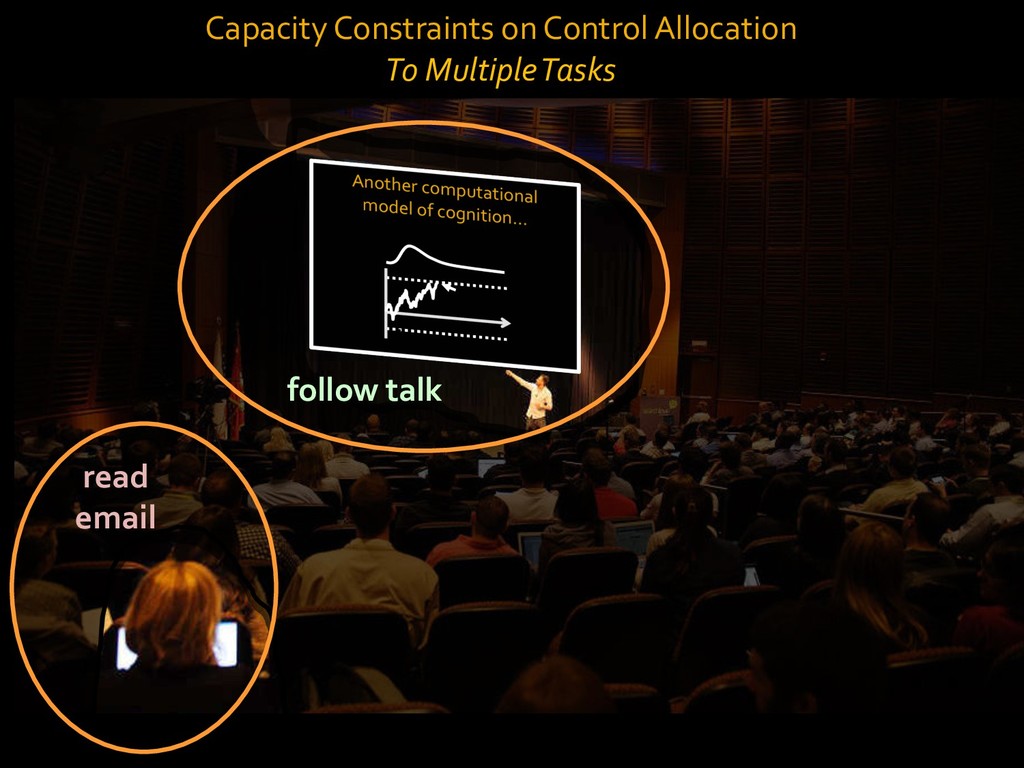
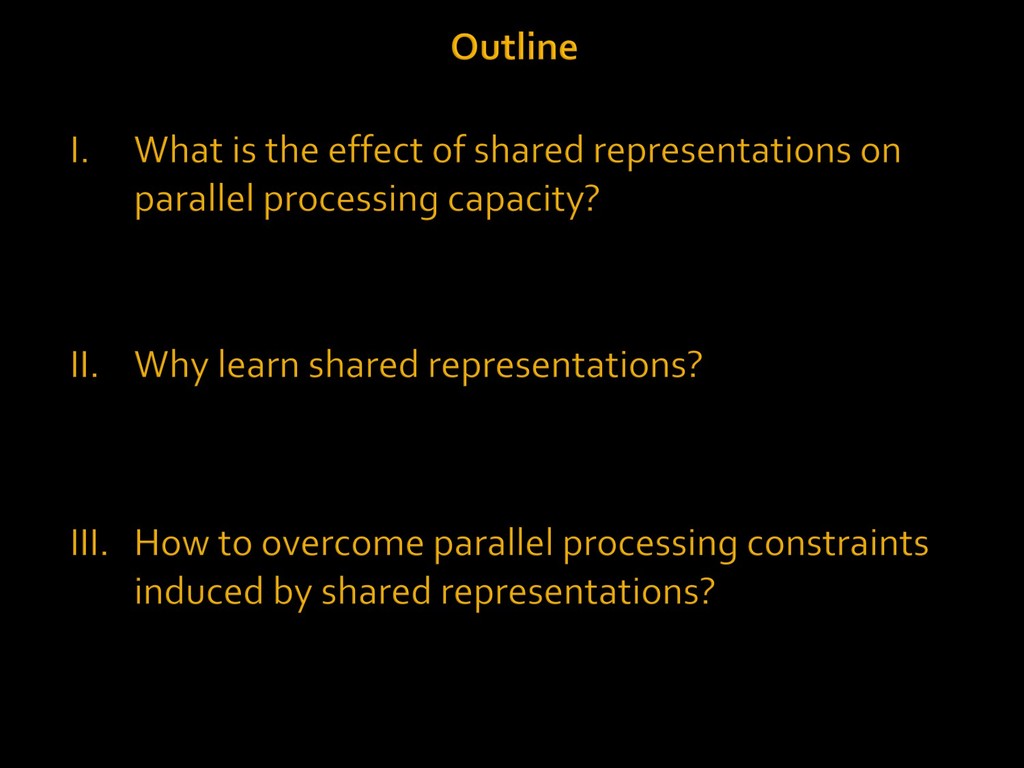
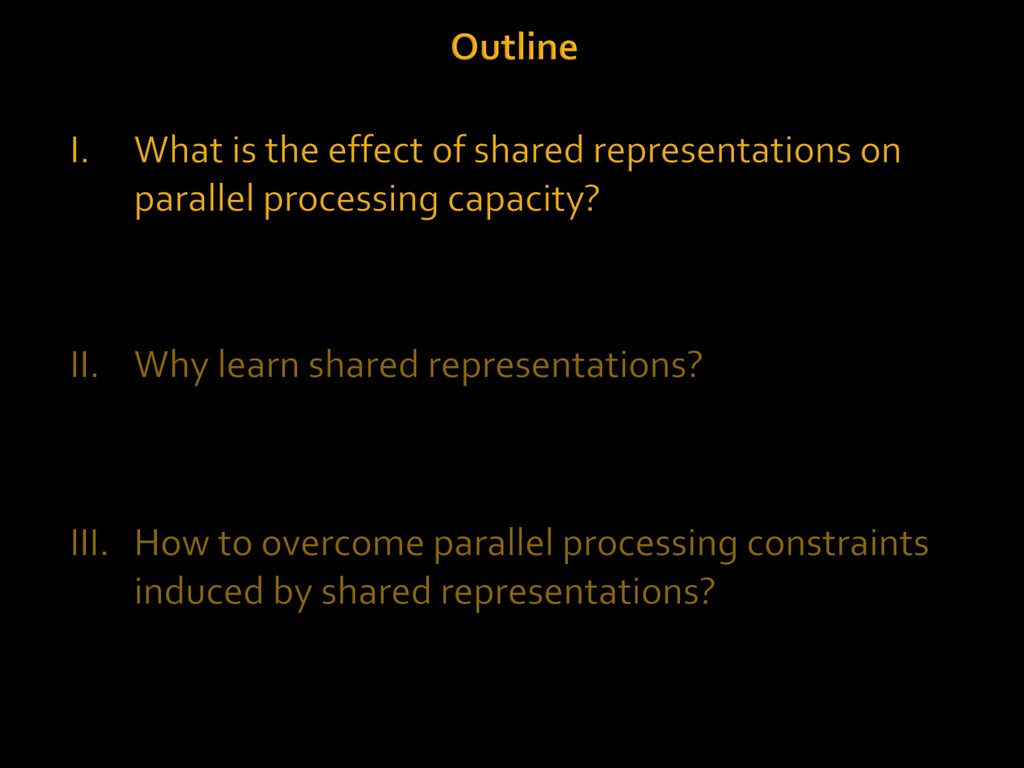
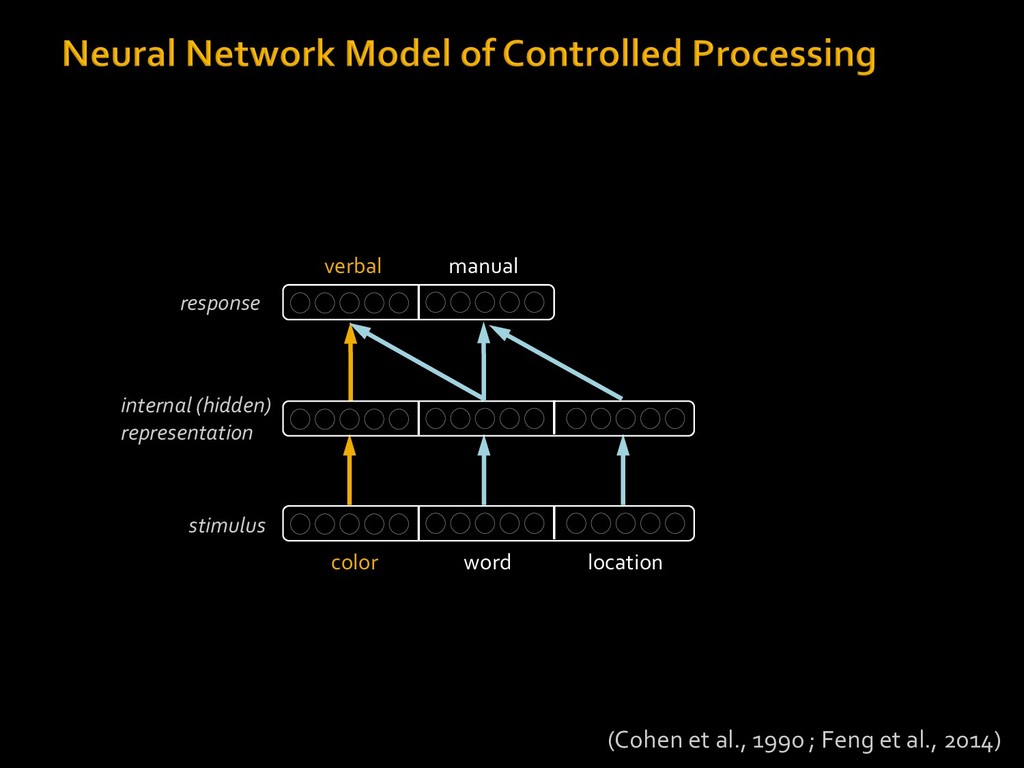
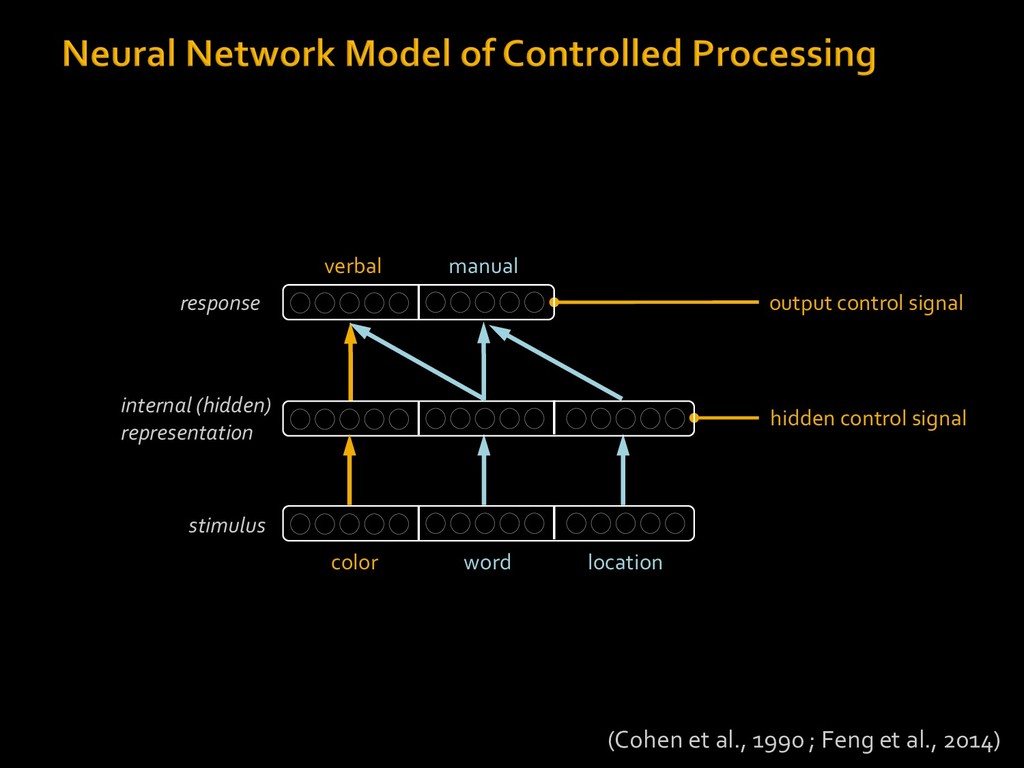
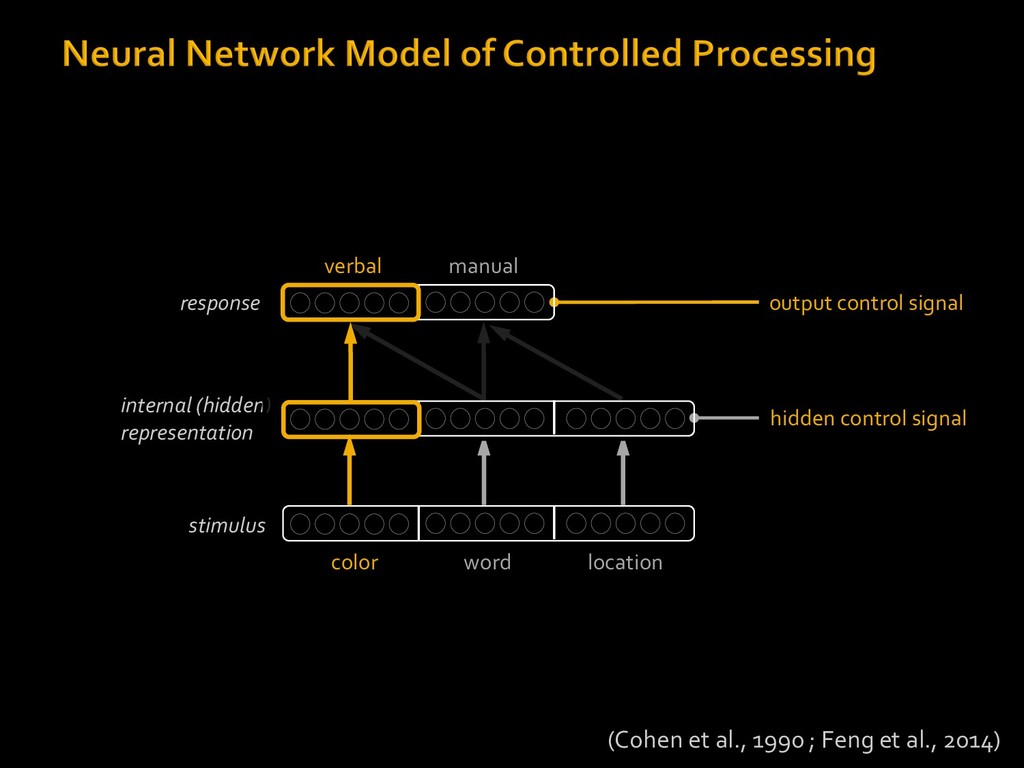
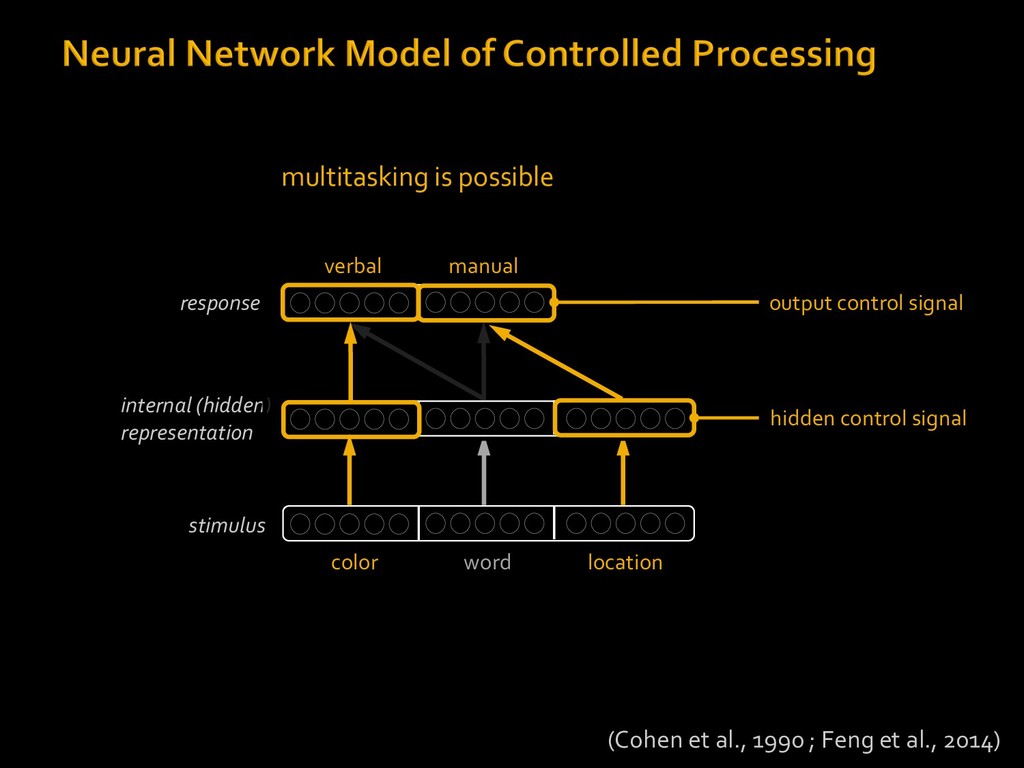
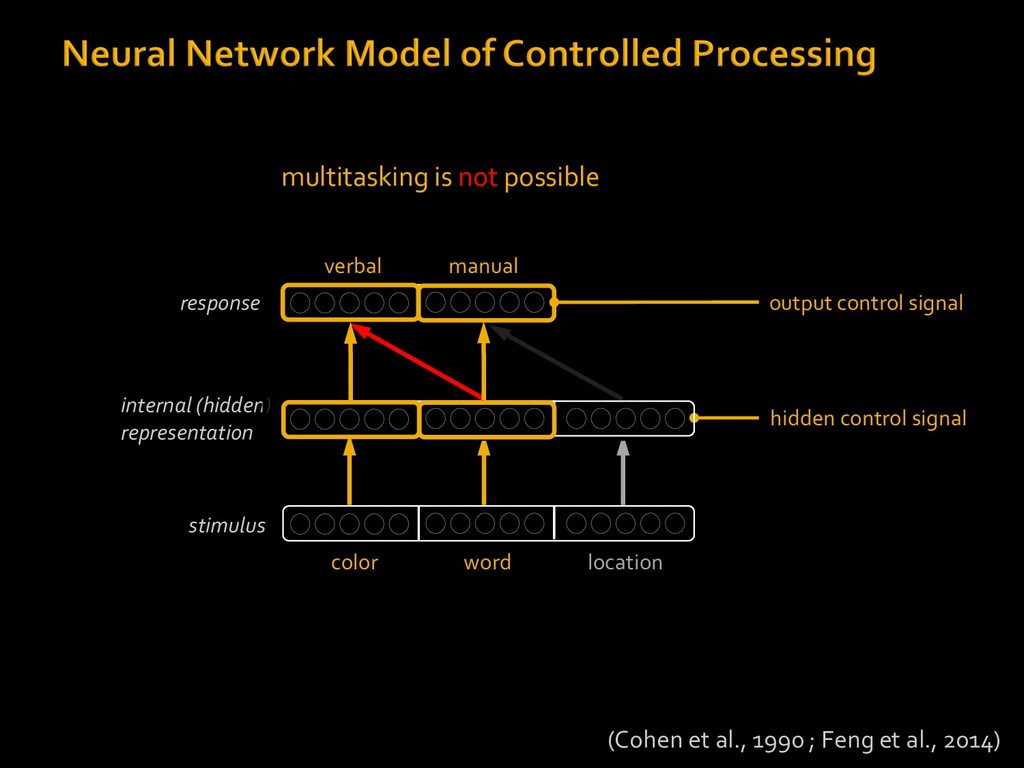
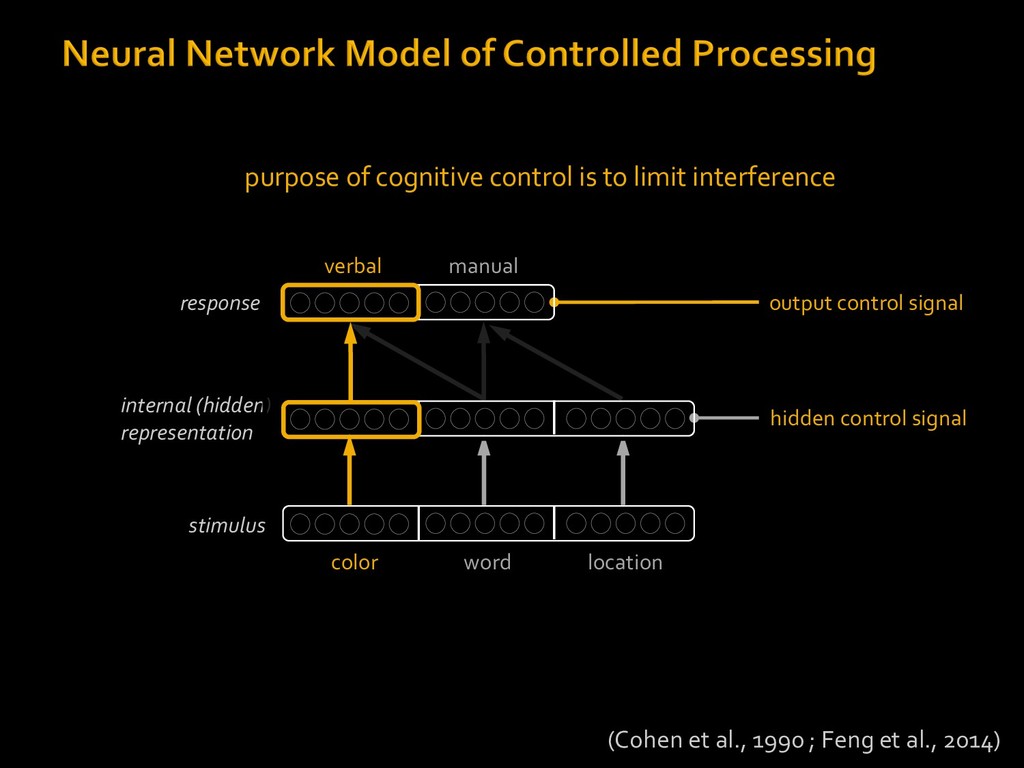
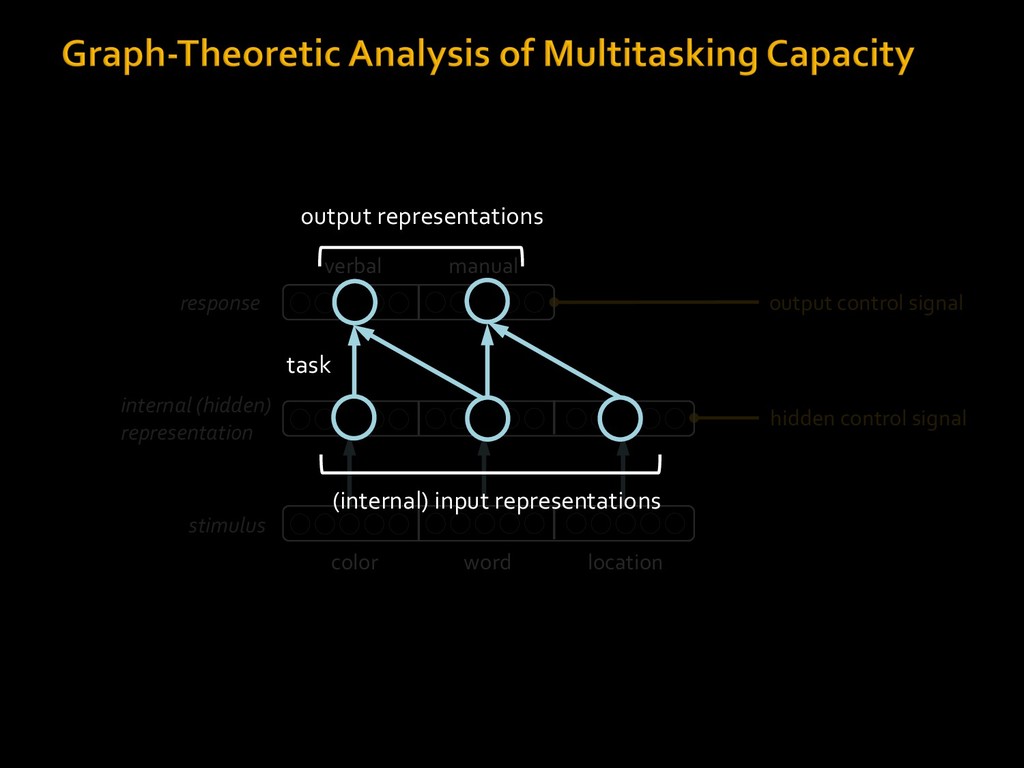
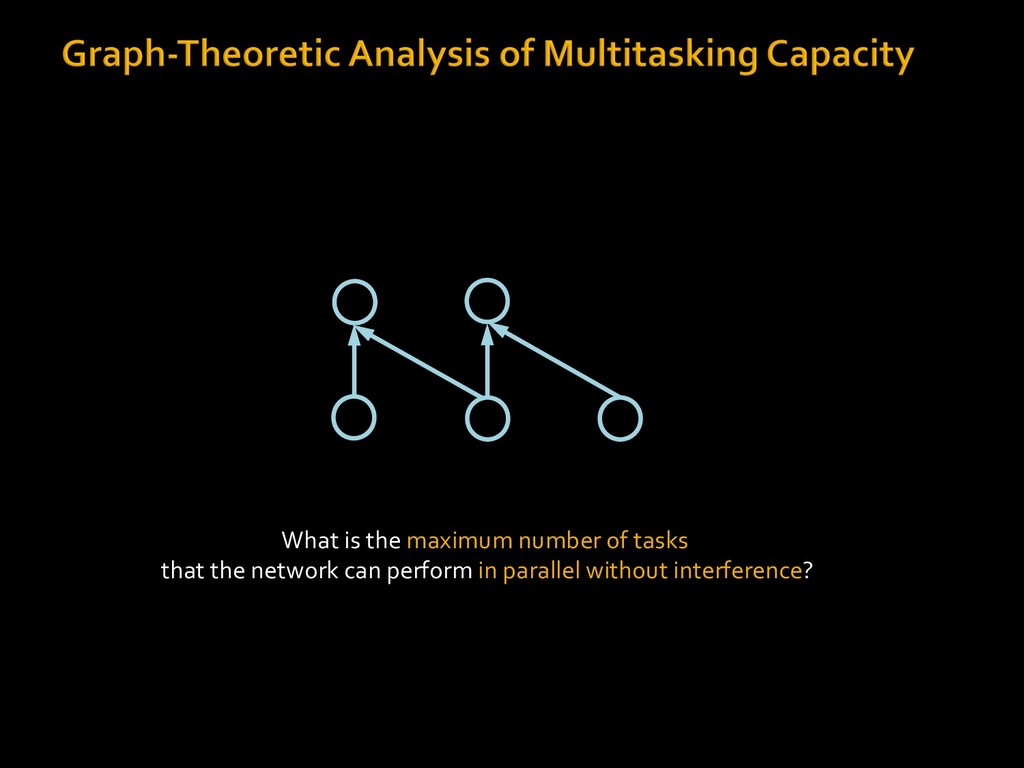
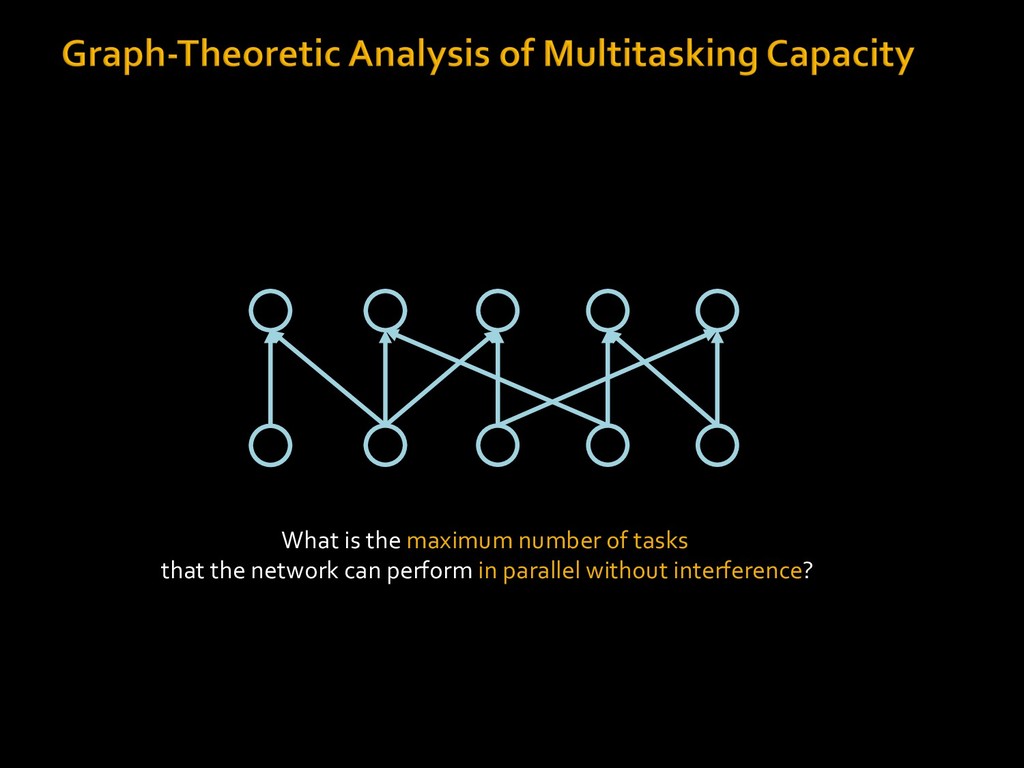
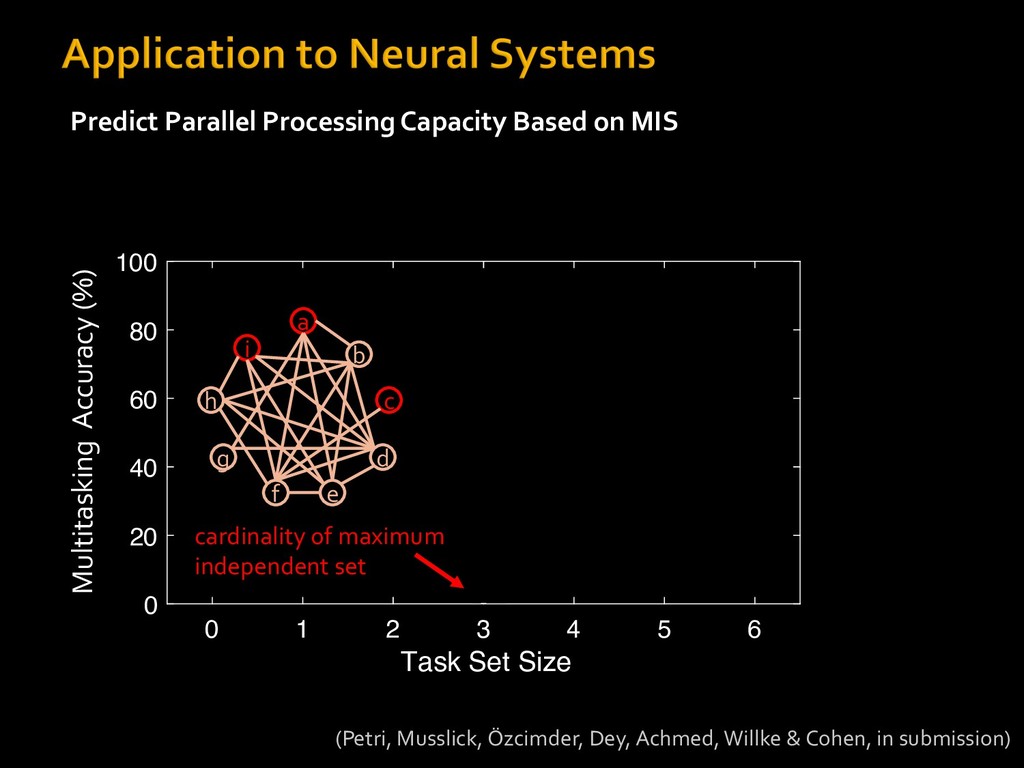
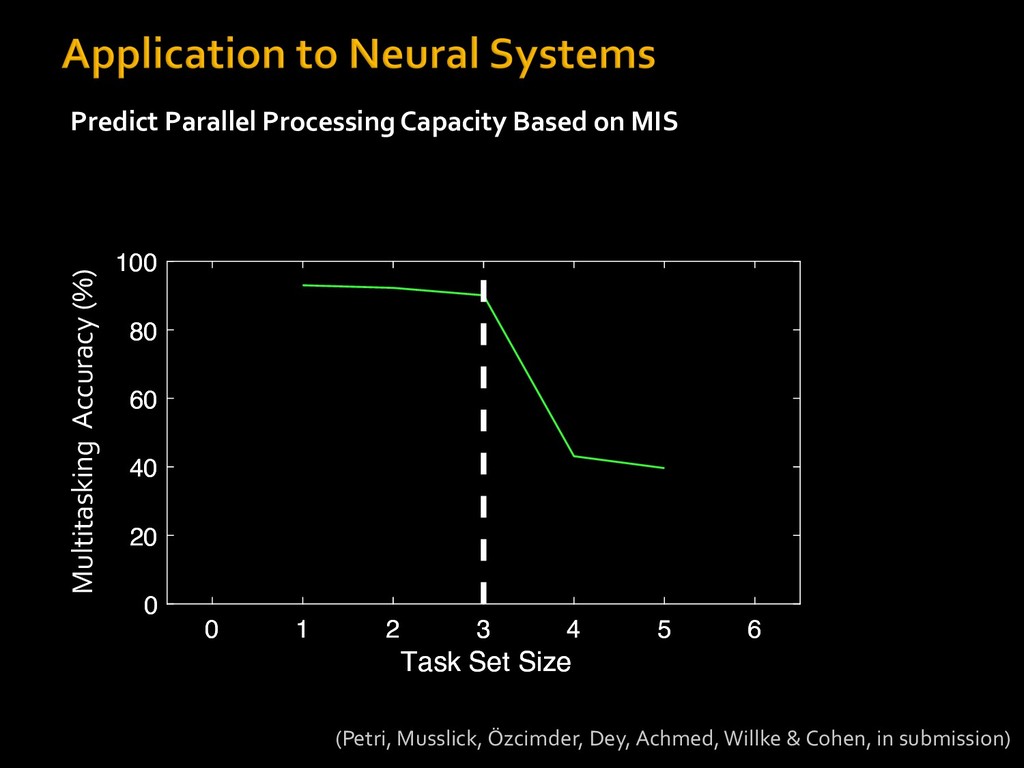
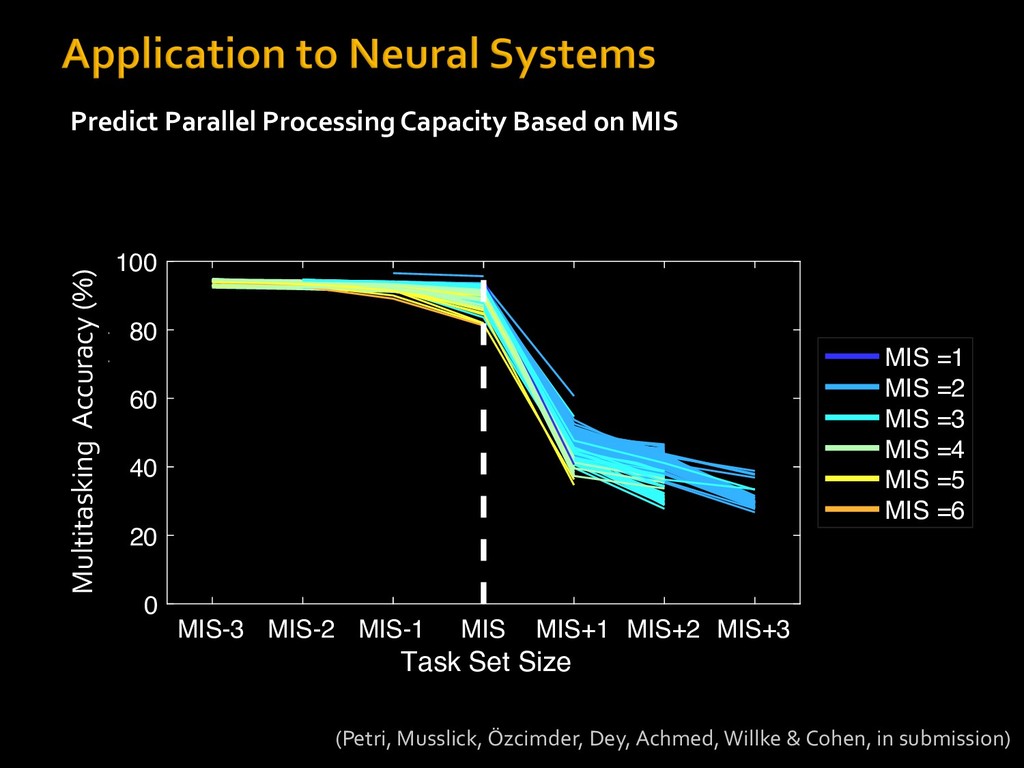
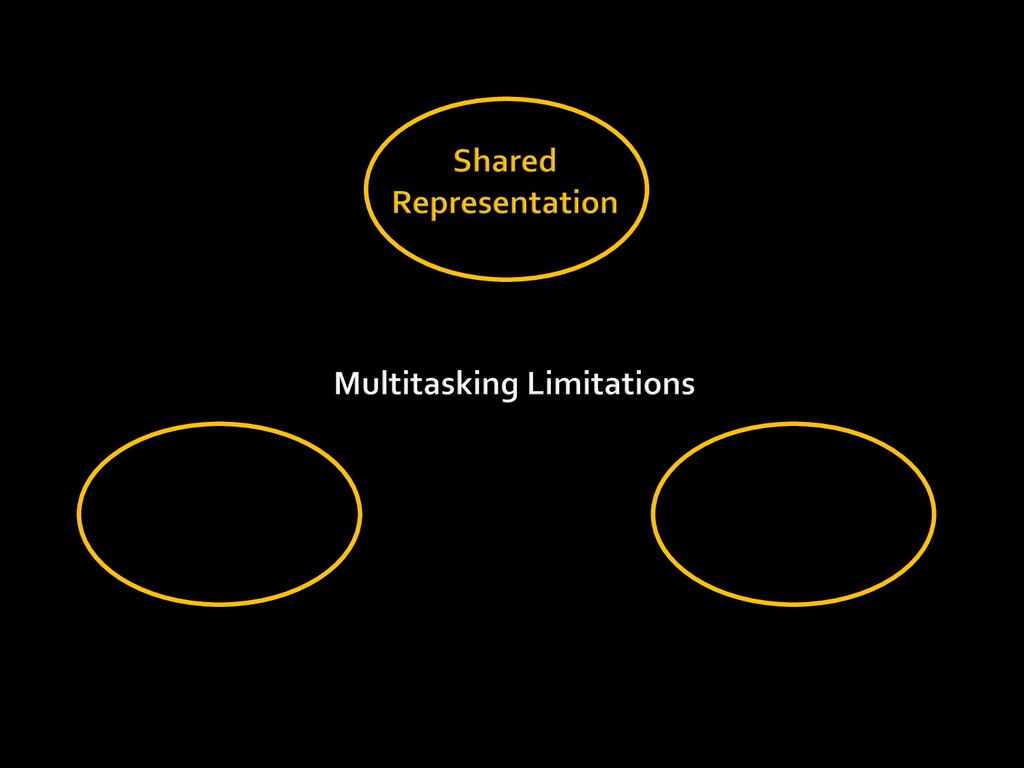
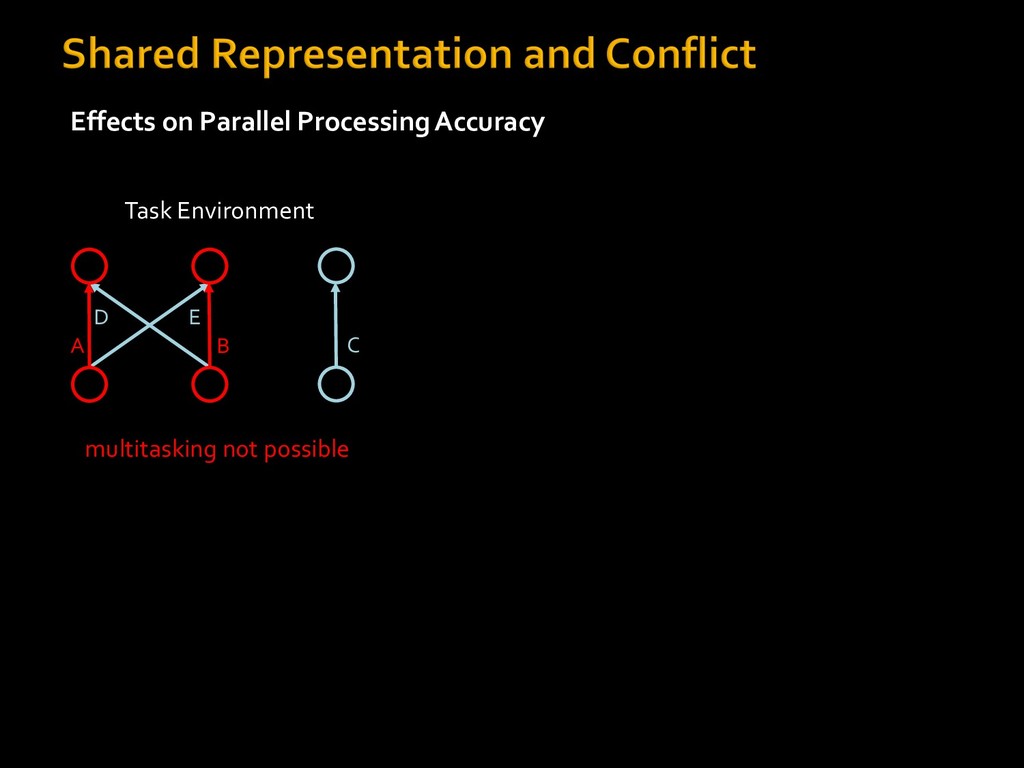
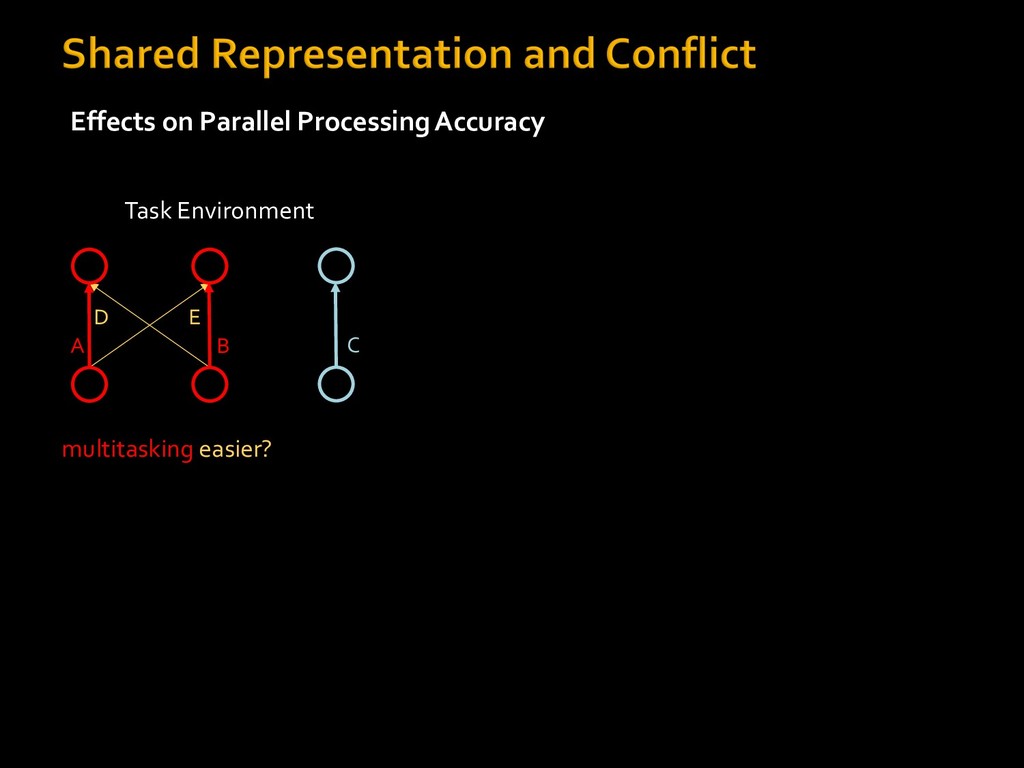
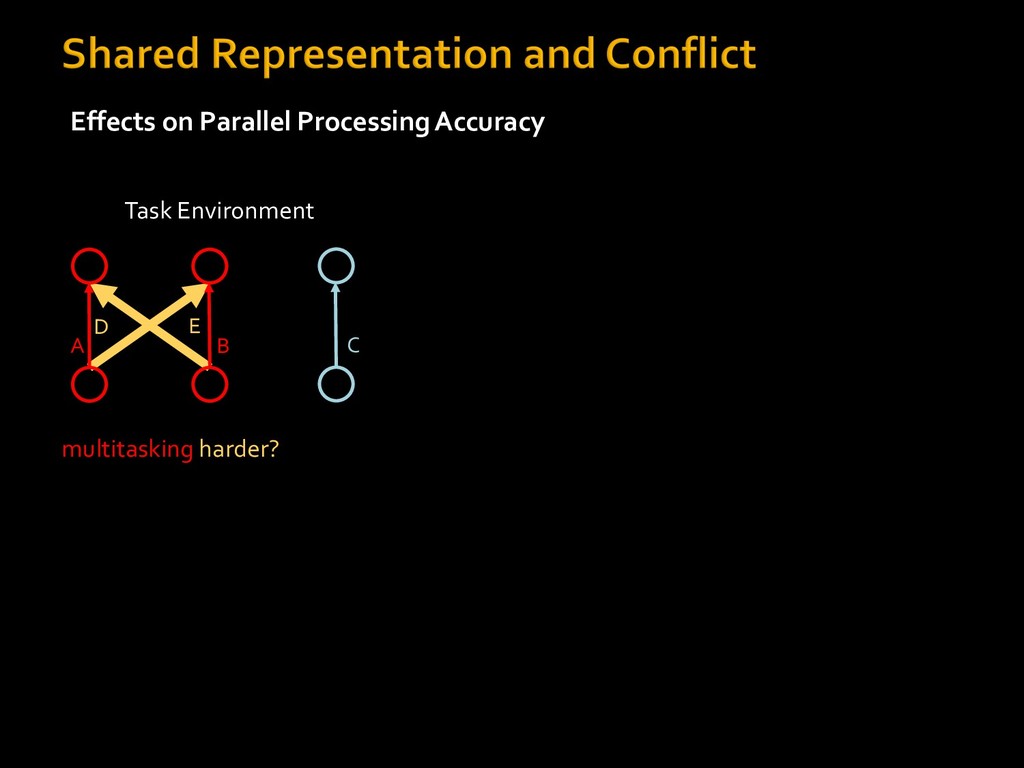
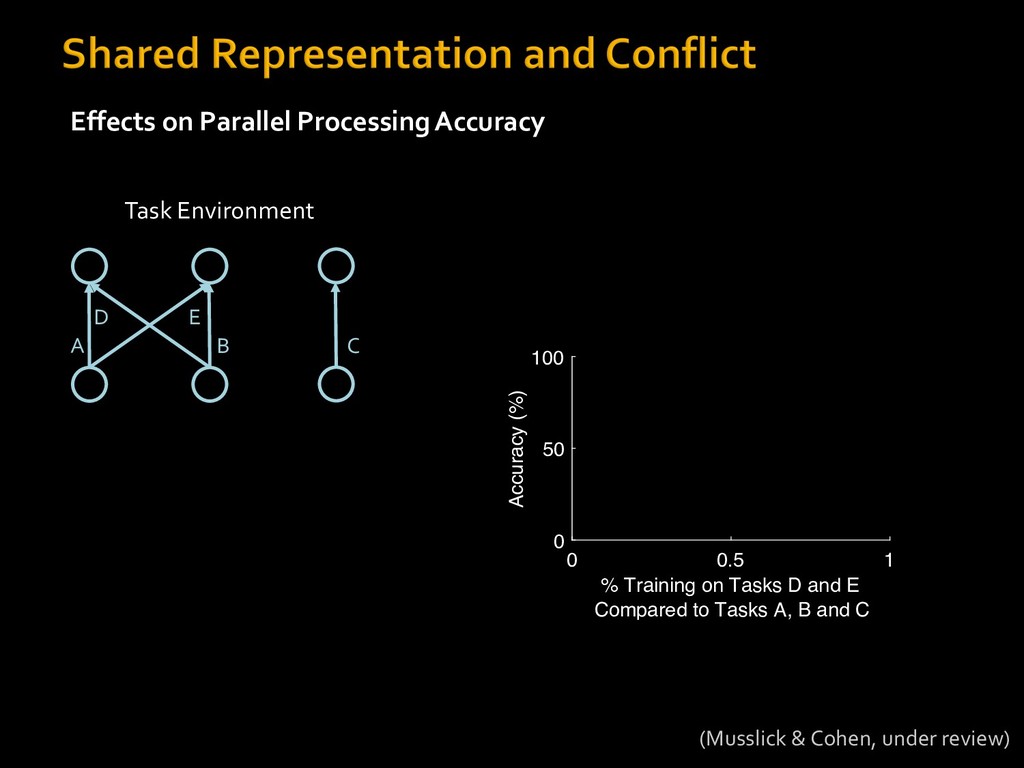
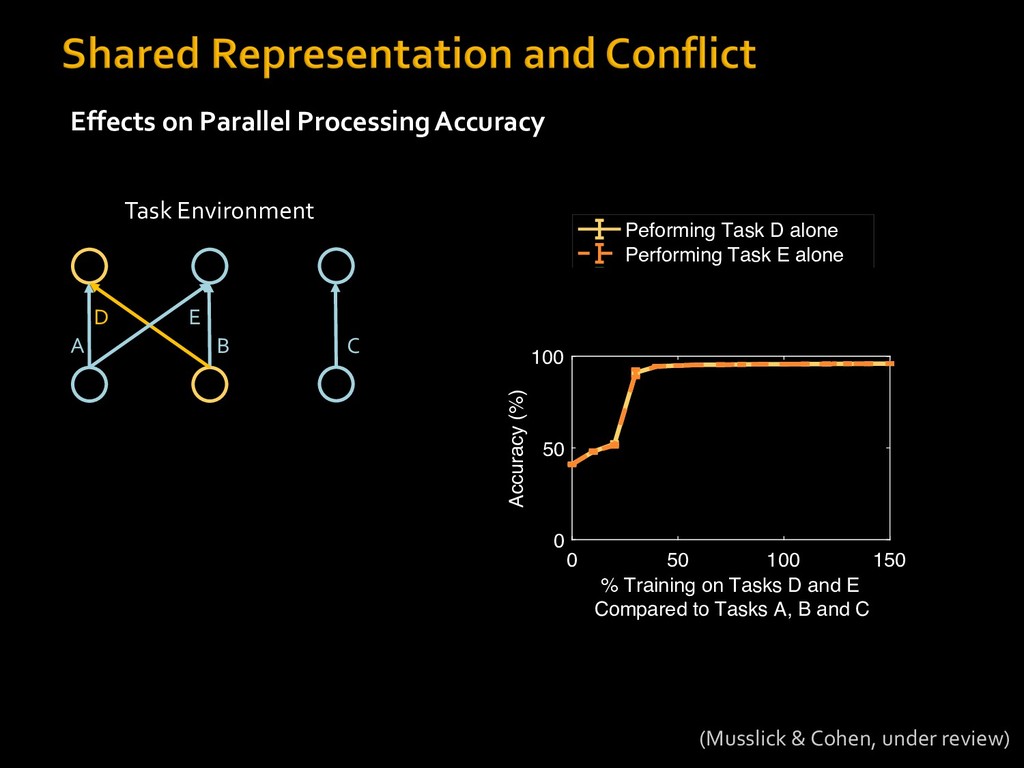
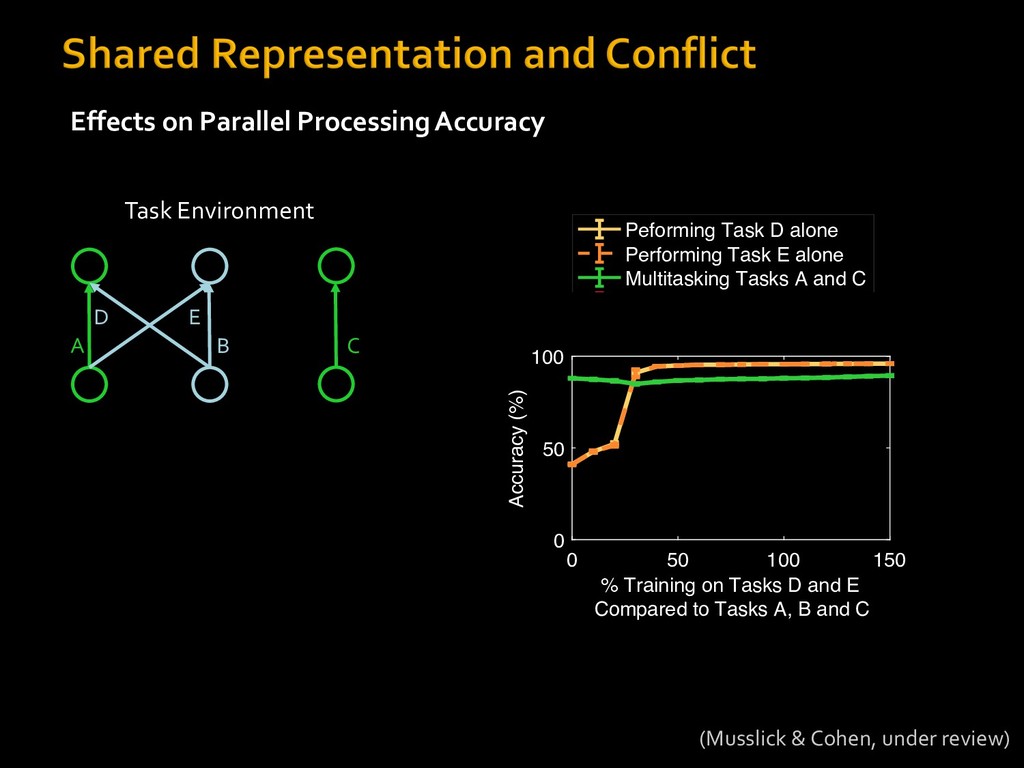
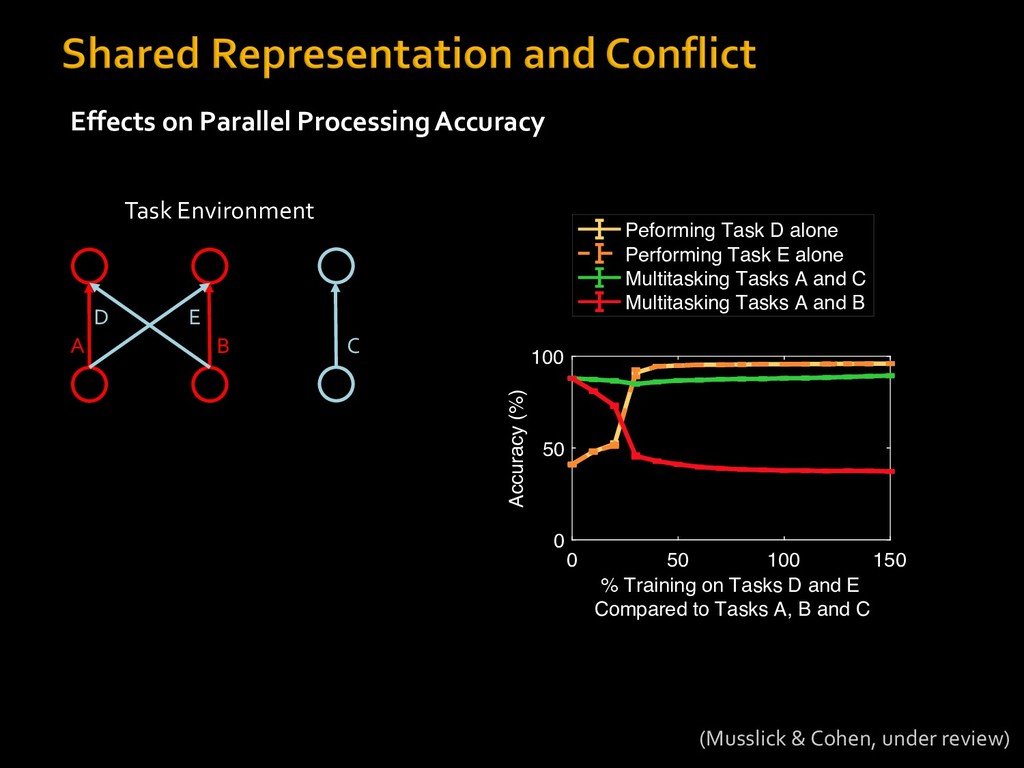
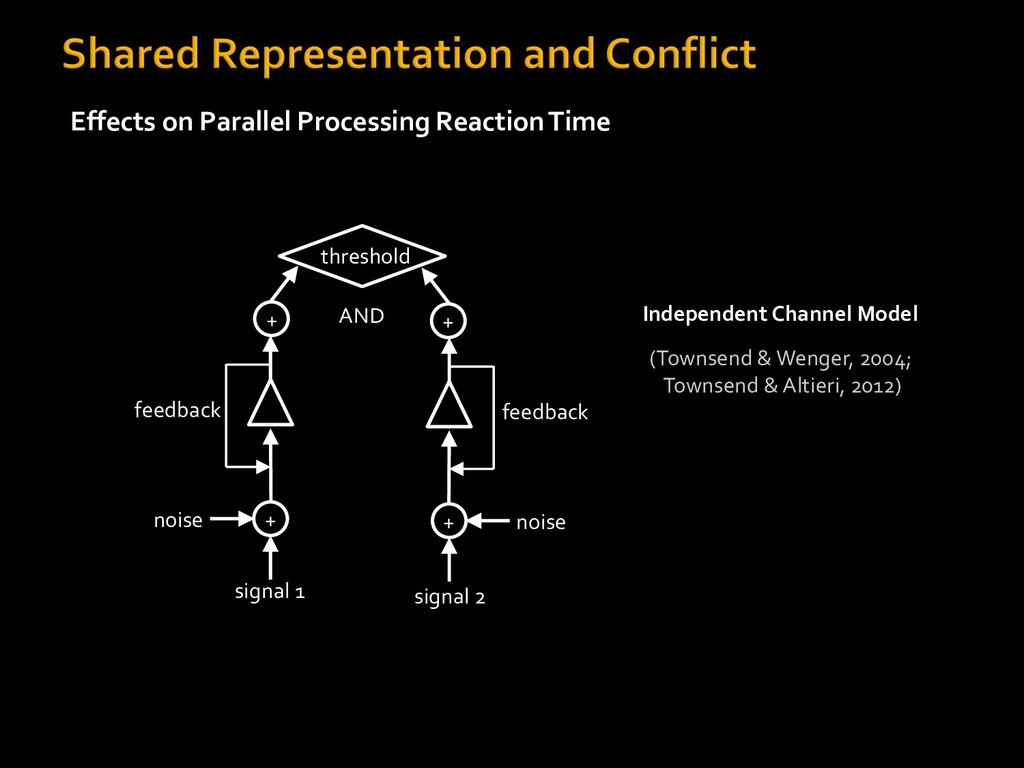
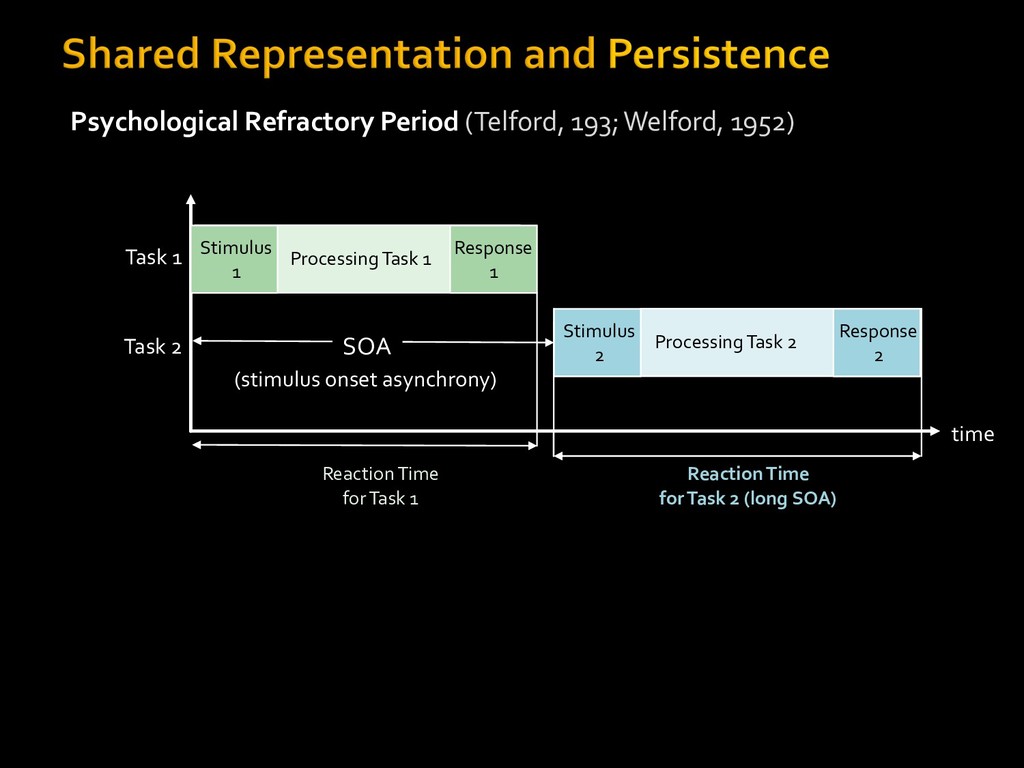
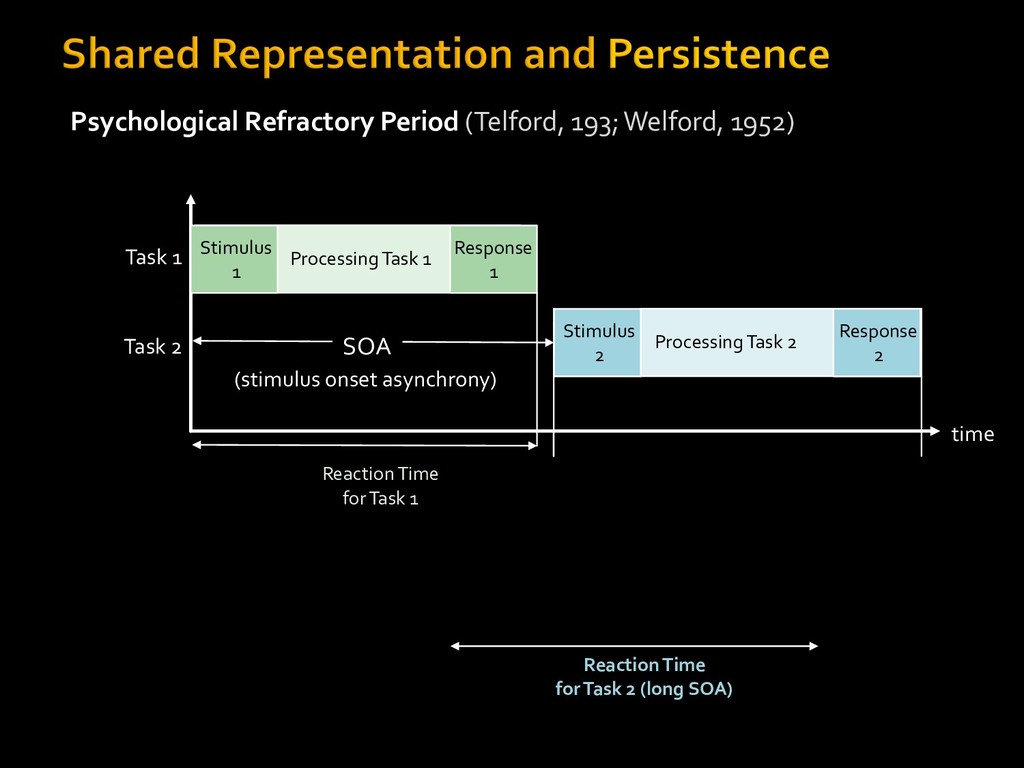
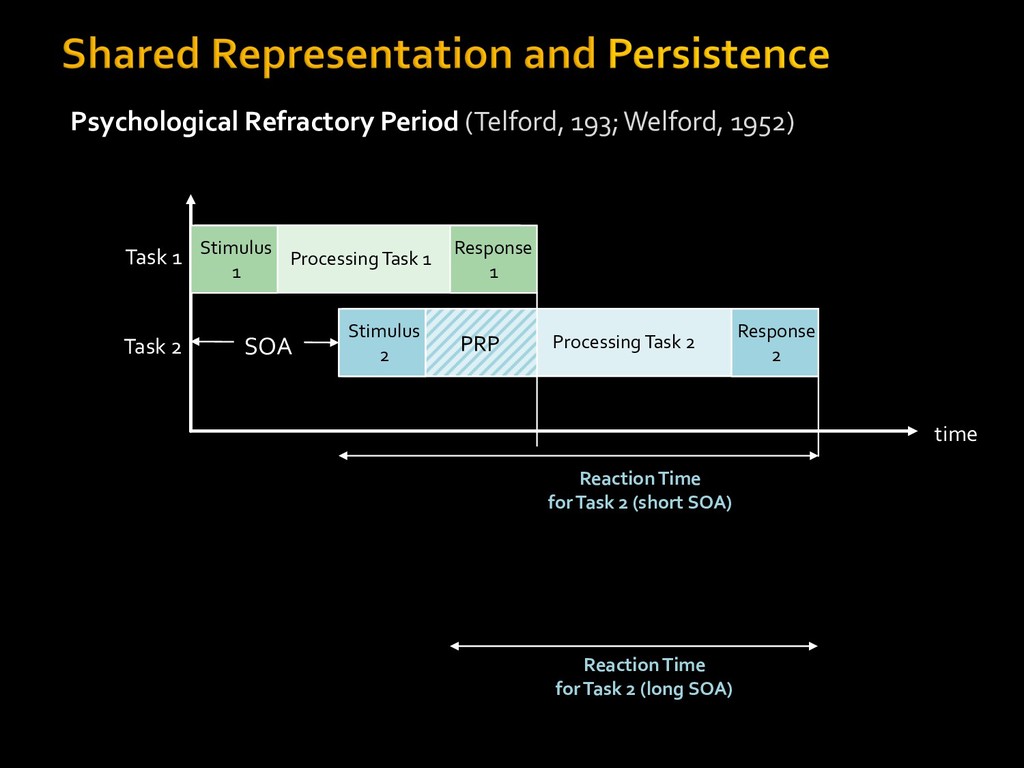
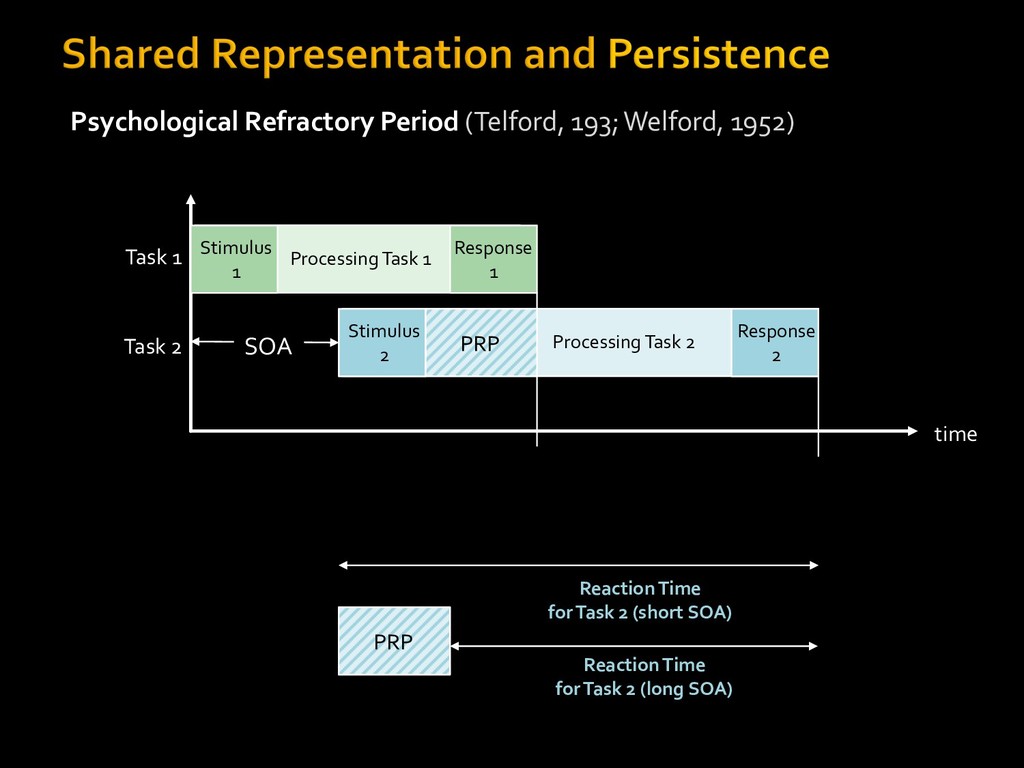
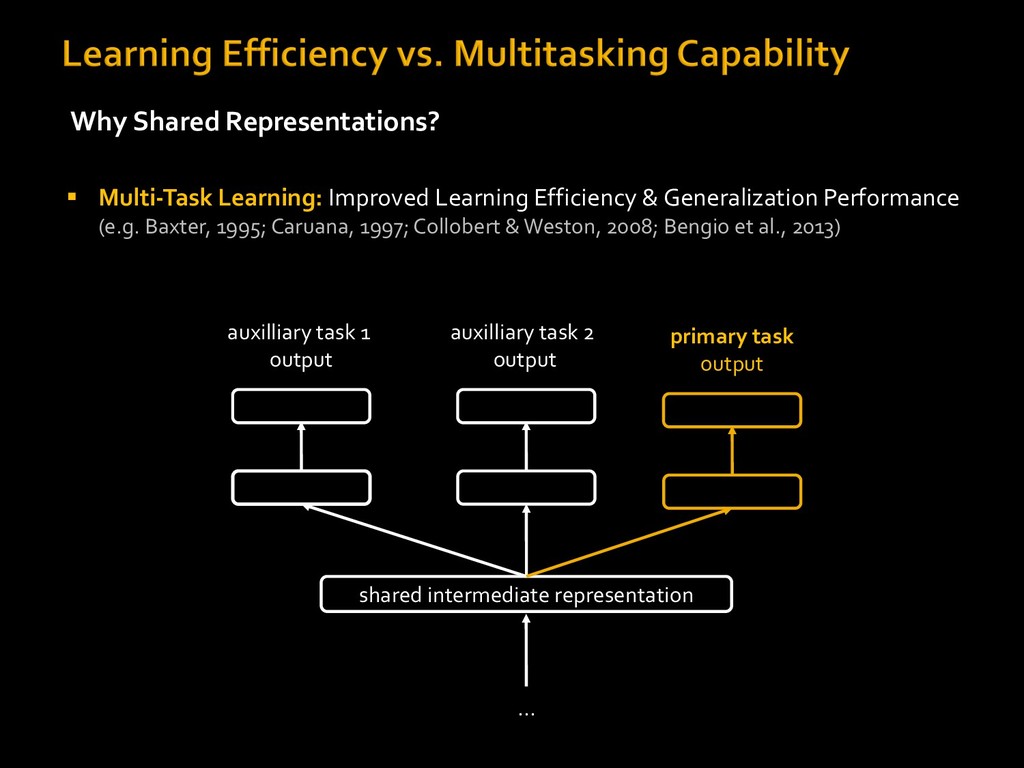
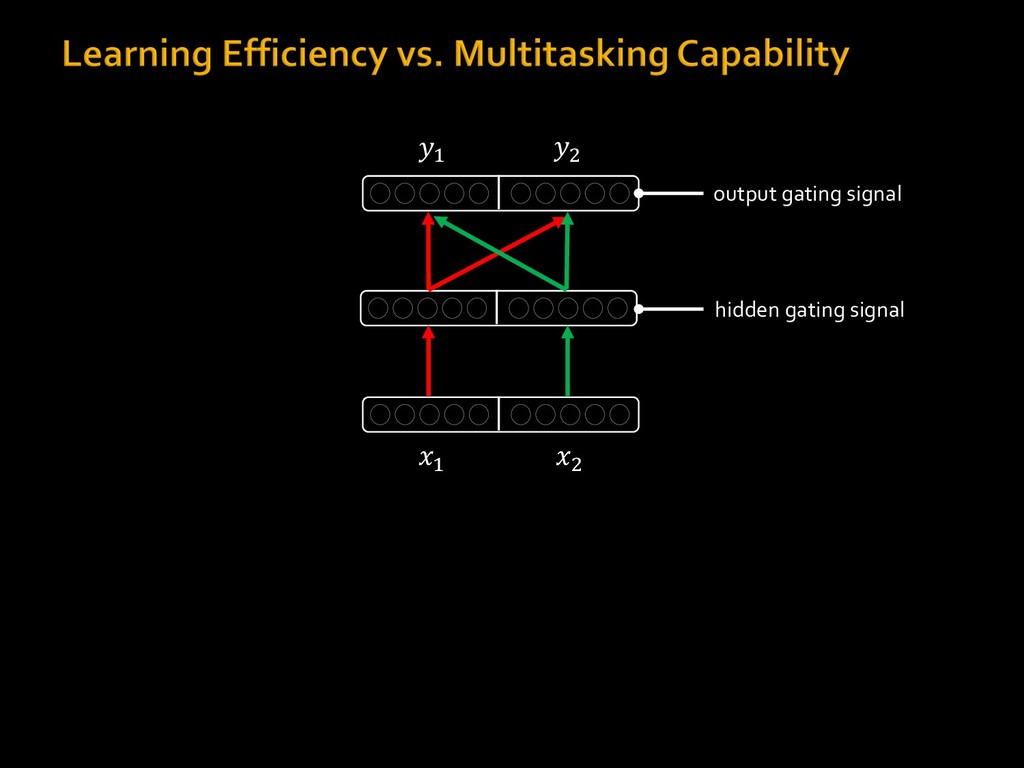
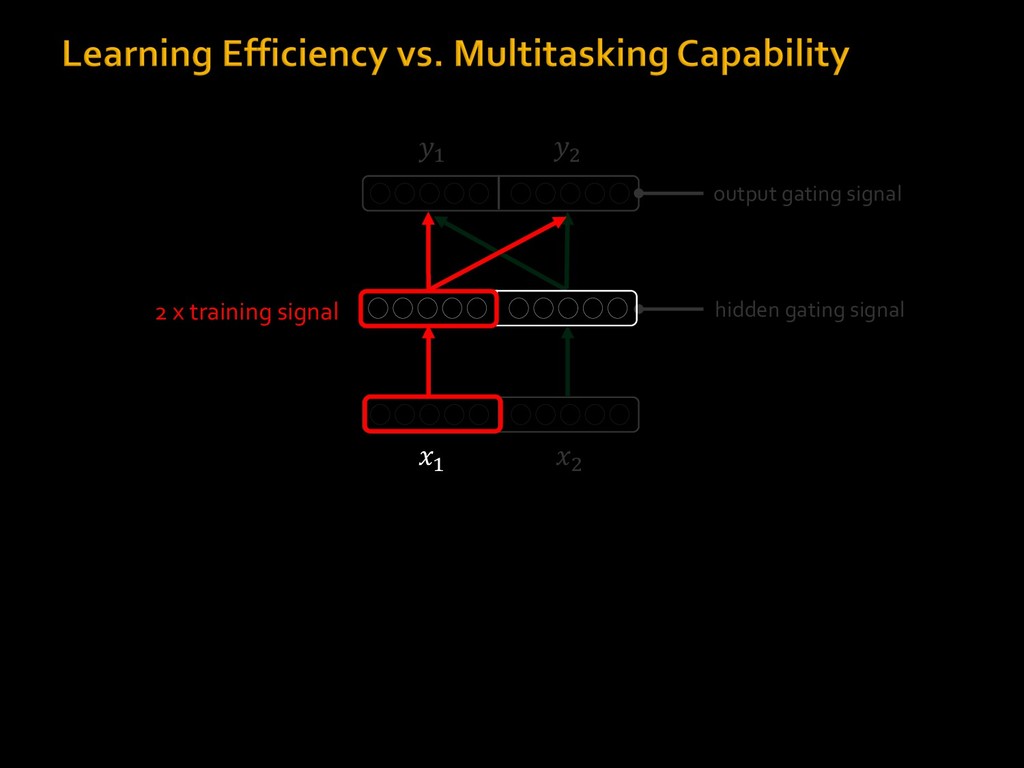
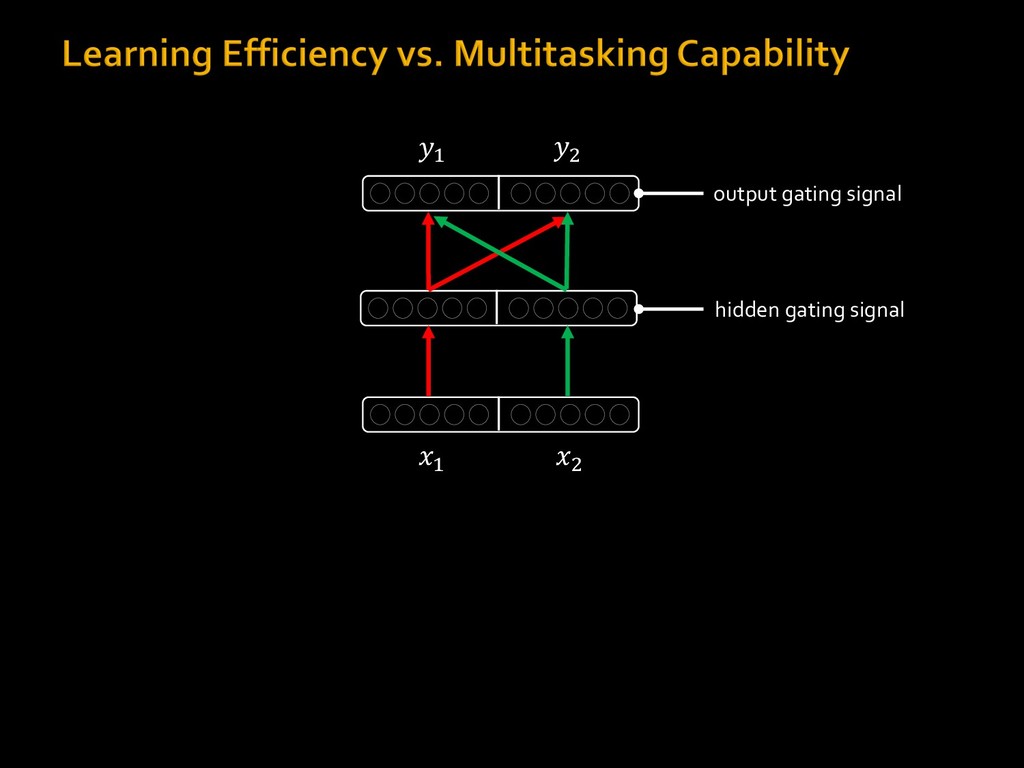
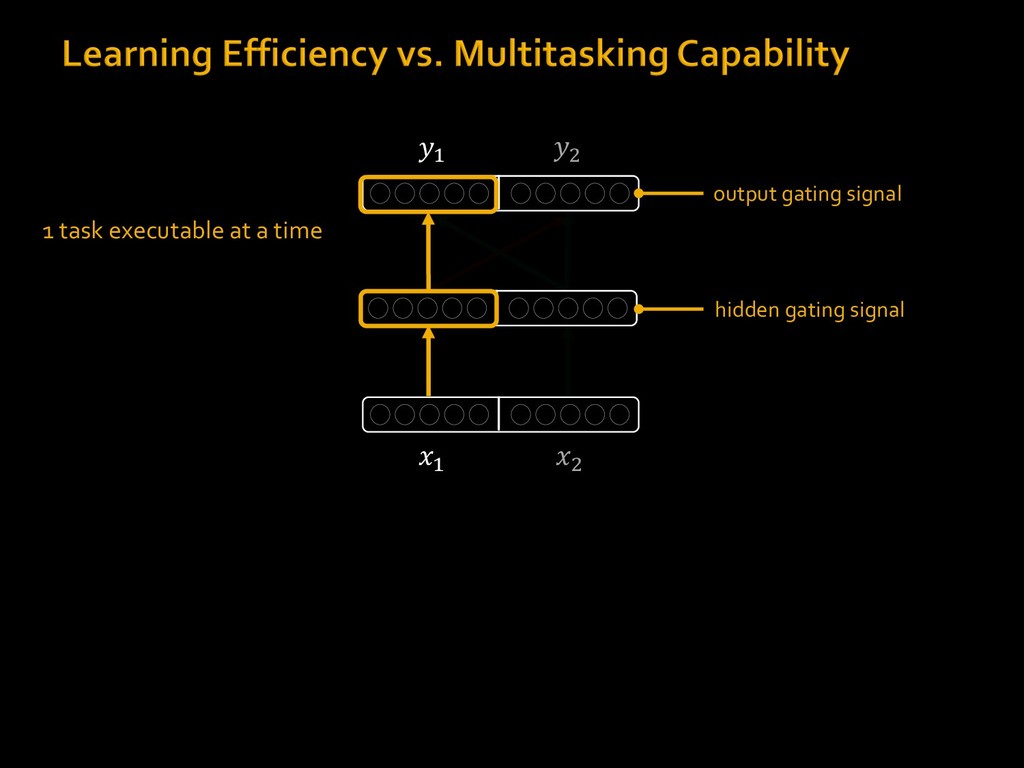
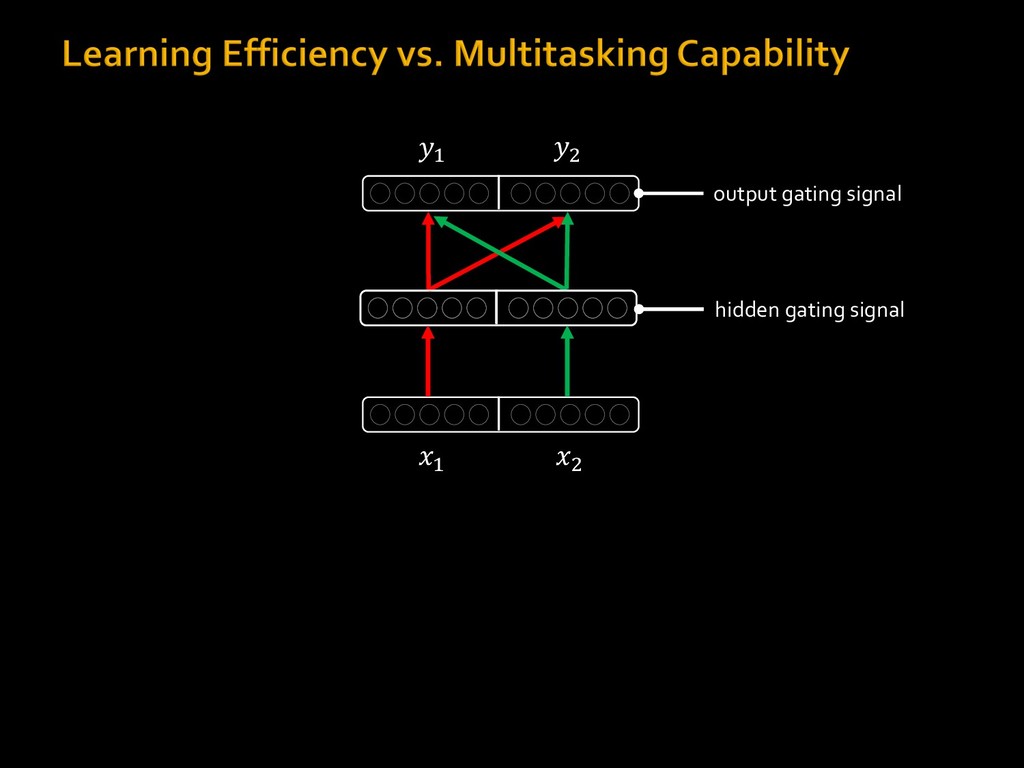
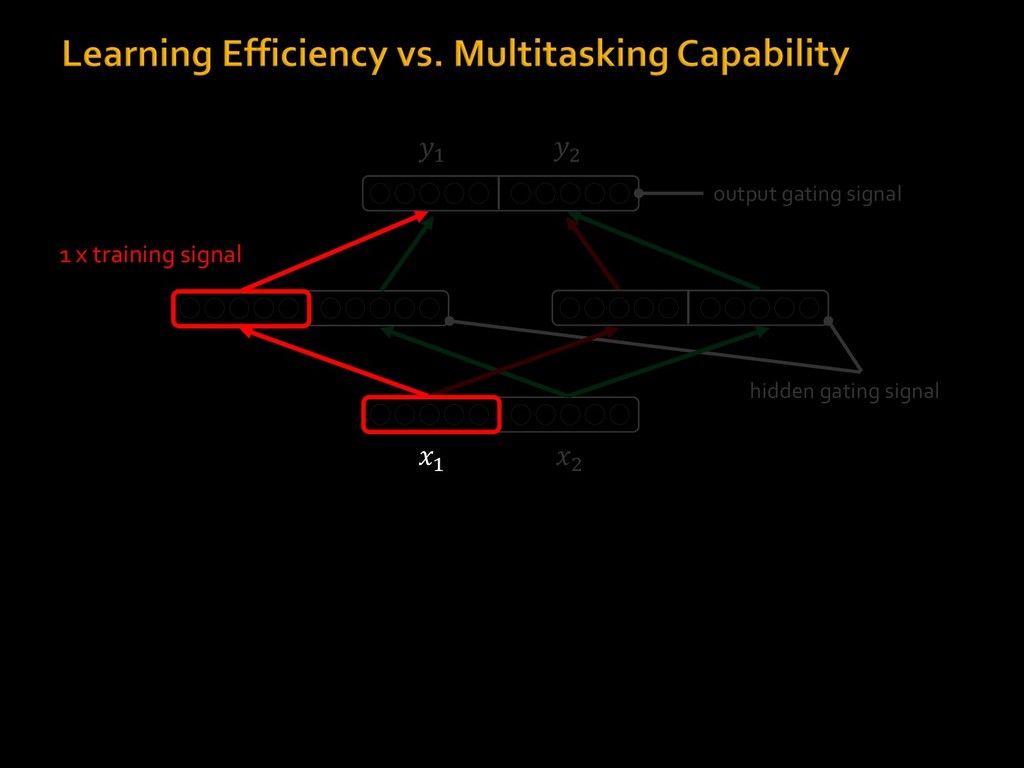
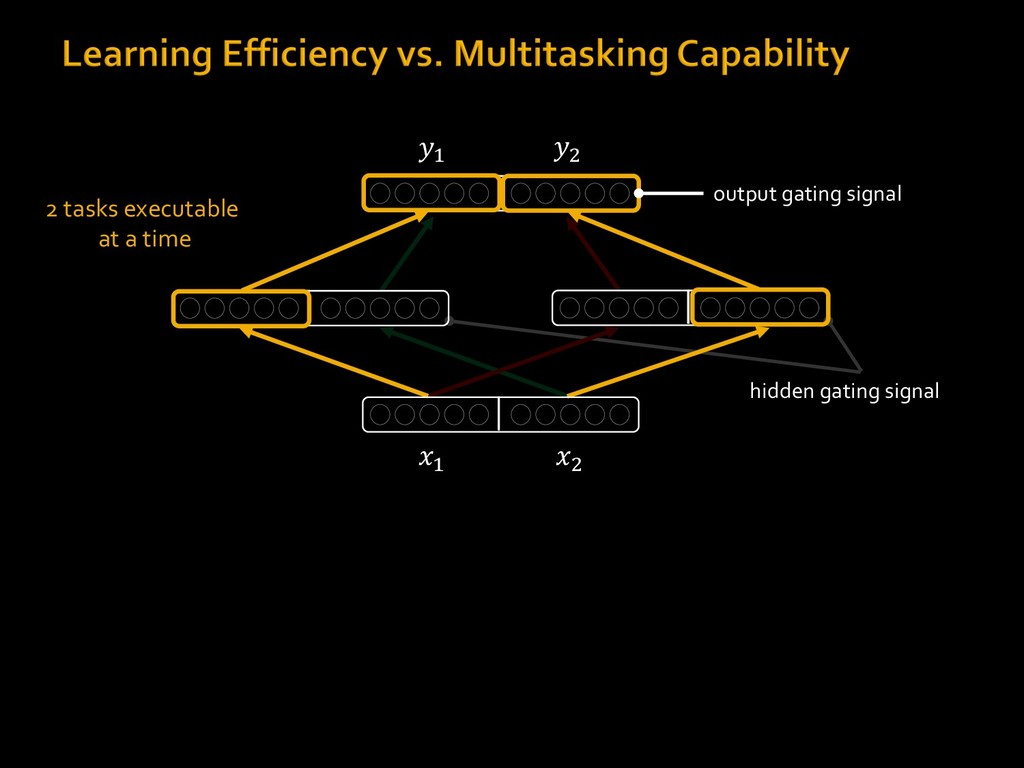
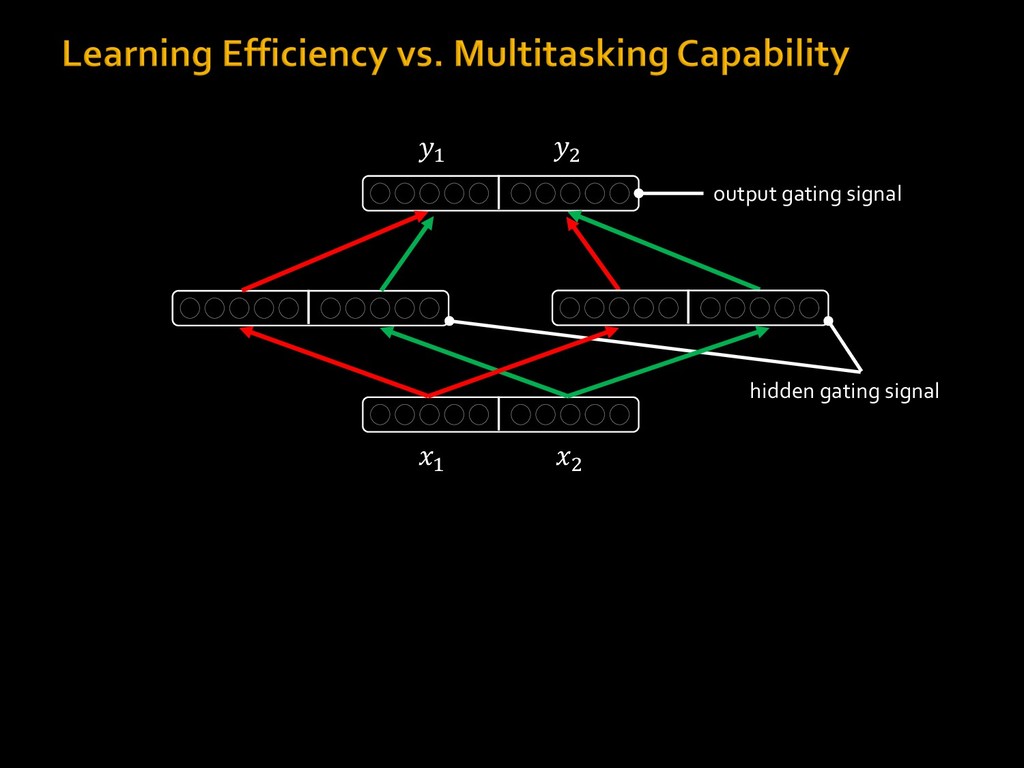
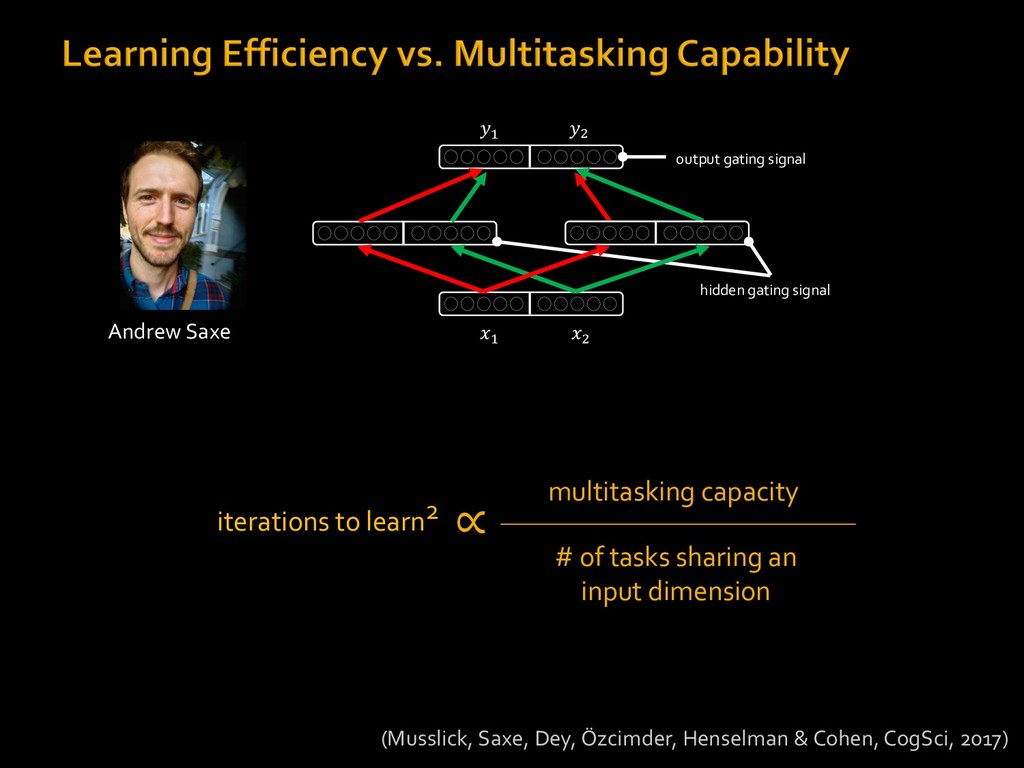
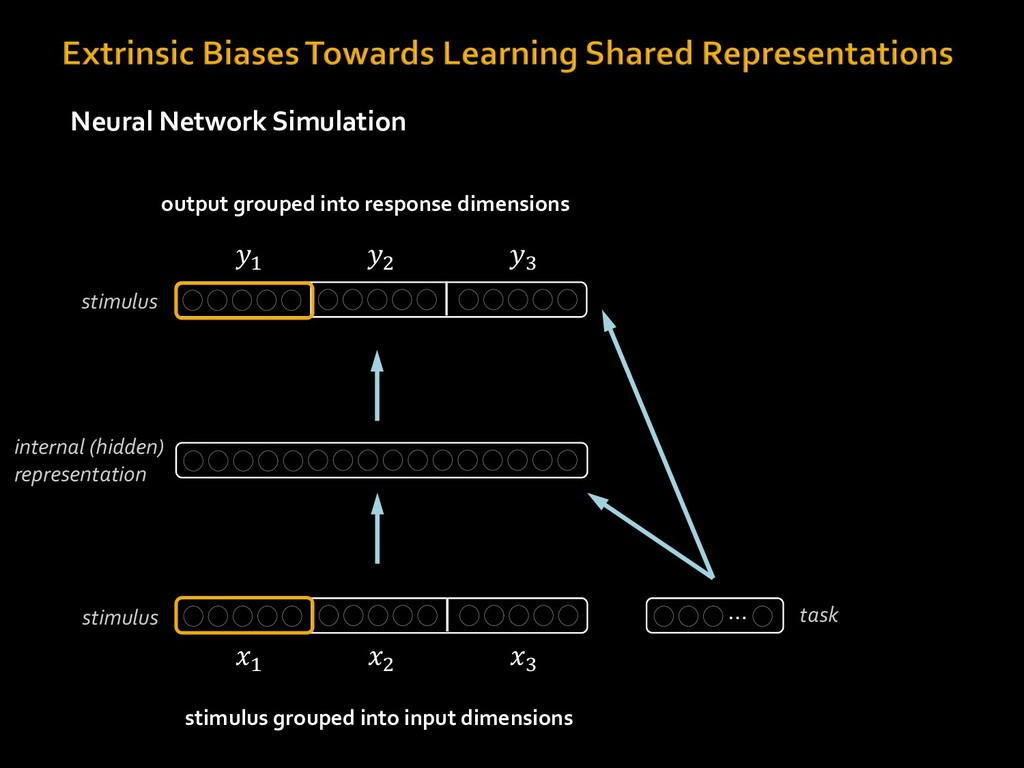
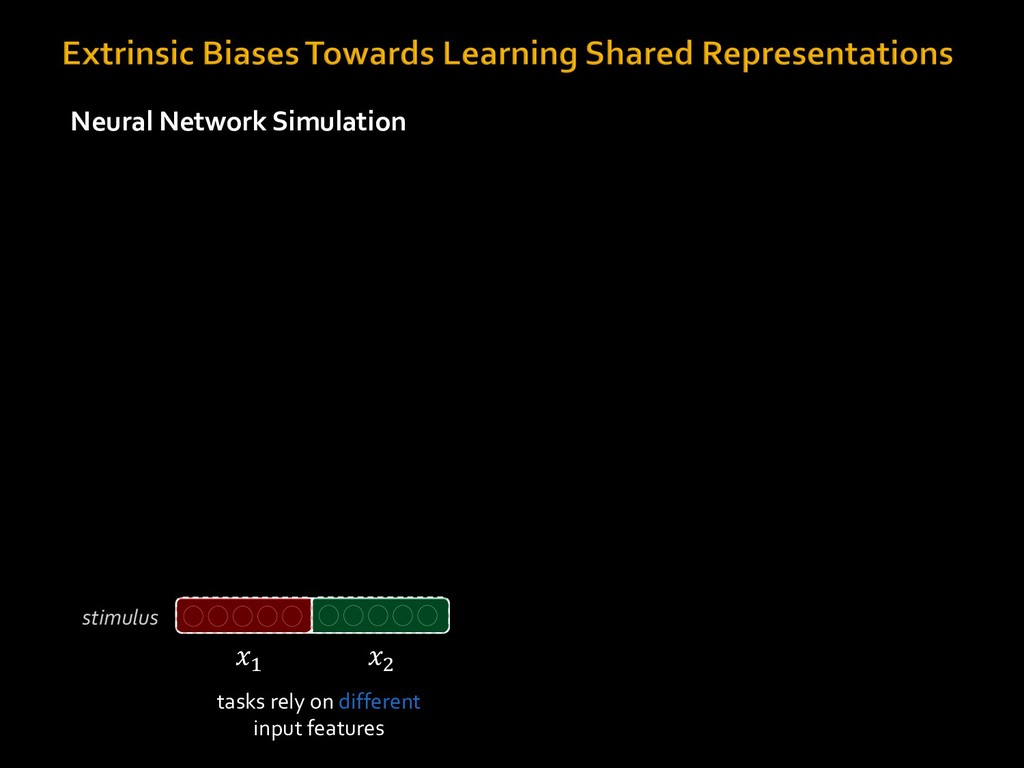
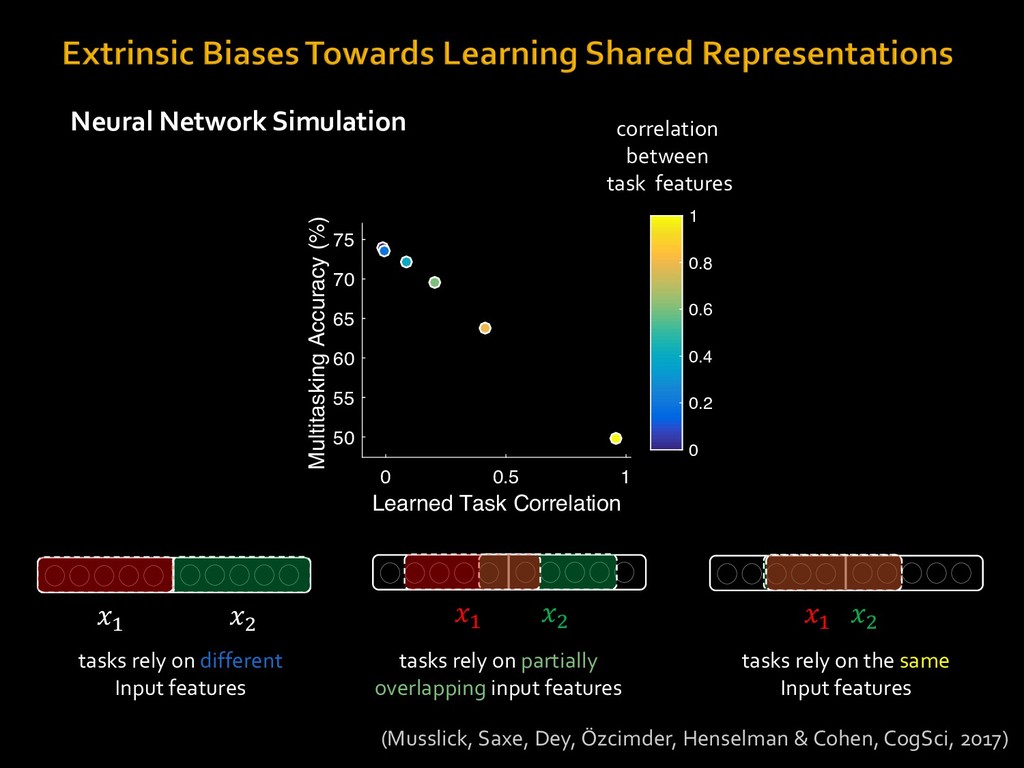
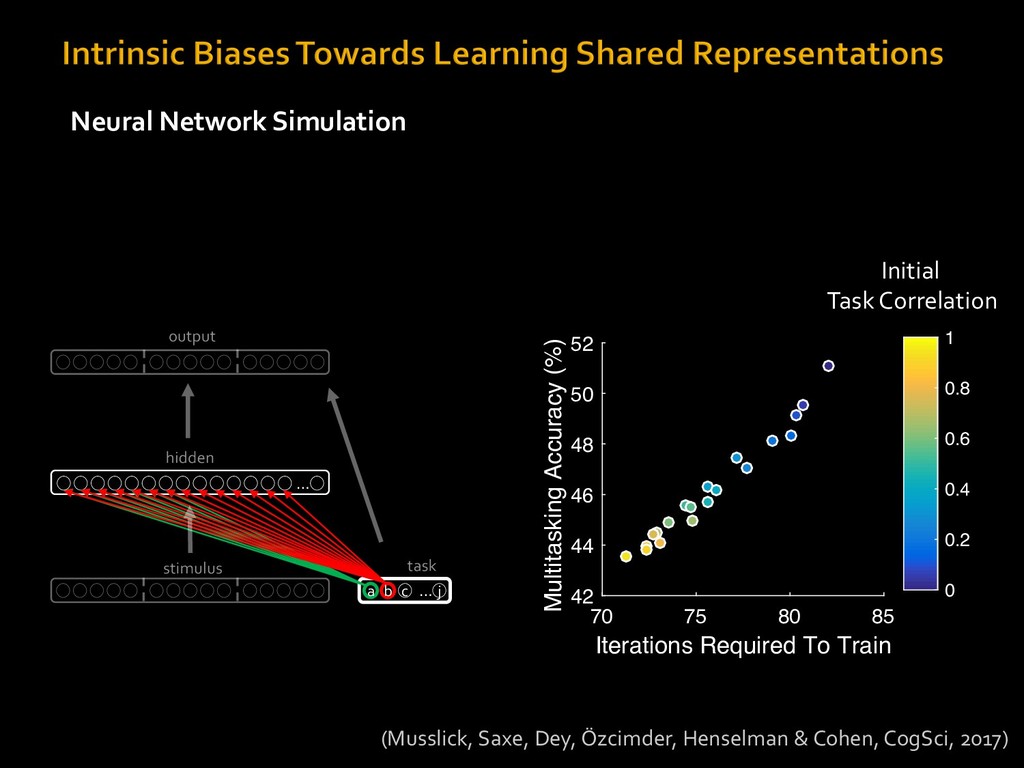
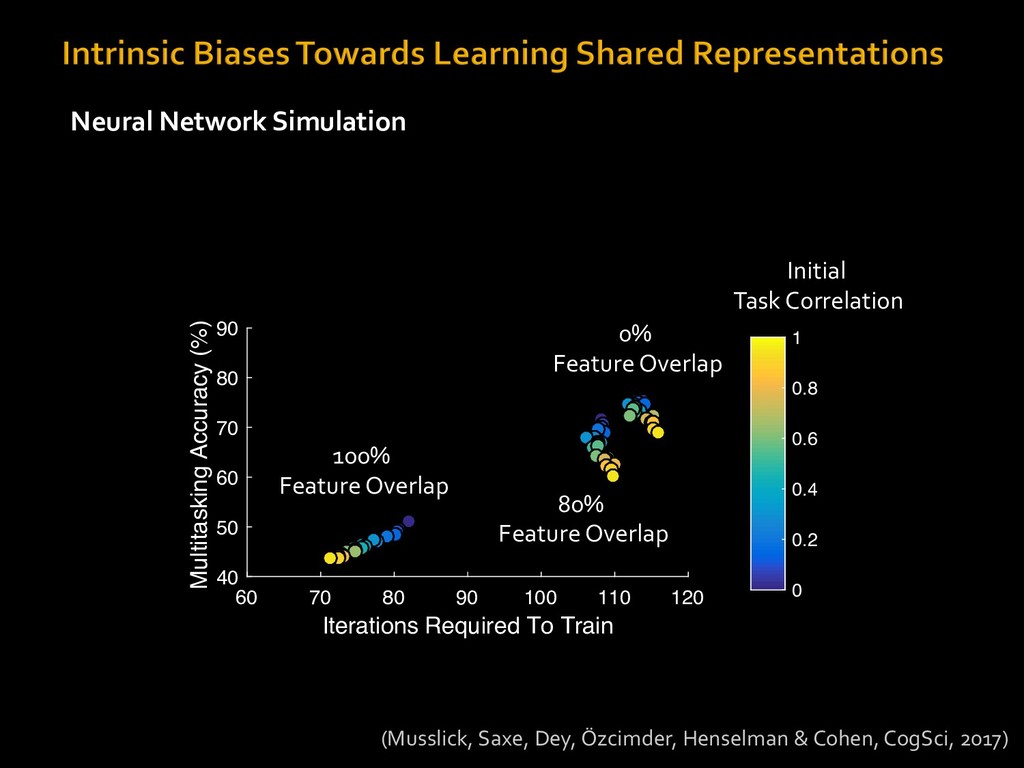
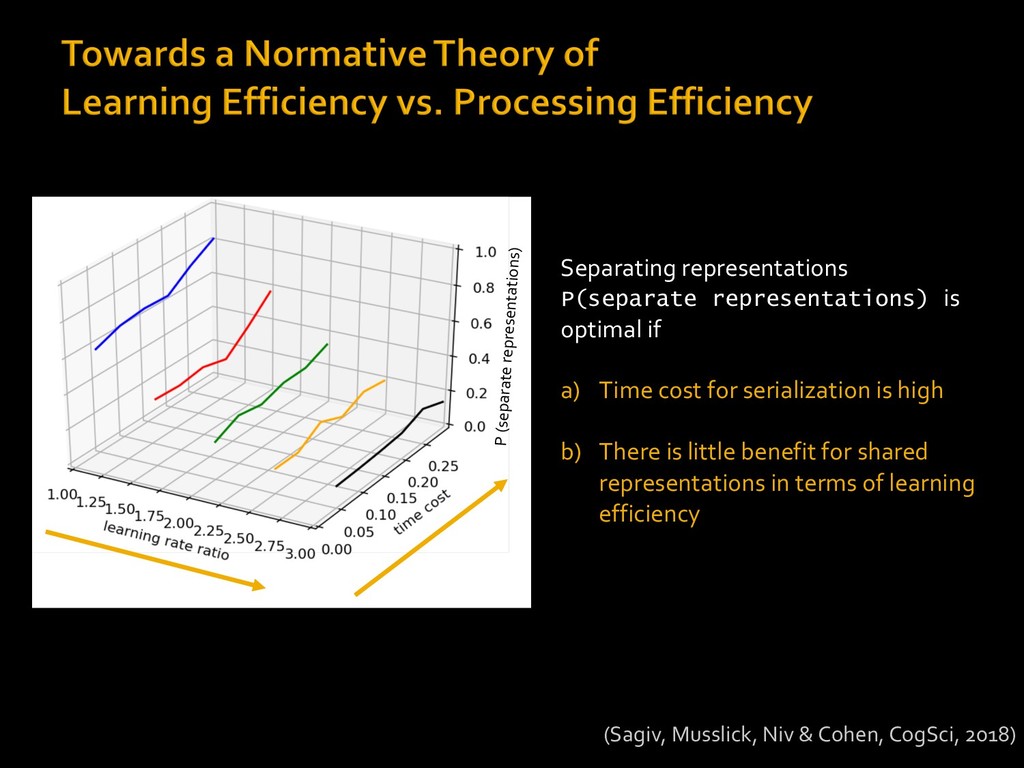
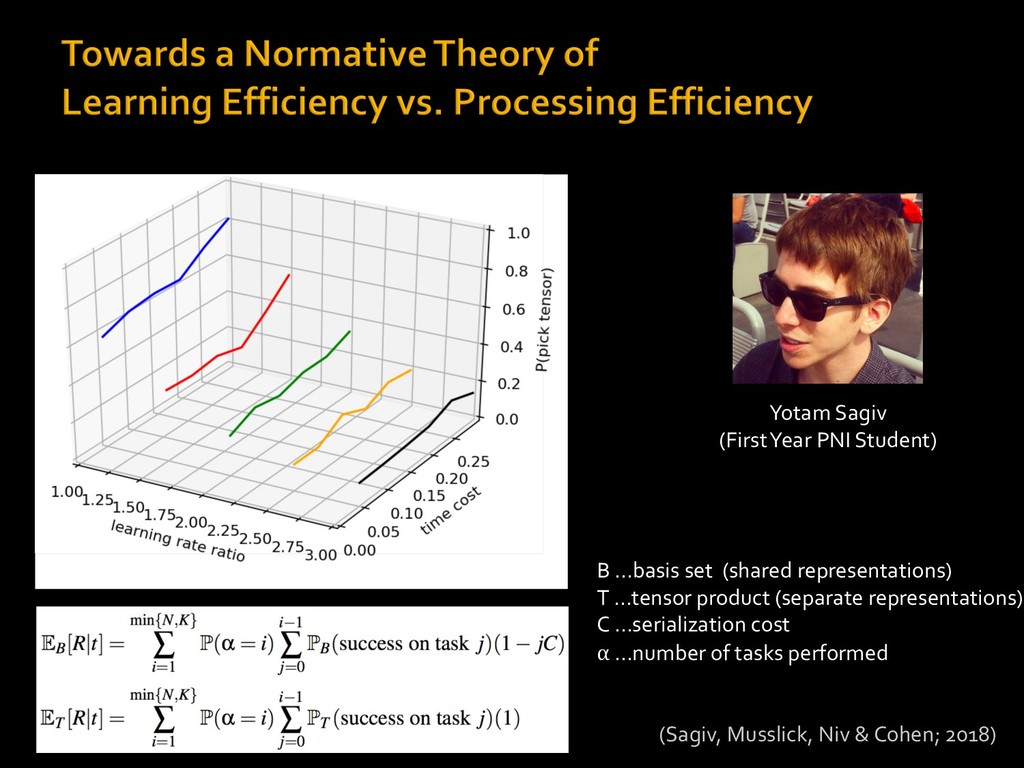
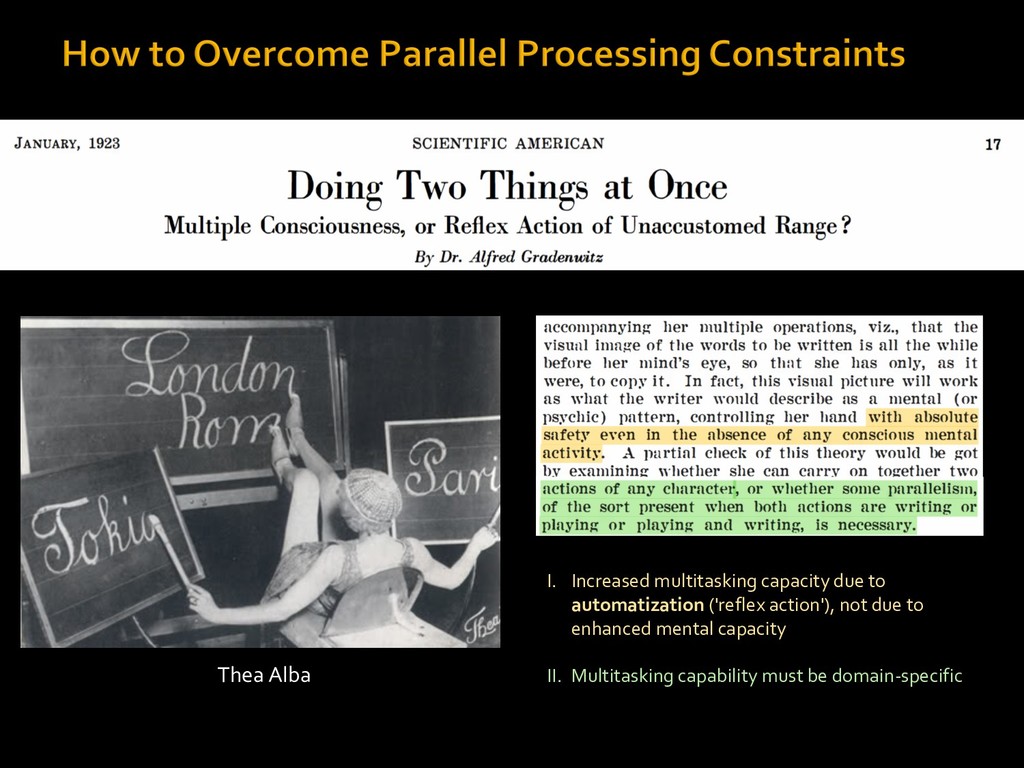
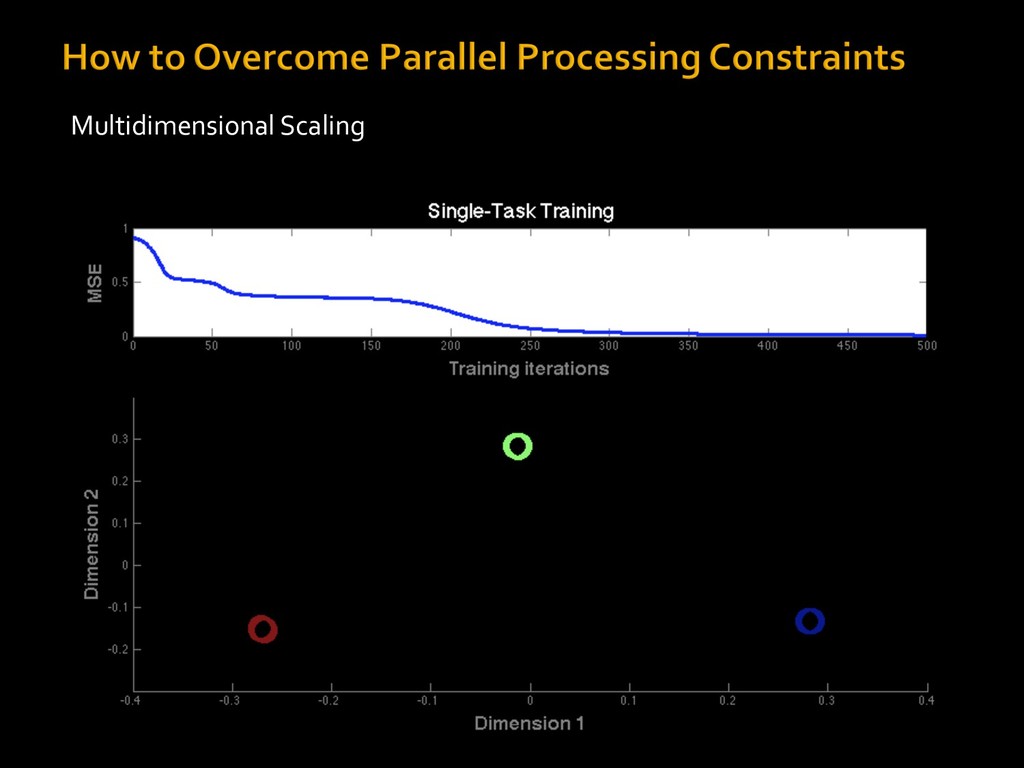
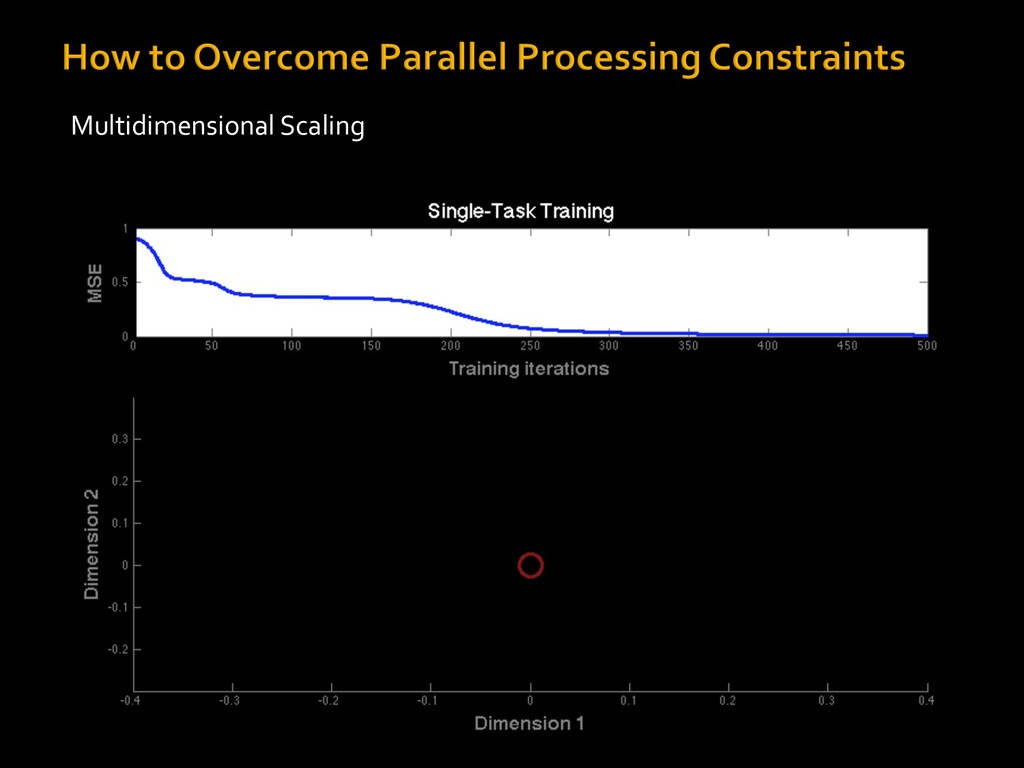
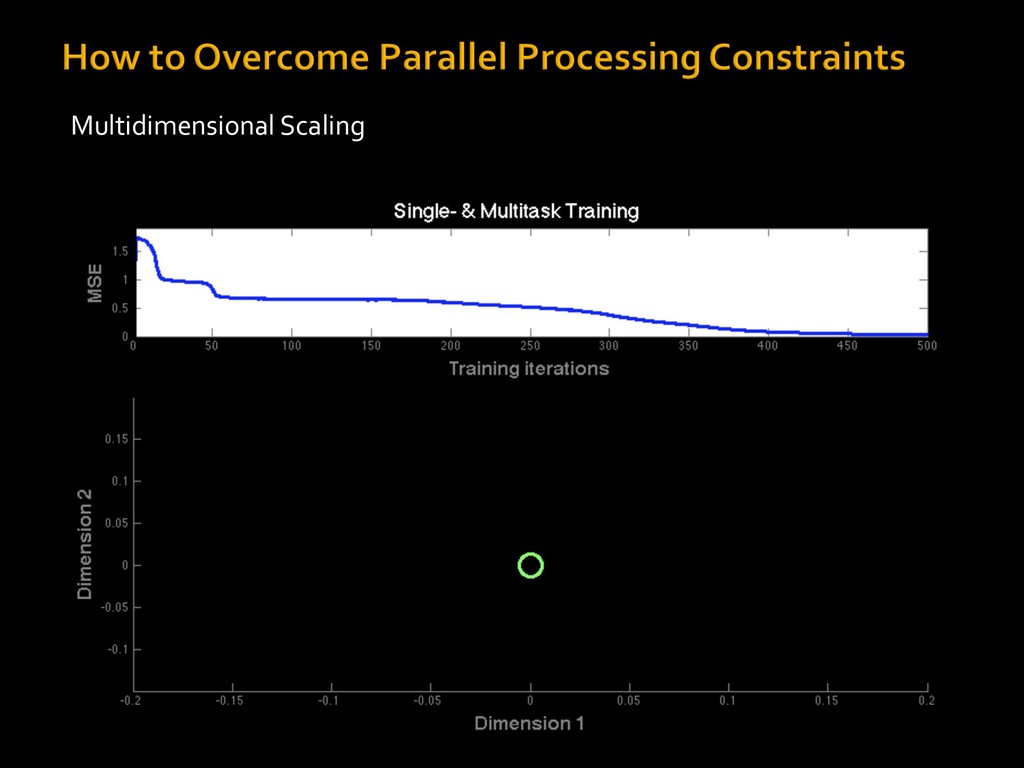
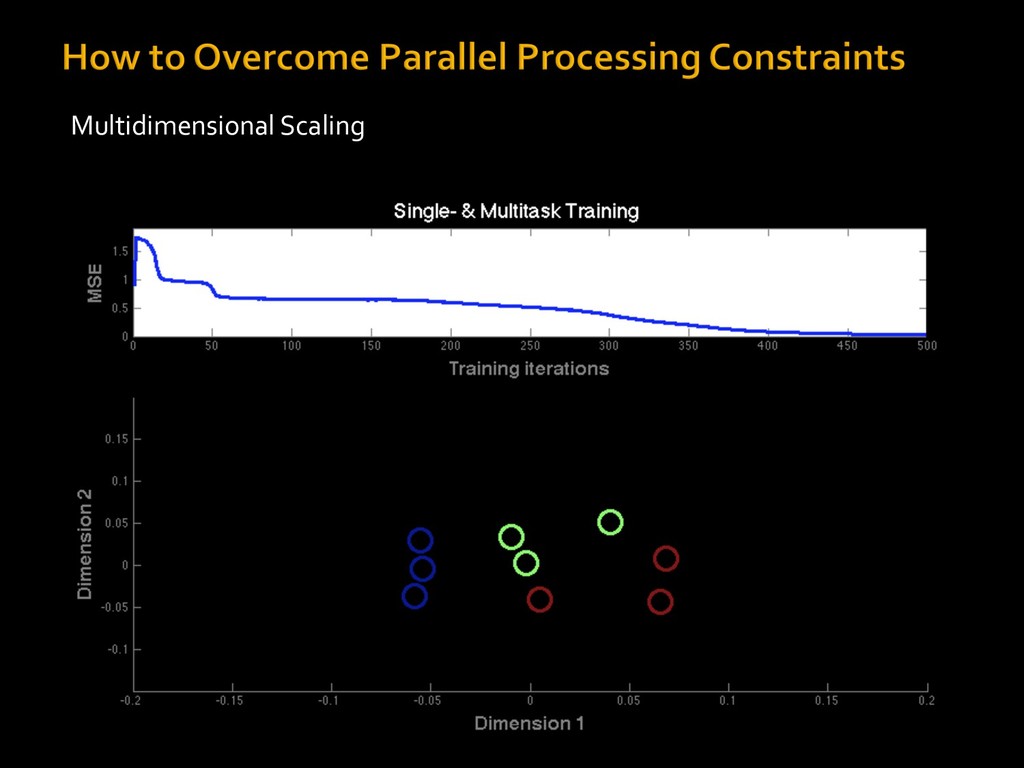
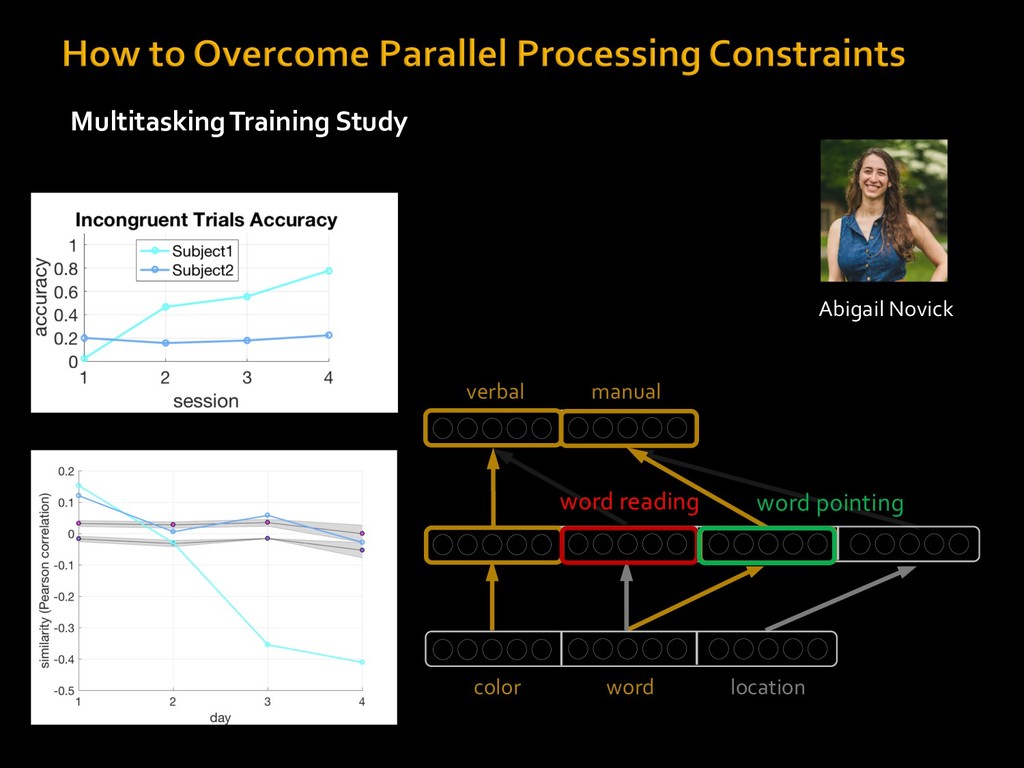
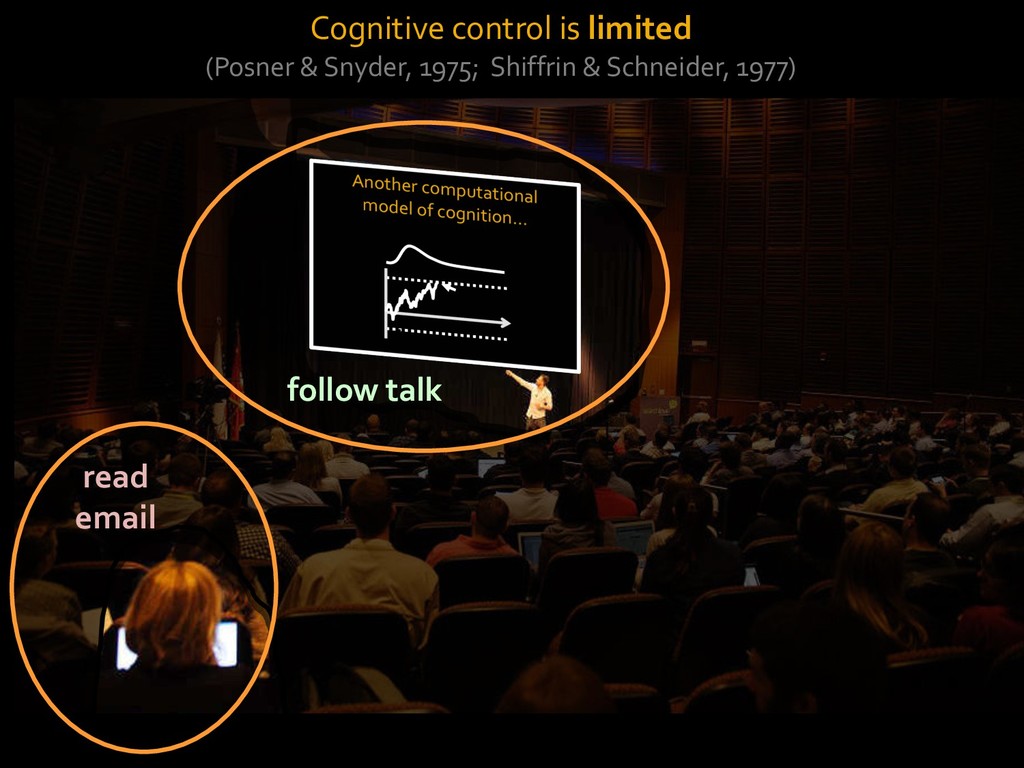
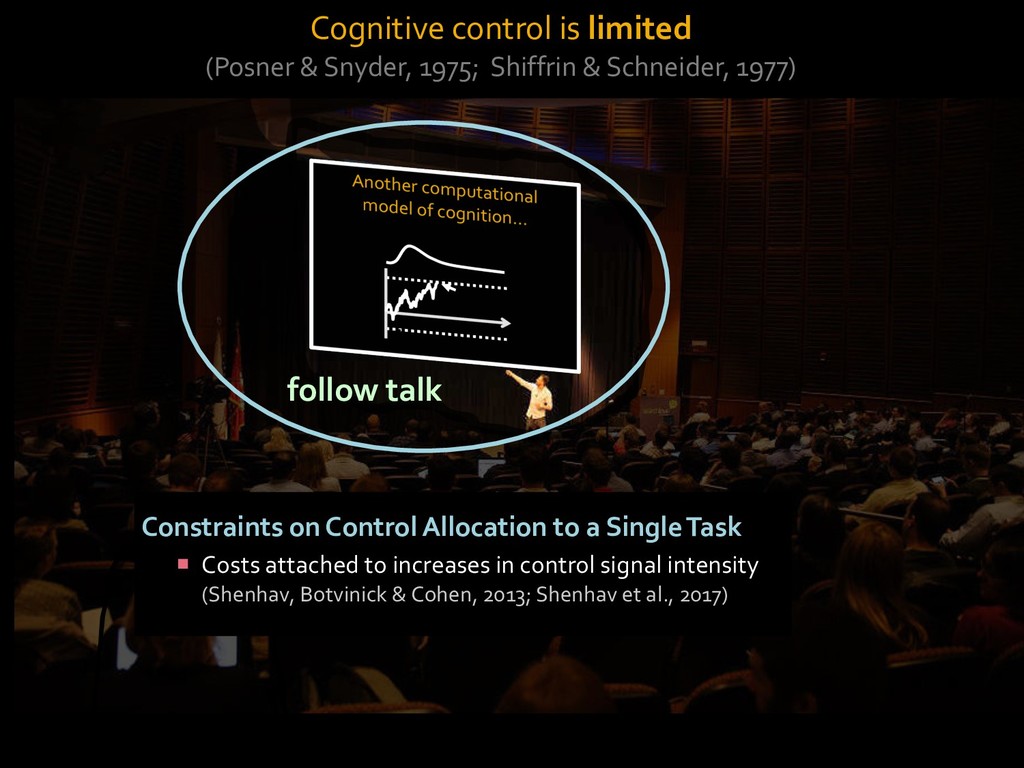
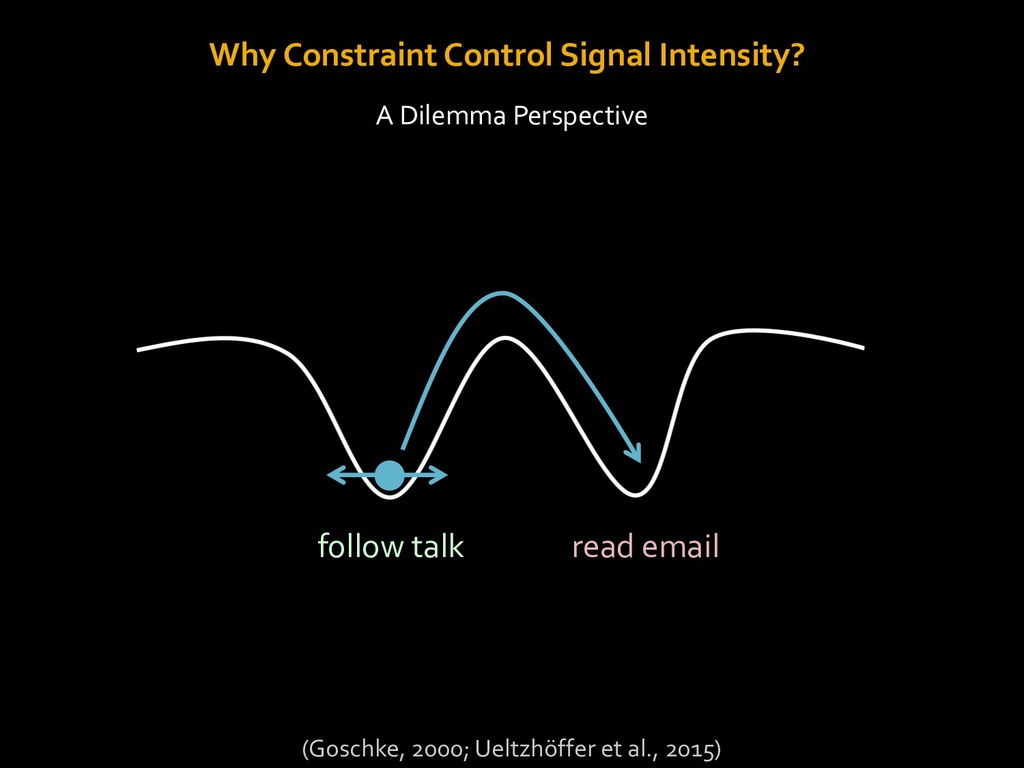
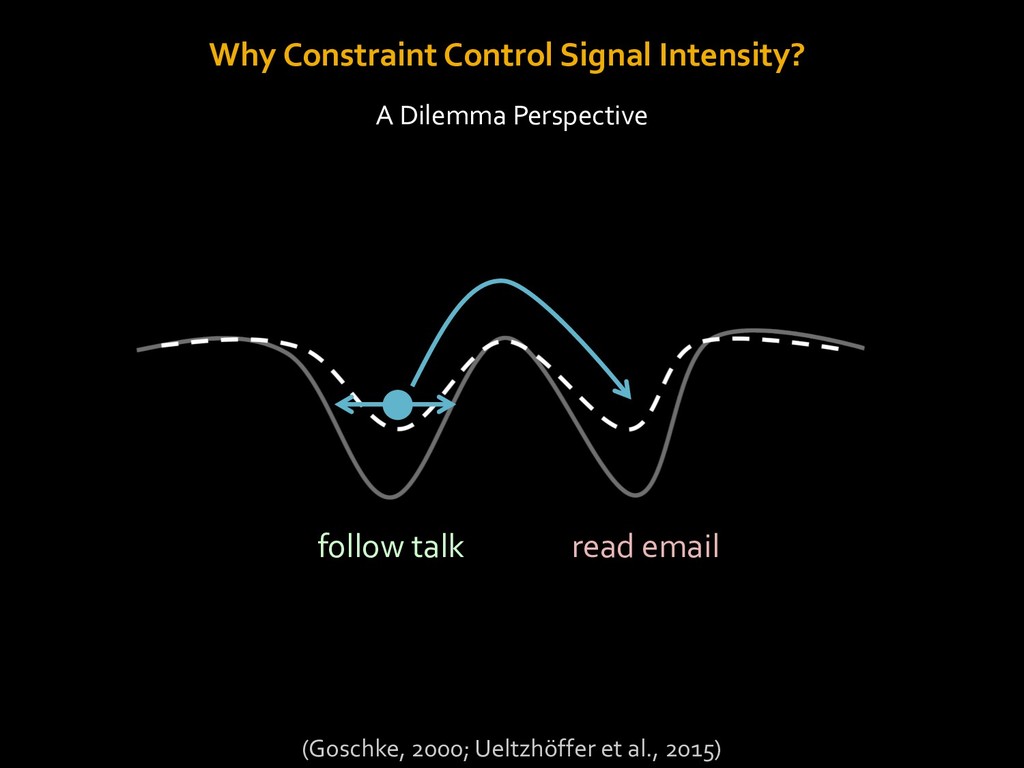
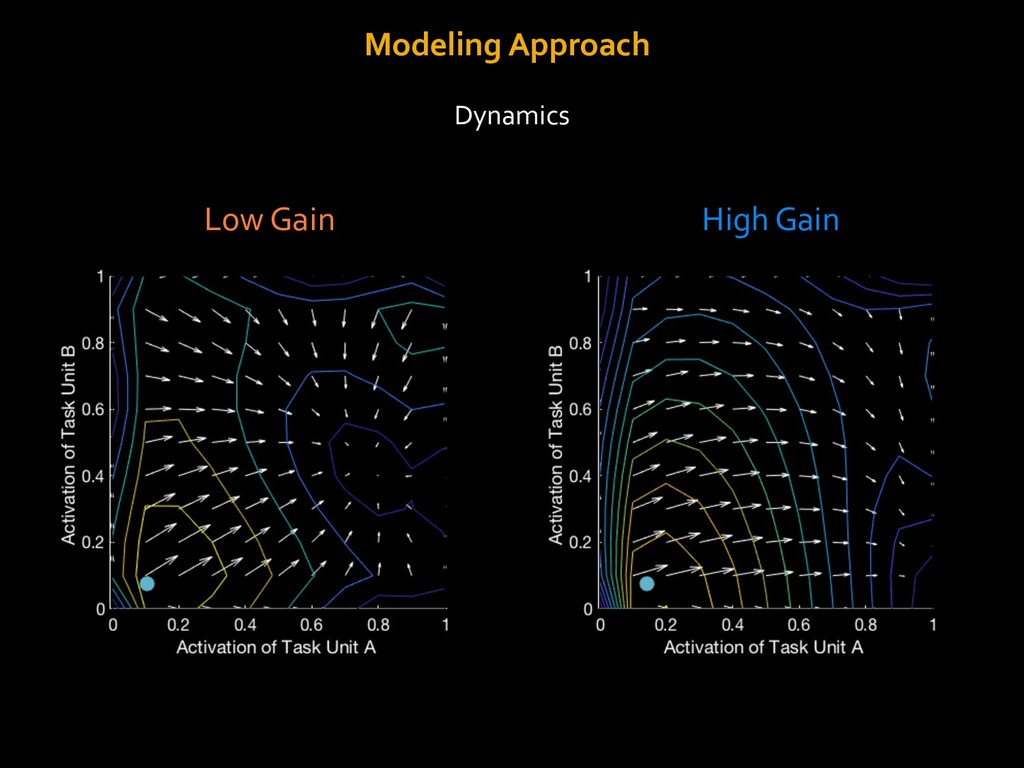
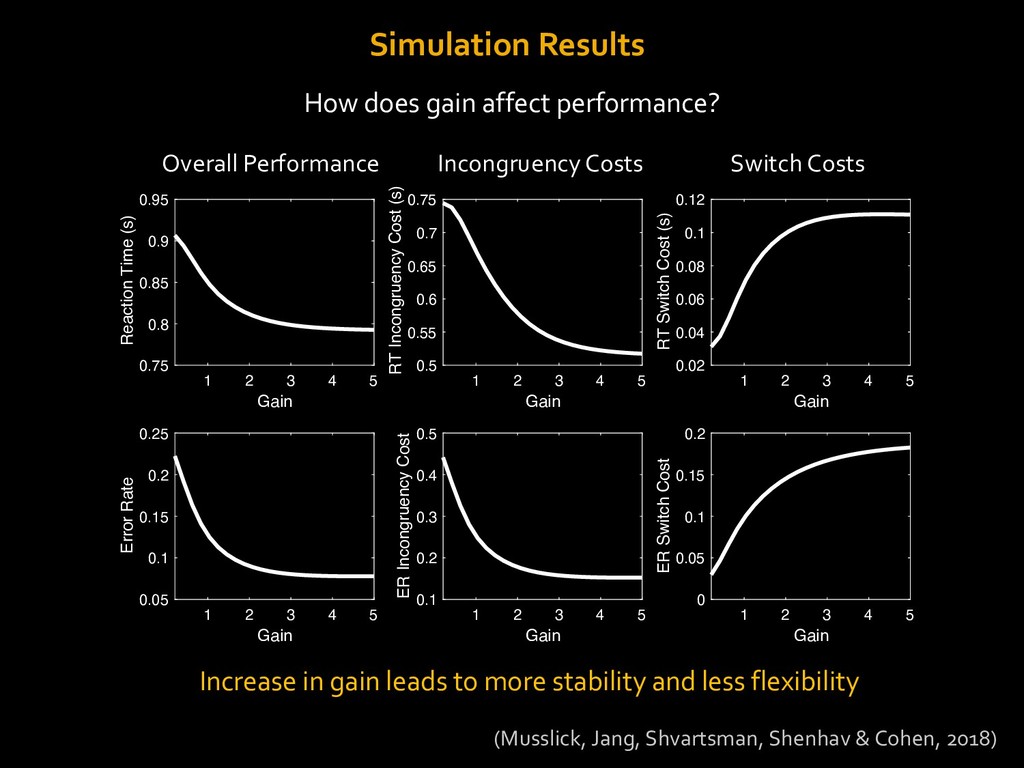
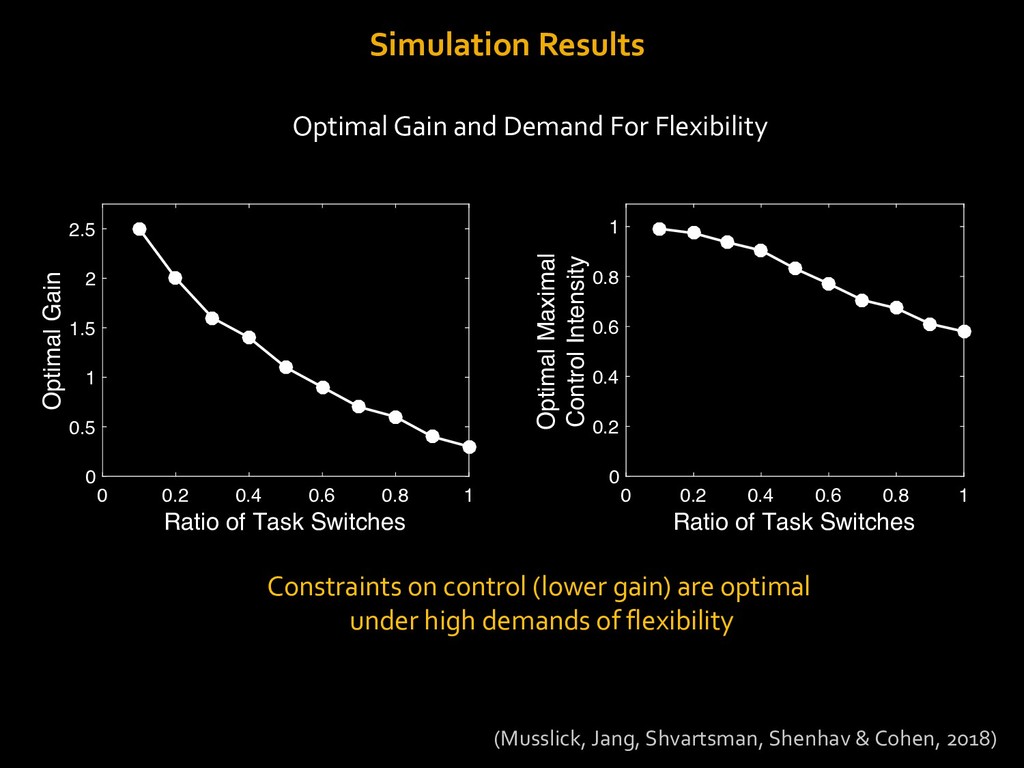
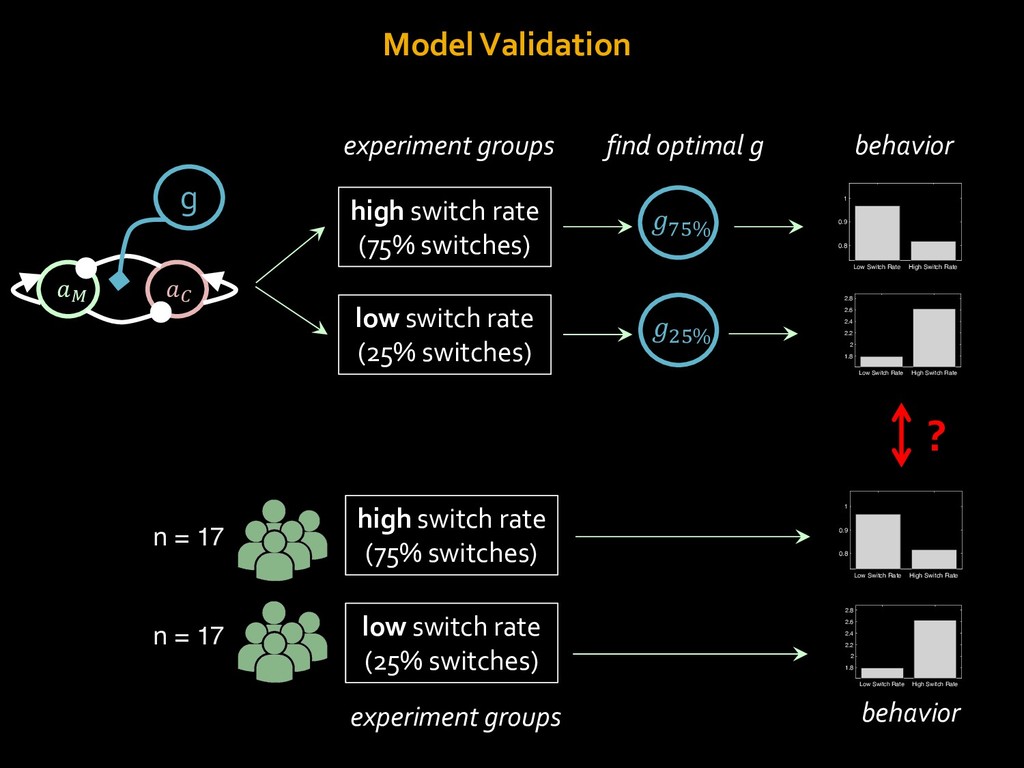
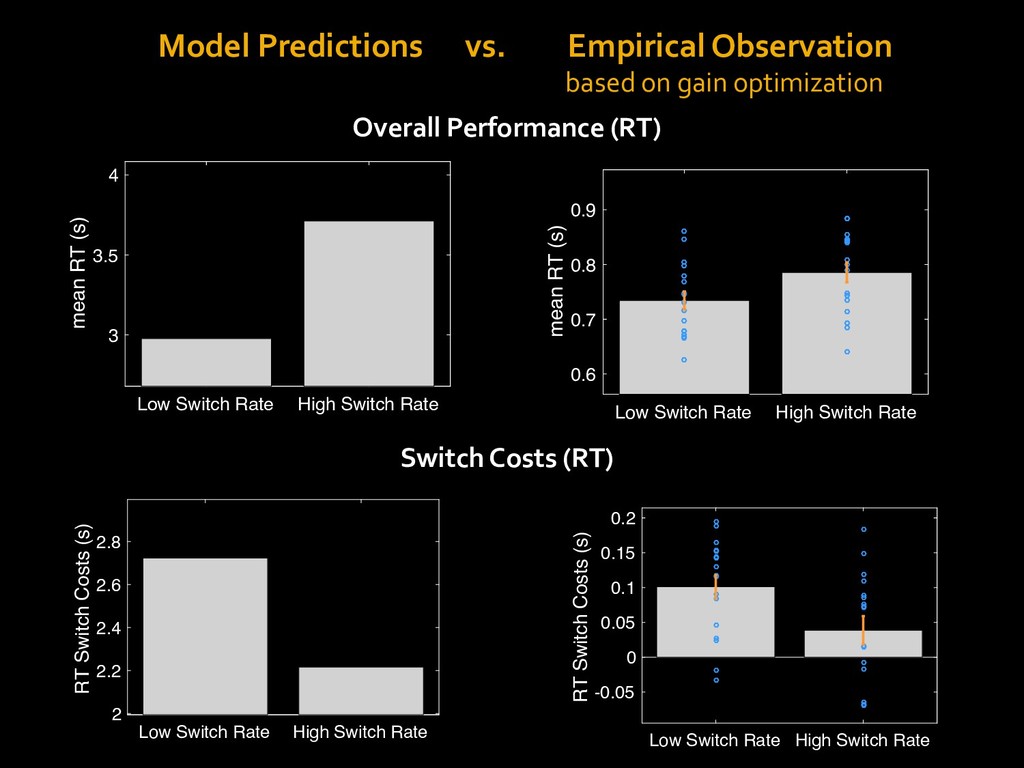
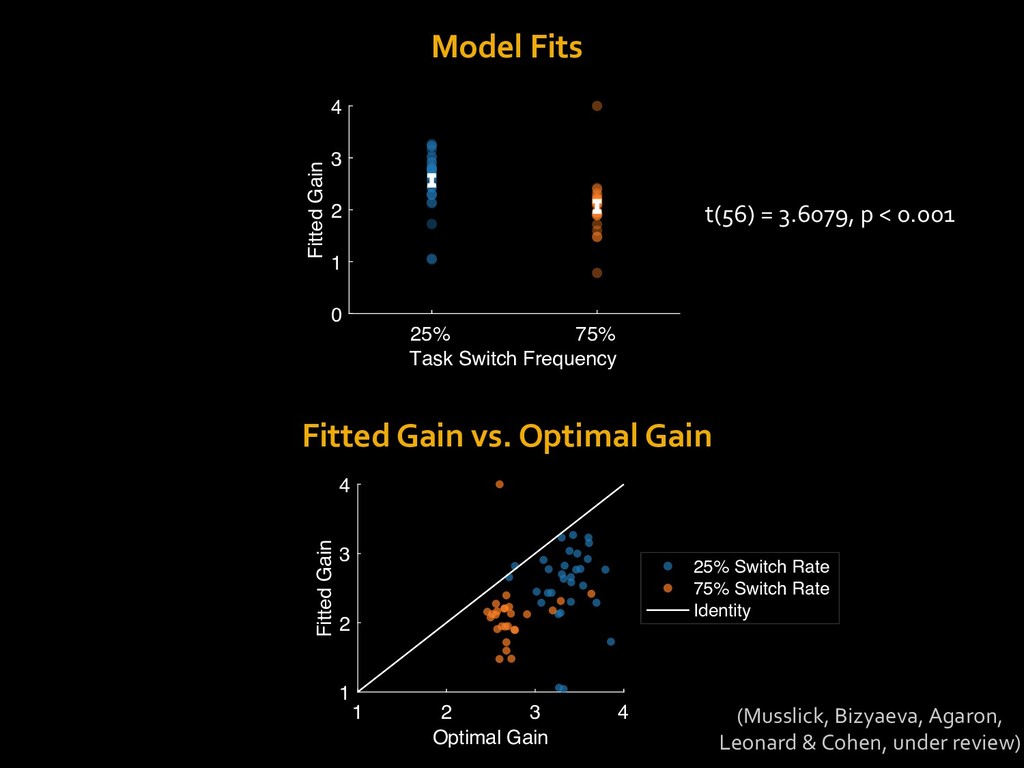
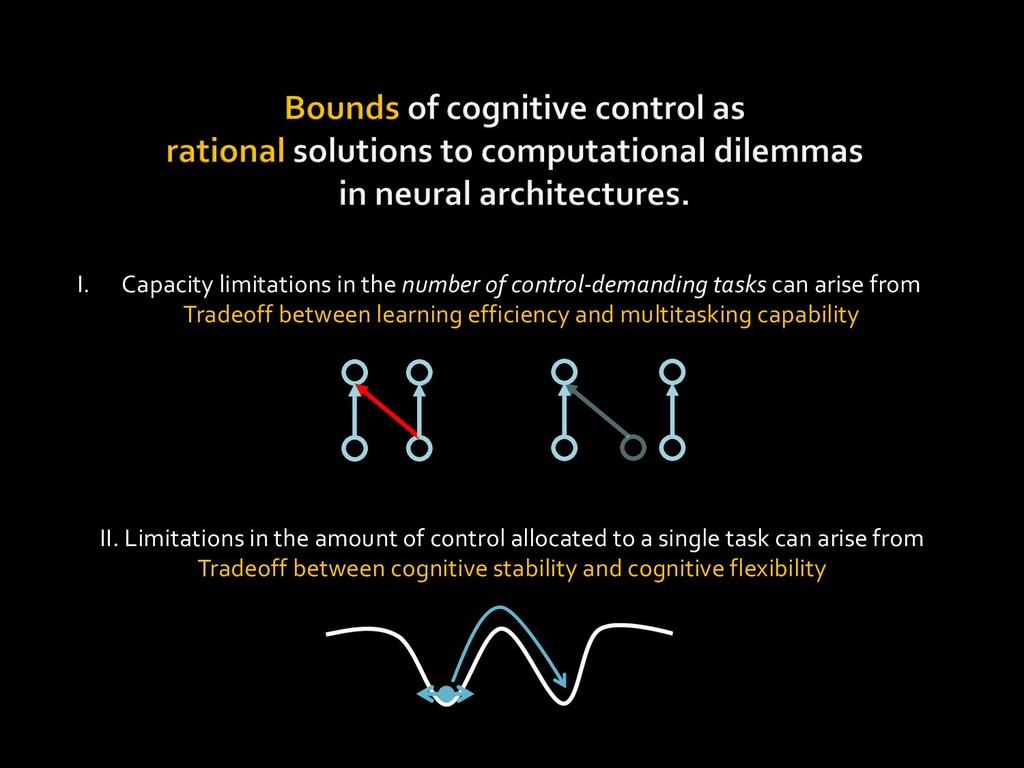
One of the most compelling characteristics of controlled processing is our limitation to exercise it. These limitations have become a fundamental concept in general theories of cognition that explain idiosyncrasies of human performance in terms of rational adaptations to a) the limited number of control-dependent tasks that can be executed simultaneously and b) constraints on the amount of cognitive control that can be allocated to a single task. However, this leaves open the question of why such constraints would exist in the first place. In this talk I will explore the hypothesis that the bounds of cognitive control reflect, at least in part, rational solutions to two fundamental computational dilemmas in neural network architectures. Using neural network simulations and behavioral experiments I will first demonstrate that neural architectures are subject to a tradeoff between learning efficiency that is promoted through the use of shared task representations, on the one hand, and multitasking capability that is achieved through the separation of task representations, on the other hand. The commonly-observed trajectory from controlled to automatic processing during learning may therefore reflect a rational optimization of this tradeoff: shared representations initially afford a bias toward efficient learning in novel task environments at the expense of seriality and control-dependence; but experience in environments where multitasking affords sufficient advantage ultimately promotes acquisition of separated, task-dedicated representations. As a consequence, executing multiple control-demanding tasks may only occur in serial, through flexible switching between tasks. The serial execution of tasks, however, gives rise to another tradeoff known as the stability-flexibility dilemma: allocating more control to a task results in greater activation of its neural representation but also in greater persistence of this activity upon switching to a new task, yielding switch costs. In the second part of this talk I will demonstrate that constraints on the amount of cognitive control allocated to a single task can reflect a rational solution to this dilemma. Based on these results I will argue that the study of computational dilemmas in neural systems may hold promise to uncover normative explanations for the seemingly irrational constraints on cognitive control, as well as human cognition in general.

Avatar for Sebastian Musslick

Sebastian Musslick

March 06, 2019
Tweet

More Decks by Sebastian Musslick

Other Decks in Research

Transcript

  1. Jonathan Cohen Ted Willke Amitai Shenhav & many others Biswadip

    Dey Kayhan Ozcimder Andrew Saxe Abigail Novick Anne Mennen Penina Krieger Yotam Sagiv Sachin Ravi Daniel Reichman Giovanni Petri Independent Vs. Interactive Parallelism Stability Vs. Flexibility Anastasia Bizyaeva Lena Rosendahl Shamay Agaron Seong Jun Jang Susan Liu Naomi Leonard
  2. Cognitive control – reconfigure information processing away from default (automatic)

    settings (Cohen et al., 1990; Botvinick & Cohen, 2015) read email follow talk
  3. read email follow talk Capacity Constraints on Control Allocation to

    Multiple Tasks (Allport, 1980; Meyer & Kieras, 1997; Navon & Gopher, 1979; Salvucci & Taatgen, 2008) Cognitive control is limited (Posner & Snyder, 1975; Shiffrin & Schneider, 1977)
  4. follow talk Constraints on Control Allocation to a Single Task

    ¡ Costs attached to increases in control signal intensity (Shenhav, Botvinick & Cohen, 2013; Shenhav et al., 2017) Cognitive control is limited (Posner & Snyder, 1975; Shiffrin & Schneider, 1977)
  5. Bounds of cognitive control are… § A defining feature of

    cognitive control (Posner & Snyder, 1997; Shiffrin & Schneider, 1977) § A premise of general theories of cognition § ACT-R (Anderson, 1986; 2013) § EPIC (Meyer & Kieras, 1997) § SOAR (Laird, 2012) § Multi-Threaded Cognition (Salvucci & Taatgen, 2008, 2010) § Bounded Rationality (Simon, 1957) § An explanatory variable in recent models of control allocation § Opportunity Cost Model (Kurzban, Duckworth, Kable & Myers, 2013) § Expected Value of Control Theory (Shenhav, Botvinick & Cohen, 2013; Musslick, Shenhav, Botvinick & Cohen, 2015) § Value of Computation (Lieder & Griffiths, 2015; Lieder, Shenhav, Musslick & Griffiths, 2018)
  6. Bounds of cognitive control are… § A defining feature of

    cognitive control (Posner & Snyder, 1997; Shiffrin & Schneider, 1977) § A premise of general theories of cognition § ACT-R (Anderson, 1986; 2013) § EPIC (Meyer & Kieras, 1997) § SOAR (Laird, 2012) § Multi-Threaded Cognition (Salvucci & Taatgen, 2008, 2010) § An explanatory variable in recent models of control allocation § Opportunity Cost Model (Kurzban, Duckworth, Kable & Myers, 2013) § Expected Value of Control Theory (Shenhav, Botvinick & Cohen, 2013; Musslick, Shenhav, Botvinick & Cohen, 2015) § Value of Computation (Lieder & Griffiths, 2015; Lieder, Shenhav, Musslick & Griffiths, 2018) Structural limitations? Metabolic constraints?
  7. I. Tradeoff between learning efficiency and multitasking capability II. Tradeoff

    between cognitive stability and cognitive flexibility
  8. Name the color of the following stimulus and, at the

    same time, point to where it is… BROWN
  9. point left if the written word is RED point right

    if the written word is GREEN RED
  10. RED

  11. RED

  12. Name the color of the following stimulus and, at the

    same time: point left if the written word is RED point right if the written word is GREEN RED
  13. RED

  14. Accuracy Results Color Naming + Location Pointing Word Mapping Color

    Naming + Word Mapping Accuracy by Task Task Percent Correct (%) 0 20 40 60 80 100 74 87 5.1 (first part) (second part) (third part) Anne Mennen Abigail Novick
  15. (Cohen et al., 1990 ; Feng et al., 2014) verbal

    manual response color word location stimulus internal (hidden) representation
  16. (Cohen et al., 1990 ; Feng et al., 2014) verbal

    manual response color word location stimulus internal (hidden) representation
  17. hidden control signal output control signal color word location verbal

    manual (Cohen et al., 1990 ; Feng et al., 2014) stimulus internal (hidden) representation response
  18. hidden control signal (Cohen et al., 1990 ; Feng et

    al., 2014) stimulus internal (hidden) representation response color word location output control signal verbal manual
  19. hidden control signal (Cohen et al., 1990 ; Feng et

    al., 2014) stimulus internal (hidden) representation response color word location output control signal verbal manual multitasking is possible
  20. hidden control signal (Cohen et al., 1990 ; Feng et

    al., 2014) stimulus internal (hidden) representation response color word location output control signal verbal manual multitasking is not possible
  21. hidden control signal (Cohen et al., 1990 ; Feng et

    al., 2014) stimulus internal (hidden) representation response color word location output control signal verbal manual purpose of cognitive control is to limit interference
  22. hidden control signal output control signal color word location verbal

    manual stimulus internal (hidden) representation response output representations task (internal) input representations
  23. What is the maximum number of tasks that the network

    can perform in parallel without interference?
  24. What is the maximum number of tasks that the network

    can perform in parallel without interference?
  25. bipartite task graph dependency graph a b c a b

    c Task Dependencies a b c a b c a b c a b c
  26. Parallel Processing Capability Maximum amount of tasks that can be

    performed in independently? a b c d e f g h i j bipartite task graph a b c j i d h g e f dependency graph
  27. Parallel Processing Capability An independent vertex set of a graph

    G is a subset of the vertices such that no two vertices in the subset are connected by an edge of G. A maximum independent vertex set is an independent vertex set containing the largest possible number of vertices for a given graph. a j g Maximum amount of tasks that can be performed in independently? dependency graph (Musslick, Özcimder, Dey, Patwary, Willke & Cohen, CogSci, 2016)
  28. Parallel Processing Capability An independent vertex set of a graph

    G is a subset of the vertices such that no two vertices in the subset are connected by an edge of G. A maximum independent vertex set is an independent vertex set containing the largest possible number of vertices for a given graph. Maximum amount of tasks that can be performed in independently? bipartite task graph dependency graph a b c d e f g h i j a j g (Musslick, Özcimder, Dey, Patwary, Willke & Cohen, CogSci, 2016)
  29. Parallel processing capacity decreases as a function of § Overlap

    between task processing pathways (Feng et al., 2014; Musslick et al, 2016)
  30. = 2log('() (* 60 40 20 0 ( * Network

    Size (Alon, Reichman, Shinkar, Wagner, Musslick, Cohen, Griffiths, Dey, Ozcimder, NIPS, 2017) Parallel processing capacity decreases as a function of § Network depth Maximum Induced Path
  31. Network Architecture and Training Environment hidden … a b c

    i …  x t task stimulus grouped into input dimensions output grouped into response dimensions verbal joystick keyboard color word location
  32. Network Architecture and Training Environment hidden … a b c

    i …  x t task stimulus grouped into input dimensions output grouped into response dimensions A task defines a one-to-one mapping from a stimulus input dimension to a response dimension verbal joystick keyboard color word location
  33. Extract Dependency Graph From Trained Neural Network a b c

    i …  x t … a trained neural network bipartite graph b c d e f g h i
  34. Extract Dependency Graph From Trained Neural Network a b c

    i …  x t … a bipartite graph b c d e f g h i … a b … !" trained neural network
  35. Extract Dependency Graph From Trained Neural Network a b c

    i …  x t … a bipartite graph b c d e f g h i … a c … !" trained neural network
  36. Extract Dependency Graph From Trained Neural Network a b c

    i … …  x t a bipartite graph b c d e f g h i trained neural network
  37. Extract Dependency Graph From Trained Neural Network a b c

    i …  x t a bipartite graph b c d e f g h i trained neural network … a d … !"
  38. Predict Parallel Processing Performance Based On Dependency Graph bipartite graph

     x t trained neural network a b c d e f g h i dependency graph a i b h g f c d e
  39.  x t trained neural network Predict Parallel Processing Performance

    Based On Dependency Graph bipartite graph a b c i … …  x t trained neural network a b c d e f g h i dependency graph a i b h g f c d e multitasking performance a i
  40. Assessing Multitasking Performance a b c i … … 

    x t trained neural network a i Leaky Competitive Accumulator (LCA; Usher & McClelland, 2001) !"#$%&%$' !$ = %)*+$ − !-#"' − %)ℎ%/%$%0) + 2-34-5#%$"$%0) + )0%2- 6-7"6! 6"$- = 8##+6"#' 9:9 + ;: § Response: LCA unit that first reaches threshold* § Reaction Time (RT): Time steps taken to reach threshold* * threshold that maximizes
  41. 0 1 2 3 4 5 6 Task Set Size

    0 20 40 60 80 100 Performance (%) MIS =1 MIS =2 MIS =3 MIS =4 MIS =5 MIS =6 MIS =7 MIS =8 Predict Parallel Processing Capacity Based on MIS (Petri, Musslick, Özcimder, Dey, Achmed, Willke & Cohen, in submission) a i b h g f c d e Multitasking Accuracy (%)
  42. 0 1 2 3 4 5 6 Task Set Size

    0 20 40 60 80 100 Performance (%) MIS =1 MIS =2 MIS =3 MIS =4 MIS =5 MIS =6 MIS =7 MIS =8 Predict Parallel Processing Capacity Based on MIS cardinality of maximum independent set a i b h g f c d e (Petri, Musslick, Özcimder, Dey, Achmed, Willke & Cohen, in submission) Multitasking Accuracy (%)
  43. 0 1 2 3 4 5 6 Task Set Size

    0 20 40 60 80 100 Performance (%) MIS =1 MIS =2 MIS =3 MIS =4 MIS =5 MIS =6 MIS =7 MIS =8 Predict Parallel Processing Capacity Based on MIS 0 1 2 3 4 5 6 Task Set Size 0 20 40 60 80 100 Performance (%) MIS =1 MIS =2 MIS =3 MIS =4 MIS =5 MIS =6 MIS =7 MIS =8 (Petri, Musslick, Özcimder, Dey, Achmed, Willke & Cohen, in submission) Multitasking Accuracy (%)
  44. Predict Parallel Processing Capacity Based on MIS MIS-3 MIS-2 MIS-1

    MIS MIS+1 MIS+2 MIS+3 Task Set Size 0 20 40 60 80 100 Performance (%) MIS =1 MIS =2 MIS =3 MIS =4 MIS =5 MIS =6 (Petri, Musslick, Özcimder, Dey, Achmed, Willke & Cohen, in submission) Multitasking Accuracy (%)
  45. Architecture a b c i … …  x t

    Stimulus a Task Response Associative Layer
  46. Assessing Multitasking Performance a b c i … … 

    x t trained neural network a i Leaky Competitive Accumulator (LCA; Usher & McClelland, 2001) !"#$%&%$' !$ = %)*+$ − !-#"' − %)ℎ%/%$%0) + 2-34-5#%$"$%0) + )0%2- 6-7"6! 6"$- = 8##+6"#' 9:9 + ;: § Response: LCA unit that first reaches threshold* § Reaction Time (RT): Time steps taken to reach threshold* * threshold that maximizes
  47. A E B C D multitasking not possible Task Environment

    Effects on Parallel Processing Accuracy
  48. (Musslick & Cohen, under review) Task Environment 0 0.5 1

    % Training on Tasks D and E Compared to Tasks A, B and C 0 50 100 Accuracy (%) A E B C D Effects on Parallel Processing Accuracy
  49. (Musslick & Cohen, under review) Task Environment A E B

    C D 0 50 100 150 % Training on Tasks D and E Compared to Tasks A, B and C 0 50 100 Accuracy (%) Effects on Parallel Processing Accuracy 0 50 100 150 % Training on Tasks D and E Compared to Tasks A, B and C 0 50 100 Accuracy (%) Peforming Task D alone Performing Task E alone Multitasking Tasks A and C Multitasking Tasks A and B
  50. (Musslick & Cohen, under review) Task Environment A E B

    C D 0 50 100 150 % Training on Tasks D and E Compared to Tasks A, B and C 0 50 100 Accuracy (%) Effects on Parallel Processing Accuracy 0 50 100 150 % Training on Tasks D and E Compared to Tasks A, B and C 0 50 100 Accuracy (%) Peforming Task D alone Performing Task E alone Multitasking Tasks A and C Multitasking Tasks A and B
  51. (Musslick & Cohen, under review) Task Environment A E B

    C D 0 50 100 150 % Training on Tasks D and E Compared to Tasks A, B and C 0 50 100 Accuracy (%) Effects on Parallel Processing Accuracy 0 50 100 150 % Training on Tasks D and E Compared to Tasks A, B and C 0 50 100 Accuracy (%) Peforming Task D alone Performing Task E alone Multitasking Tasks A and C Multitasking Tasks A and B
  52. (Townsend & Wenger, 2004; Townsend & Altieri, 2012) Effects on

    Parallel Processing Reaction Time Independent Channel Model threshold signal 1 + + noise feedback AND + + noise feedback signal 2
  53. Effects on Parallel Processing Reaction Time threshold Task 1 signal

    + + AND + + Task 2 signal !"# (%" ≤ ' ()* %# ≤ ') ,-.(!" %" ≤ ' , !# (%# ≤ ')) ≤ (upper bound) ≤ !" %" ≤ ' + !# %" ≤ ' − 1 (lower bound) Inequality by Colonius and Vorberg (1994) (Townsend & Wenger, 2004) %" %#
  54. Effects on Parallel Processing Reaction Time A E B C

    D A E B C D 0.3 0.4 0.5 0.6 0.7 0.8 Time t in Seconds -1 -0.5 0 0.5 1 Probability of Response before t A + B - 1 min(A, B) shared representations + high conflict shared representations + low conflict 0.3 0.4 0.5 0.6 0.7 0.8 Time t in Seconds -1 -0.5 0 0.5 1 Probability of Response before t A AND B A + B - 1 min(A, B) 0.3 0.4 0.5 0.6 0.7 0.8 Time t in Seconds -1 -0.5 0 0.5 1 Probability of Response before t A AND B A + B - 1 min(A, B)
  55. Effects on Parallel Processing Reaction Time A E B C

    D A E B C D separate representations separate representations + dual tasking training 0.3 0.4 0.5 0.6 0.7 0.8 Time t in Seconds -1 -0.5 0 0.5 1 Probability of Response before t A AND C A + C - 1 min(A, C) 0.25 0.3 0.35 0.4 0.45 Time t in Seconds -1 -0.5 0 0.5 1 Probability of Response before t Tasks A and C A AND C A + C - 1 min(A, C)
  56. Psychological Refractory Period (Telford, 193; Welford, 1952) Task 1 Stimulus

    1 Response 1 Processing Task 1 Stimulus 2 Response 2 Processing Task 2 Reaction Time for Task 2 (long SOA) Task 2 Reaction Time for Task 1 SOA (stimulus onset asynchrony) time
  57. Psychological Refractory Period (Telford, 193; Welford, 1952) Task 1 Stimulus

    1 Response 1 Processing Task 1 Stimulus 2 Response 2 Processing Task 2 Reaction Time for Task 2 (long SOA) Task 2 Reaction Time for Task 1 SOA (stimulus onset asynchrony) time
  58. Psychological Refractory Period (Telford, 193; Welford, 1952) Task 1 Stimulus

    1 Response 1 Processing Task 1 Stimulus 2 Response 2 Processing Task 2 PRP Task 2 SOA Reaction Time for Task 2 (long SOA) Reaction Time for Task 2 (short SOA) time
  59. Psychological Refractory Period (Telford, 193; Welford, 1952) Task 1 Stimulus

    1 Response 1 Processing Task 1 Stimulus 2 Response 2 Processing Task 2 PRP Task 2 SOA Reaction Time for Task 2 (long SOA) Reaction Time for Task 2 (short SOA) PRP time
  60. Psychological Refractory Period (Telford, 193; Welford, 1952) Task 1 Stimulus

    1 Response 1 Processing Task 1 Stimulus 2 Response 2 Processing Task 2 PRP Task 2 SOA Reaction Time for Task 2 Pashler (1994) time
  61. … a b c i …  x t input

    layer output layer associative layer task layer p …persistence t …time integration of net input over time !"#$ = 1 − ( ) !"#$ + ( ) !"#$+,
  62. 0 2 4 6 SOA (s) 0 0.1 0.2 0.3

    0.4 Reaction Time of Task A (s) Task B First, p = 0 Psychological Refractory Period (Telford, 193; Welford, 1952) A (second) E B C (first) D separate representations A (second) E B (first) C D shared representation 0 2 4 6 SOA (s) 0 0.1 0.2 0.3 0.4 Reaction Time of Task A (s) Task C First, p = 0.9 Task C First, p = 0.8 Task C First, p = 0.5 Task C First, p = 0 0 2 4 6 SOA (s) 0 0.1 0.2 0.3 0.4 Reaction Time of Task A (s) Task B First, p = 0.5 Task B First, p = 0 0 2 4 6 SOA (s) 0 0.1 0.2 0.3 0.4 Reaction Time of Task A (s) Task B First, p = 0.8 Task B First, p = 0.5 Task B First, p = 0 0 2 4 6 SOA (s) 0 0.1 0.2 0.3 0.4 Reaction Time of Task A (s) Task B First, p = 0.9 Task B First, p = 0.8 Task B First, p = 0.5 Task B First, p = 0
  63. Psychological Refractory Period (Telford, 193; Welford, 1952) 0 2 4

    6 SOA (s) 0 0.1 0.2 0.3 0.4 Reaction Time of Task A (s) Task C First, p = 0.9 Task C First, p = 0.8 Task C First, p = 0.5 Task C First, p = 0 A E B C D separate representations + dual tasking training “virtually perfect time sharing” (Schuhmacher et al., 2001)
  64. Why Shared Representations? § Multi-Task Learning: Improved Learning Efficiency &

    Generalization Performance (e.g. Baxter, 1995; Caruana, 1997; Collobert & Weston, 2008; Bengio et al., 2013) shared intermediate representation auxilliary task 1 output auxilliary task 2 output primary task output …
  65. 2 tasks executable at a time !" !# output gating

    signal $" hidden gating signal $#
  66. ∝ multitasking capacity # of tasks sharing an input dimension

    Andrew Saxe "# "$ %$ %# hidden gating signal output gating signal (Musslick, Saxe, Dey, Özcimder, Henselman & Cohen, CogSci, 2017) iterations to learn2
  67. Neural Network Simulation stimulus stimulus !" !# !$ %" %#

    %$ internal (hidden) representation task … stimulus grouped into input dimensions output grouped into response dimensions
  68. Neural Network Simulation !" !# tasks rely on different Input

    features !" !# tasks rely on the same Input features !" !# tasks rely on partially overlapping input features 0 0.5 1 Learned Task Correlation 50 55 60 65 70 75 Multitasking Accuracy (%) 0 0.2 0.4 0.6 0.8 1 Feature Overlap 0 0.5 1 Learned Task Correlation 50 55 60 65 70 75 Multitasking Accuracy (%) 0 0.2 0.4 0.6 0.8 1 Feature Overlap correlation between task features (Musslick, Saxe, Dey, Özcimder, Henselman & Cohen, CogSci, 2017)
  69. Neural Network Simulation 70 75 80 85 Iterations Required To

    Train 42 44 46 48 50 52 Multitasking Accuracy (%) 0 0.2 0.4 0.6 0.8 1 Initial Task Correlation 70 75 80 85 Iterations Required To Train 42 44 46 48 50 52 Multitasking Accuracy (%) 0 0.2 0.4 0.6 0.8 1 Initial Task Correlation Initial Task Correlation … a b c j …  x t (Musslick, Saxe, Dey, Özcimder, Henselman & Cohen, CogSci, 2017)
  70. Neural Network Simulation 70 75 80 85 Iterations Required To

    Train 42 44 46 48 50 52 Multitasking Accuracy (%) 0 0.2 0.4 0.6 0.8 1 Initial Task Correlation Initial Task Correlation 60 70 80 90 100 110 120 Iterations Required To Train 40 50 60 70 80 90 Multitasking Accuracy (%) 0 0.2 0.4 0.6 0.8 1 Initial Task Similarity 100% Feature Overlap 80% Feature Overlap 0% Feature Overlap (Musslick, Saxe, Dey, Özcimder, Henselman & Cohen, CogSci, 2017)
  71. (Sagiv, Musslick, Niv & Cohen, CogSci, 2018) Separating representations P(separate

    representations) is optimal if a) Time cost for serialization is high b) There is little benefit for shared representations in terms of learning efficiency P (separate representations)
  72. (Sagiv, Musslick, Niv & Cohen; 2018) Yotam Sagiv (First Year

    PNI Student) B …basis set (shared representations) T …tensor product (separate representations) C …serialization cost ⍺ …number of tasks performed
  73. I. Increased multitasking capacity due to automatization ('reflex action'), not

    due to enhanced mental capacity II. Multitasking capability must be domain-specific Thea Alba
  74. read email follow talk Cognitive control is limited (Posner &

    Snyder, 1975; Shiffrin & Schneider, 1977)
  75. follow talk Constraints on Control Allocation to a Single Task

    ¡ Costs attached to increases in control signal intensity (Shenhav, Botvinick & Cohen, 2013; Shenhav et al., 2017) Cognitive control is limited (Posner & Snyder, 1975; Shiffrin & Schneider, 1977)
  76. Why Constraint Control Signal Intensity? A Dilemma Perspective read email

    follow talk (Goschke, 2000; Ueltzhöffer et al., 2015)
  77. Why Constraint Control Signal Intensity? A Dilemma Perspective read email

    follow talk (Goschke, 2000; Ueltzhöffer et al., 2015)
  78. g !" !# !# !" $% $& !' (% !'

    (& )*+% = !" $% − !# !& + (% + / 0$% 0+ = −$% + 1 1 + *234"56 read email follow talk regulates attractor depth Modeling Approach
  79. Experiment Dot Motion-Color Task Switching K L motion task Is

    the majority of the dots moving up or down? color task Is the majority of the dots blue or red? up down blue red (Kayser et al., 2010; Mante et al., 2013)
  80. Experiment Dot Motion-Color Task Switching … Task Cue Task Execution

    Preparation ITI Motion Mini Block Color Mini Block …
  81. Model Simulation !" !# t 0 Response Left Right Color

    Motion Control Signals g $" $# Rule Module (between-trial dynamics) Decision Module (within-trial dynamics) %&'() = $" + $# + $" !" + $# !# automatic controlled
  82. Simulation Results How does gain affect performance? 1 2 3

    4 5 Gain 0.75 0.8 0.85 0.9 0.95 Reaction Time (s) 1 2 3 4 5 Gain 0.05 0.1 0.15 0.2 0.25 Error Rate 1 2 3 4 5 Gain 0.5 0.55 0.6 0.65 0.7 0.75 RT Incongruency Cost (s) 1 2 3 4 5 Gain 0.1 0.2 0.3 0.4 0.5 ER Incongruency Cost 1 2 3 4 5 Gain 0.02 0.04 0.06 0.08 0.1 0.12 RT Switch Cost (s) 1 2 3 4 5 Gain 0 0.05 0.1 0.15 0.2 ER Switch Cost Switch Costs Incongruency Costs Overall Performance Increase in gain leads to more stability and less flexibility (Musslick, Jang, Shvartsman, Shenhav & Cohen, 2018) 1 2 3 4 5 Gain 0.75 0.8 0.85 0.9 0.95 Reaction Time (s) 1 2 3 4 5 Gain 0.05 0.1 0.15 0.2 0.25 Error Rate 1 2 3 4 5 Gain 0.5 0.55 0.6 0.65 0.7 0.75 RT Incongruency Cost (s) 1 2 3 4 5 Gain 0.1 0.2 0.3 0.4 0.5 ER Incongruency Cost 1 2 3 4 5 Gain 0.02 0.04 0.06 0.08 0.1 0.12 RT Switch Cost (s) 1 2 3 4 5 Gain 0 0.05 0.1 0.15 0.2 ER Switch Cost 1 2 3 4 5 Gain 0.75 0.8 0.85 0.9 0.95 Reaction Time (s) 1 2 3 4 5 Gain 0.05 0.1 0.15 0.2 0.25 Error Rate 1 2 3 4 5 Gain 0.5 0.55 0.6 0.65 0.7 0.75 RT Incongruency Cost (s) 1 2 3 4 5 Gain 0.1 0.2 0.3 0.4 0.5 ER Incongruency Cost 1 2 3 4 5 Gain 0.02 0.04 0.06 0.08 0.1 0.12 RT Switch Cost (s) 1 2 3 4 5 Gain 0 0.05 0.1 0.15 0.2 ER Switch Cost
  83. Simulation Results Optimal Gain and Demand For Flexibility Constraints on

    control (lower gain) are optimal under high demands of flexibility 0 0.2 0.4 0.6 0.8 1 Ratio of Task Switches 0 0.5 1 1.5 2 2.5 Optimal Gain 0 0.2 0.4 0.6 0.8 1 Ratio of Task Switches 0 0.2 0.4 0.6 0.8 1 Optimal Maximal Control Intensity (Musslick, Jang, Shvartsman, Shenhav & Cohen, 2018)
  84. Model Validation ? high switch rate (75% switches) low switch

    rate (25% switches) !" !# g experiment groups find optimal g $%&% $(&% behavior Low Switch Rate High Switch Rate 0.8 0.9 1 RT Switch Costs (s) Low Switch Rate High Switch Rate 1.8 2 2.2 2.4 2.6 2.8 RT Incongruency Costs (s) high switch rate (75% switches) low switch rate (25% switches) experiment groups behavior Low Switch Rate High Switch Rate 0.8 0.9 1 RT Switch Costs (s) Low Switch Rate High Switch Rate 1.8 2 2.2 2.4 2.6 2.8 RT Incongruency Costs (s) n = 17 n = 17
  85. Model Predictions vs. Empirical Observation based on gain optimization Overall

    Performance (RT) Low Switch Rate High Switch Rate 0.6 0.7 0.8 0.9 mean RT (s) Low Switch Rate High Switch Rate 3 3.5 4 mean RT (s) Switch Costs (RT) Low Switch Rate High Switch Rate 2 2.2 2.4 2.6 2.8 RT Switch Costs (s) Low Switch Rate High Switch Rate -0.05 0 0.05 0.1 0.15 0.2 RT Switch Costs (s)
  86. Model Fits 25% 75% Task Switch Frequency 0 1 2

    3 4 Fitted Gain Fitted Gain vs. Optimal Gain t(56) = 3.6079, p < 0.001 1 2 3 4 Optimal Gain 1 2 3 4 Fitted Gain 25% Switch Rate 75% Switch Rate Identity (Musslick, Bizyaeva, Agaron, Leonard & Cohen, under review)
  87. I. Capacity limitations in the number of control-demanding tasks can

    arise from Tradeoff between learning efficiency and multitasking capability II. Limitations in the amount of control allocated to a single task can arise from Tradeoff between cognitive stability and cognitive flexibility
  88. Jonathan Cohen Ted Willke Amitai Shenhav & many others Biswadip

    Dey Kayhan Ozcimder Andrew Saxe Abigail Novick Anne Mennen Penina Krieger Yotam Sagiv Sachin Ravi Daniel Reichman Giovanni Petri Independent Vs. Interactive Parallelism Stability Vs. Flexibility Anastasia Bizyaeva Lena Rosendahl Shamay Agaron Seong Jun Jang Susan Liu Naomi Leonard