Upgrade to Pro — share decks privately, control downloads, hide ads and more …

BMMB554: Genome Conformation

BMMB554: Genome Conformation

Slides on genome conformation analysis (3C, 5C, Hi-C)

Anton Nekrutenko

April 12, 2017
Tweet

More Decks by Anton Nekrutenko

Other Decks in Education

Transcript

  1. Chromatin
    interactions and
    genome architecture
    (courtesy of James Taylor)

    View Slide

  2. Adapted from Wasserman and Sandelin, Nature Review Genetics. 2004
    Transcription Initiation
    Complex
    Gene
    Promoter
    cis-regulatory module
    How do cis-regulatory
    modules interact with their
    target promoters?

    View Slide

  3. Insulator proteins

    View Slide

  4. yellow
    wing blade
    body cuticle
    mouth parts
    denticle belts
    bristles, denticle belts,
    aristae
    tarsal claws
    (Geyer and Corces, Genes and Development, 1992, etc)
    The yellow locus in Drosophila

    View Slide

  5. yellow
    gypsy retrotransposon (700bp)
    wing blade
    body cuticle
    mouth parts
    denticle belts
    bristles, denticle belts,
    aristae
    tarsal claws
    (Geyer and Corces, Genes and Development, 1992, etc)
    The yellow locus in Drosophila

    View Slide

  6. yellow
    gypsy retrotransposon (700bp)
    su(Hw) binding site cluster
    wing blade
    body cuticle
    mouth parts
    denticle belts
    bristles, denticle belts,
    aristae
    tarsal claws
    (Geyer and Corces, Genes and Development, 1992, etc)
    The yellow locus in Drosophila

    View Slide

  7. yellow
    -1868 -+660 +1310 +2940
    -700
    su(Hw) binding site cluster
    wing blade
    body cuticle
    mouth parts
    denticle belts
    bristles, denticle belts,
    aristae
    tarsal claws
    (Geyer and Corces, Genes and Development, 1992, etc)
    The yellow locus in Drosophila

    View Slide

  8. Repression of transcription by su(Hw)
    - 1868
    -800R
    -800
    -700R
    +660R
    +660
    +1310
    +1310R
    +2490R
    body mouth
    wing cuticle hooks TATA
    ~ ' + +
    t
    + i
    " + i
    + i
    + + +
    + + +
    I
    !
    =
    + + + i
    i
    + + + ,
    t
    J
    + + + i
    bristles
    tarsal
    claws
    Figure 2. Summary of y phenotypes in trans-
    formed lines. (Top) The relative location with
    respect to the TATA box of different tissue-
    specific enhancers responsible for the expres-
    sion of the y gene in various tissues. Numbers
    at left indicate the location of the insertion
    site of the su(Hw)-binding region into the y
    gene in the various plasmids used for germ-
    line transformation. Each lane summarizes
    information on transformed lines obtained
    with each plasmid. The position of the in-
    serted sequences relative to various y enhanc-
    ers is indicated diagrammatically by a triangle
    that represents the su(Hw)-binding region;
    the solid circles represent the su(Hw) protein;
    the arrow indicates the orientation of the in-
    serted sequences relative to the y gene. The
    coloration of each tissue is indicated by +
    (wild type) or - (mutant) signs.
    Cold Spring Harbor Laboratory Press
    on November 1, 2015 - Published by
    genesdev.cshlp.org
    Downloaded from
    yellow
    -1868 -+660 +1310 +2940
    -700
    su(Hw) binding site cluster
    Blocks tissue specific
    enhancer activity
    regardless of location
    relative to TSS or
    insert orientation

    View Slide

  9. (West, Gaszner and Felsenfeld, Genes and Development, 2002)
    Insulators (operationally) block enhancer activity

    View Slide

  10. Insulator proteins
    (Yang and Corces, Current Opinion in Genetics & Development, 2012)

    View Slide

  11. (Muravyova et al, Science, 2001)
    con-
    t in-
    The
    ructs
    to
    yel-
    y en-
    d En-
    par-
    white
    ) in-
    as a
    yel-
    es as
    n ar-
    e di-
    tion.
    frag-
    n to
    rizes
    indicating that the yellow gene was activated by its enhancers in the majority of the
    E P O R T S

    View Slide

  12. (Muravyova et al, Science, 2001)
    con-
    t in-
    The
    ructs
    to
    yel-
    y en-
    d En-
    par-
    white
    ) in-
    as a
    yel-
    es as
    n ar-
    e di-
    tion.
    frag-
    n to
    rizes
    indicating that the yellow gene was activated by its enhancers in the majority of the
    E P O R T S

    View Slide

  13. (Muravyova et al, Science, 2001)
    Fig. 2. Transposon constructs to test white enhancer action. The white box (Eye) indicates the eye
    enhancer of the white gene, and the thick arrows marked FRT represent the target sites of the Flp
    recombinase. The other symbols are the same as in Fig. 1. The two columns on the right summarize
    the results, with ϩ indicating that the yellow or white genes were activated by their respective
    R E P O R T S

    View Slide

  14. (Muravyova et al, Science, 2001)
    Fig. 2. Transposon constructs to test white enhancer action. The white box (Eye) indicates the eye
    enhancer of the white gene, and the thick arrows marked FRT represent the target sites of the Flp
    recombinase. The other symbols are the same as in Fig. 1. The two columns on the right summarize
    the results, with ϩ indicating that the yellow or white genes were activated by their respective
    R E P O R T S

    View Slide

  15. (Muravyova et al, Science, 2001)
    pression was studied in a su(Hw)– back-
    ground. In five lines, the absence of Su(Hw)
    protein reduced white expression, implying
    blocked. Howe
    flanked by two
    ed at position
    transcription s
    the yellow gen
    and wings. In
    expression dec
    not change in
    activation of t
    yellow enhanc
    posed insulato
    yellow, the in
    tors between
    promoters may
    stead of block
    lator between
    removed, yield
    expression in
    pressed, showi
    enhancers in the majority of the lines.
    Fig. 3. Model of the double insulator bypass.
    (A) A single insulator blocks enhancer-promot-
    er interaction. (B) Two insulators may interact
    with one another through the protein complex-
    es bound to them, forming a loop and bringing
    the enhancers closer to the promoter.

    View Slide

  16. (Legend on facing page)
    278 GENES & DEVELOPMENT
    (West, Gaszner and Felsenfeld, Genes and Development, 2002)

    View Slide

  17. West et al.
    (West, Gaszner and Felsenfeld, Genes and Development, 2002)

    View Slide

  18. disk cells t
    and either
    left untrea
    green and
    and U are
    DNA visua
    staining is
    the panels.
    the green d
    G–I and pr
    and Y show
    of the resu
    Probes A (g
    treated wil
    (green), B (
    NaCl-extra
    Probes A (g
    NaCl-extra
    (Byrd and Corces, Journal of Cell Biology, 2003)
    Wild type,
    gypsy insulator
    at base of loop
    ct6 mutant has
    another gypsy
    in the middle
    Evidence for insulator loop formation:

    View Slide

  19. Phillips and Corces, Cell, 2009

    View Slide

  20. Insulator proteins
    Architectural Proteins

    View Slide

  21. How do we link CRMs to target genes?

    View Slide

  22. (HapMap SNPs, Expression data from Stranger / Dermitzakis)
    Genetic (eQTL) linking
    chr7:
    3929
    3478
    115750000 115800000
    distal-pTRRs
    Probes from GSE3612 (GPL3090)
    Your Sequence from Blat Search
    UCSC Known Genes (June, 05) Based on UniProt, RefSeq, and GenBank mRNA
    Gencode Reference Genes
    UC Davis ChIP/Chip NimbleGen (C-Myc ab, HeLa Cells)
    University of North Carolina FAIRE Signal
    Myc_stimulated
    CAV2/NM_001233
    CAV1/NM_001753
    AF172085/AF172085
    AC002066.1
    CAV2
    CAV2
    CAV2
    CAV1
    CAV1
    CAV1
    CAV1
    AC006159.3
    UCD C-Myc
    FAIRE Signal
    putative CRM in intron of CAV1
    Expression probes for CAV2
    AA AC
    7.80 7.90 8.00 8.10
    Expression of probe 3478
    ~ Genotype at rs12668226
    Genotype
    AA AC
    7.90 7.95 8.00 8.05 8.10
    Expression of probe 3929
    ~ Genotype at rs12668226
    Genotype
    AA AC
    7.80 7.90 8.00 8.10
    Expression of probe 3478
    ~ Genotype at rs12668226
    Genotype
    AA AC
    7.90 7.95 8.00 8.05 8.10
    Expression of probe 3929
    ~ Genotype at rs12668226
    Genotype
    Allele of SNP in CRM
    associated with expression

    View Slide

  23. Expression
    H3K4me1
    H3K27Ac
    Colors indicate activity annotation across 12 cell types
    Correlation of expression/marks
    across cell types implies link
    Linking through correlated activity

    View Slide

  24. How do we link CRMs to target genes?
    Turn it into a sequencing problem

    View Slide

  25. antibody to chicken C␮ (M1) (Southern Biotechnology
    Associates, Birmingham, AL) and then with polyclonal
    fluorescein isothiocyanate–conjugated goat antibodies
    to mouse IgG (Fab)
    2
    (Sigma). Predominantly sIgM(ϩ)
    subclones were excluded from the analysis, because
    they most likely originated from cells that were already
    sIgM(ϩ) at the time of subcloning.
    23. For Ig light chain sequencing, PCR amplification
    and sequencing of the rearranged light chain V
    segments were performed as previously described
    (19), except that high-fidelity PfuTurbo polymer-
    ase (Stratagene) was used with primer pair V␭1/
    V␭2 for PCR, and primer V␭3 was used for se-
    quencing (17). Only one nucleotide change, which
    most likely reflects a PCR-introduced artifact, was
    noticed in the V-J-3Ј intron region in a total of 80
    0.5-kb-long sequences from AIDϪ/ϪE cells.
    24. We thank M. Reth and T. Brummer for kindly provid-
    ing the MerCreMer plasmid vector; P. Carninci and Y.
    Hayashizaki for construction of the riken1 bursal
    cDNA library; A. Peters and K. Jablonski for excellent
    technical help; and C. Stocking and J. Lo
    ¨hrer for
    carefully reading the manuscript. Supported by grant
    Bu 631/2-1 from the Deutsche Forschungsgemein-
    shaft, by the European Union Framework V programs
    “Chicken Image” and “Genetics in a Cell Line,” and by
    Japan Society for the Promotion of Science Postdoc-
    toral Fellowships for Research Abroad.
    22 October 2001; accepted 18 December 2001
    Capturing Chromosome
    Conformation
    Job Dekker,1* Karsten Rippe,2 Martijn Dekker,3 Nancy Kleckner1
    We describe an approach to detect the frequency of interaction between any
    two genomic loci. Generation of a matrix of interaction frequencies between
    sites on the same or different chromosomes reveals their relative spatial
    disposition and provides information about the physical properties of the
    chromatin fiber. This methodology can be applied to the spatial organization
    of entire genomes in organisms from bacteria to human. Using the yeast
    Saccharomyces cerevisiae, we could confirm known qualitative features of
    chromosome organization within the nucleus and dynamic changes in that
    organization during meiosis. We also analyzed yeast chromosome III at the G
    1
    stage of the cell cycle. We found that chromatin is highly flexible throughout.
    Furthermore, functionally distinct AT- and GC-rich domains were found to
    exhibit different conformations, and a population-average 3D model of chro-
    mosome III could be determined. Chromosome III emerges as a contorted ring.
    Important chromosomal activities have been
    linked with both structural properties and
    spatial conformations of chromosomes. Local
    properties of the chromatin fiber influence
    gene expression, origin firing, and DNA re-
    pair [e.g., (1, 2)]. Higher order structural
    features—such as formation of the 30-nm
    fiber, chromatin loops and axes, and inter-
    chromosomal connections—are important for
    chromosome morphogenesis and also have
    roles in gene expression and recombination.
    Activities such as transcription and timing of
    replication have been related to overall spa-
    affords a resolution of 100 to 200 nm at best,
    which is insufficient to define chromosome
    conformation. DNA binding proteins fused to
    green fluorescent protein permit visualization
    of individual loci, but only a few positions
    can be examined simultaneously. Multiple
    loci can be visualized with fluorescence in
    situ hybridization (FISH), but this requires
    severe treatment that may affect chromosome
    organization.
    We developed a high-throughput method-
    ology, Chromosome Conformation Capture
    (3C), which can be used to analyze the over-
    of purified nuclei is largely intact, as shown
    below.
    For quantification of cross-linking fre-
    quencies, cross-linked DNA is digested with
    a restriction enzyme and then subjected to
    ligation at very low DNA concentration. Un-
    der such conditions, ligation of cross-linked
    fragments, which is intramolecular, is strong-
    ly favored over ligation of random fragments,
    which is intermolecular. Cross-linking is then
    reversed and individual ligation products are
    detected and quantified by the polymerase
    chain reaction (PCR) using locus-specific
    primers. Control template is generated in
    which all possible ligation products are
    present in equal abundance (7). The cross-
    linking frequency (X) of two specific loci is
    determined by quantitative PCR reactions us-
    ing control and cross-linked templates, and X
    is expressed as the ratio of the amount of
    product obtained using the cross-linked tem-
    plate to the amount of product obtained with
    the control template (Fig. 1B). X should be
    directly proportional to the frequency with
    which the two corresponding genomic sites
    interact (10).
    Control experiments show that formation
    of ligation products is strictly dependent on
    both ligation and cross-linking (Fig. 1C). In
    general, X decreases with increasing separa-
    tion distance in kb along chromosome III
    (“genomic site separation”). Cross-linking
    frequencies for both the left telomere and the
    centromere of chromosome III with each of
    R E P O R T S
    on April 19, 2012
    www.sciencemag.org
    Downloaded from
    sites on the same or different chromosomes reveals their relative spatial
    disposition and provides information about the physical properties of the
    chromatin fiber. This methodology can be applied to the spatial organization
    of entire genomes in organisms from bacteria to human. Using the yeast
    Saccharomyces cerevisiae, we could confirm known qualitative features of
    chromosome organization within the nucleus and dynamic changes in that
    organization during meiosis. We also analyzed yeast chromosome III at the G
    1
    stage of the cell cycle. We found that chromatin is highly flexible throughout.
    Furthermore, functionally distinct AT- and GC-rich domains were found to
    exhibit different conformations, and a population-average 3D model of chro-
    mosome III could be determined. Chromosome III emerges as a contorted ring.
    Important chromosomal activities have been
    linked with both structural properties and
    spatial conformations of chromosomes. Local
    properties of the chromatin fiber influence
    gene expression, origin firing, and DNA re-
    pair [e.g., (1, 2)]. Higher order structural
    features—such as formation of the 30-nm
    fiber, chromatin loops and axes, and inter-
    chromosomal connections—are important for
    chromosome morphogenesis and also have
    roles in gene expression and recombination.
    Activities such as transcription and timing of
    replication have been related to overall spa-
    tial nuclear disposition of different regions
    and their relationships to the nuclear enve-
    lope [e.g., (3–6)]. At each of these levels,
    chromosome organization is highly dynamic,
    varying both during the cell cycle and among
    different cell types.
    Analysis of chromosome conformation is
    complicated by technical limitations. Elec-
    tron microscopy, while affording high reso-
    lution, is laborious and not easily applicable
    to studies of specific loci. Light microscopy
    affords a resolution of 100 to 200 nm at best,
    which is insufficient to define chromosome
    conformation. DNA binding proteins fused to
    green fluorescent protein permit visualization
    of individual loci, but only a few positions
    can be examined simultaneously. Multiple
    loci can be visualized with fluorescence in
    situ hybridization (FISH), but this requires
    severe treatment that may affect chromosome
    organization.
    We developed a high-throughput method-
    ology, Chromosome Conformation Capture
    (3C), which can be used to analyze the over-
    all spatial organization of chromosomes and
    to investigate their physical properties at high
    resolution. The principle of our approach is
    outlined in Fig. 1A (7). Intact nuclei are
    isolated (8) and subjected to formaldehyde
    fixation, which cross-links proteins to other
    proteins and to DNA. The overall result is
    cross-linking of physically touching seg-
    ments throughout the genome via contacts
    between their DNA-bound proteins. The rel-
    ative frequencies with which different sites
    have become cross-linked are then deter-
    mined. Analysis of genome-wide interaction
    frequencies provides information about gen-
    eral nuclear organization as well as physical
    properties and conformations of chromo-
    somes. We have used intact yeast nuclei for
    all experiments. Although the method can be
    performed using intact cells, the signals are
    considerably lower, making quantification
    difficult (9). The general nuclear organization
    which is intermolecular. Cross-linking is then
    reversed and individual ligation products are
    detected and quantified by the polymerase
    chain reaction (PCR) using locus-specific
    primers. Control template is generated in
    which all possible ligation products are
    present in equal abundance (7). The cross-
    linking frequency (X) of two specific loci is
    determined by quantitative PCR reactions us-
    ing control and cross-linked templates, and X
    is expressed as the ratio of the amount of
    product obtained using the cross-linked tem-
    plate to the amount of product obtained with
    the control template (Fig. 1B). X should be
    directly proportional to the frequency with
    which the two corresponding genomic sites
    interact (10).
    Control experiments show that formation
    of ligation products is strictly dependent on
    both ligation and cross-linking (Fig. 1C). In
    general, X decreases with increasing separa-
    tion distance in kb along chromosome III
    (“genomic site separation”). Cross-linking
    frequencies for both the left telomere and the
    centromere of chromosome III with each of
    12 other positions along that same chromo-
    some (Fig. 1, C and D) were determined
    using nuclei isolated from exponentially
    growing haploid cells. Interestingly, the two
    telomeres of chromosome III interact more
    frequently than predicted from their genomic
    site separation, which suggests that the chro-
    mosome ends are in close spatial proximity.
    This is expected because yeast telomeres are
    known to occur in clusters (11, 12).
    We next applied our method to an analysis
    of centromeres and of homologous chromo-
    somes (“homologs”) during meiosis in yeast
    (7). In mitotic and premeiotic cells, centro-
    meres are clustered near the spindle pole
    body (13, 14) and homologous chromosomes
    are loosely associated (15–17). These fea-
    tures change markedly when cells enter mei-
    osis (13). The centromere cluster is rapidly
    lost and is not restored until just before the
    first meiotic division. Loose interactions be-
    1Department of Molecular and Cellular Biology, Har-
    vard University, Cambridge, MA 02138, USA. 2Mole-
    kulare Genetik (H0700), Deutsches Krebsforschungs-
    zentrum, Im Neuenheimer Feld 280, and Kirchhoff-
    Institut fu
    ¨r Physik, Physik Molekularbiologischer Pro-
    zesse, Universita
    ¨t Heidelberg, Schro
    ¨derstrasse 90,
    D-69120 Heidelberg, Germany. 32e Oosterparklaan
    272, 3544 AX Utrecht, Netherlands.
    *To whom correspondence should be addressed. E-
    mail: [email protected]
    15 FEBRUARY 2002 VOL 295 SCIENCE www.sciencemag.org
    1306
    on April 19, 201
    www.sciencemag.org
    Downloaded from

    View Slide

  26. Chromatin Conformation Capture = 3C
    Dekker et al. 2002

    View Slide

  27. Dekker et al, Science, 2002
    Chromosome conformation capture (3C)
    genomic DNA
    interaction complex

    View Slide

  28. cross linked interaction

    View Slide

  29. restriction enzyme
    cut sites

    View Slide

  30. View Slide

  31. Ligate cut ends

    View Slide

  32. 3C library contains many such ligation products
    A given ligation product can be quantified
    using specific PCR primers

    View Slide

  33. Dekker et al. 2002

    View Slide

  34. 3C allows us to target one or a few
    specific interactions
    Can this be applied genome wide?

    View Slide

  35. (D.R.B.). The contents are the responsibility of the
    authors and 
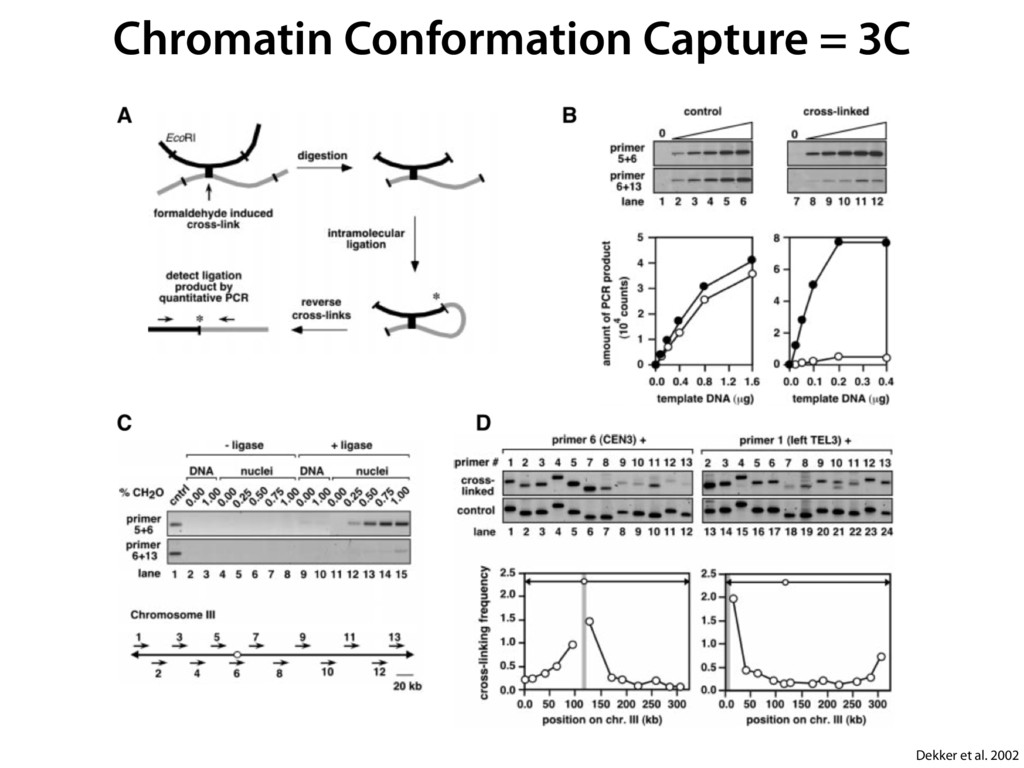
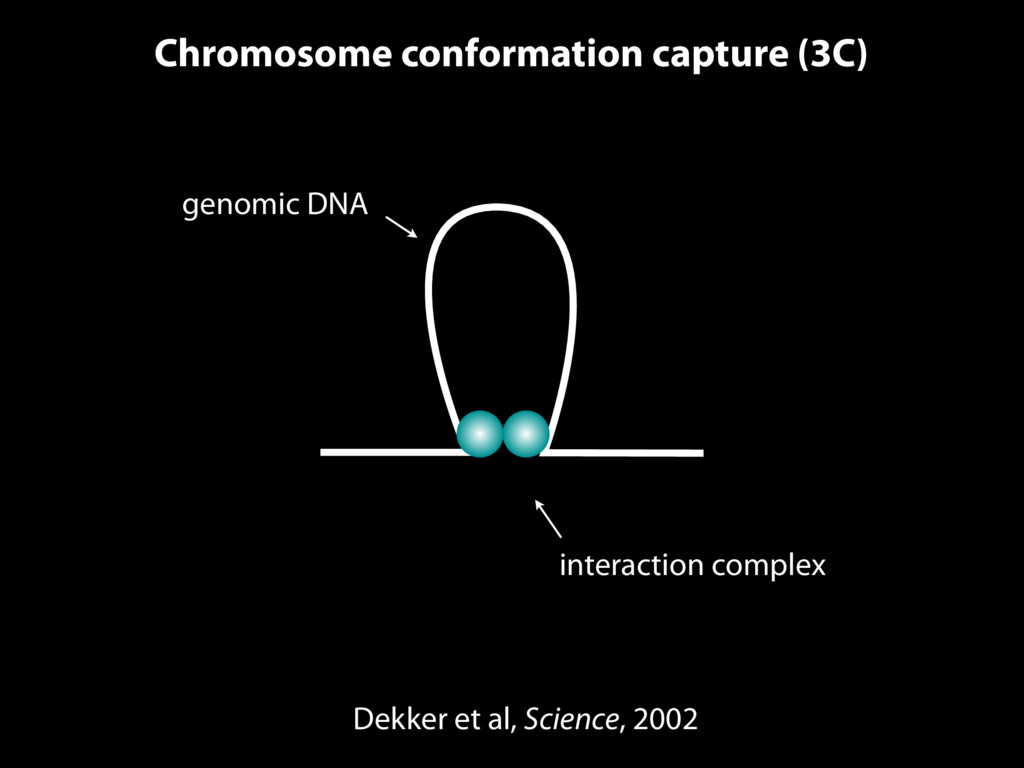
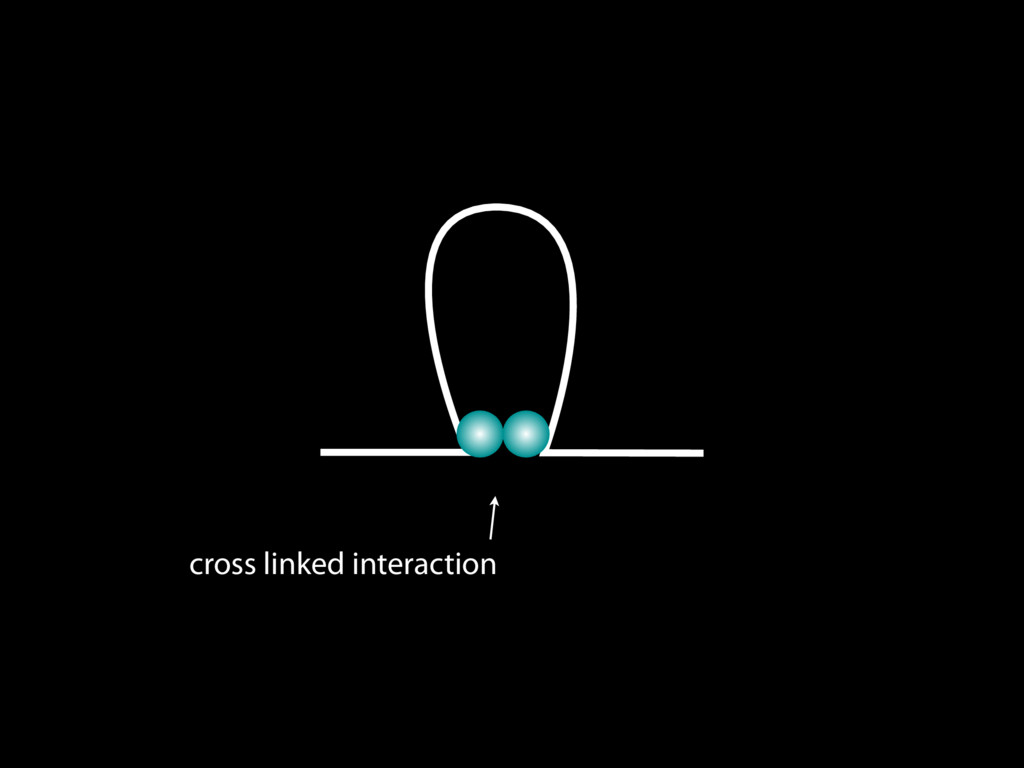
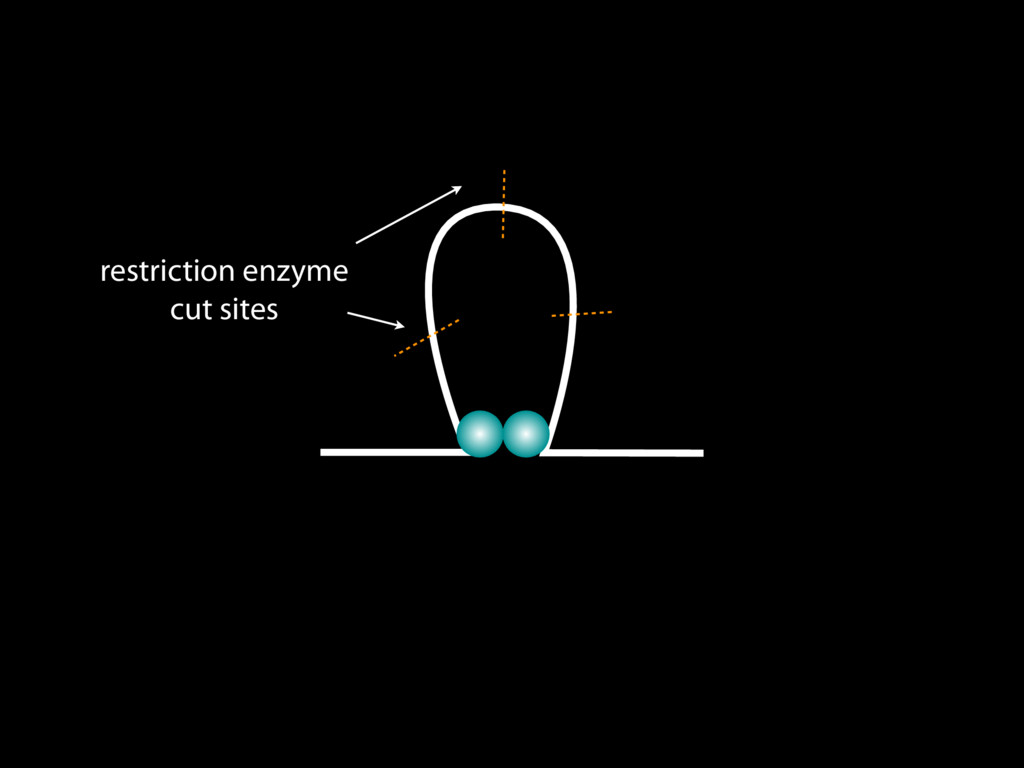
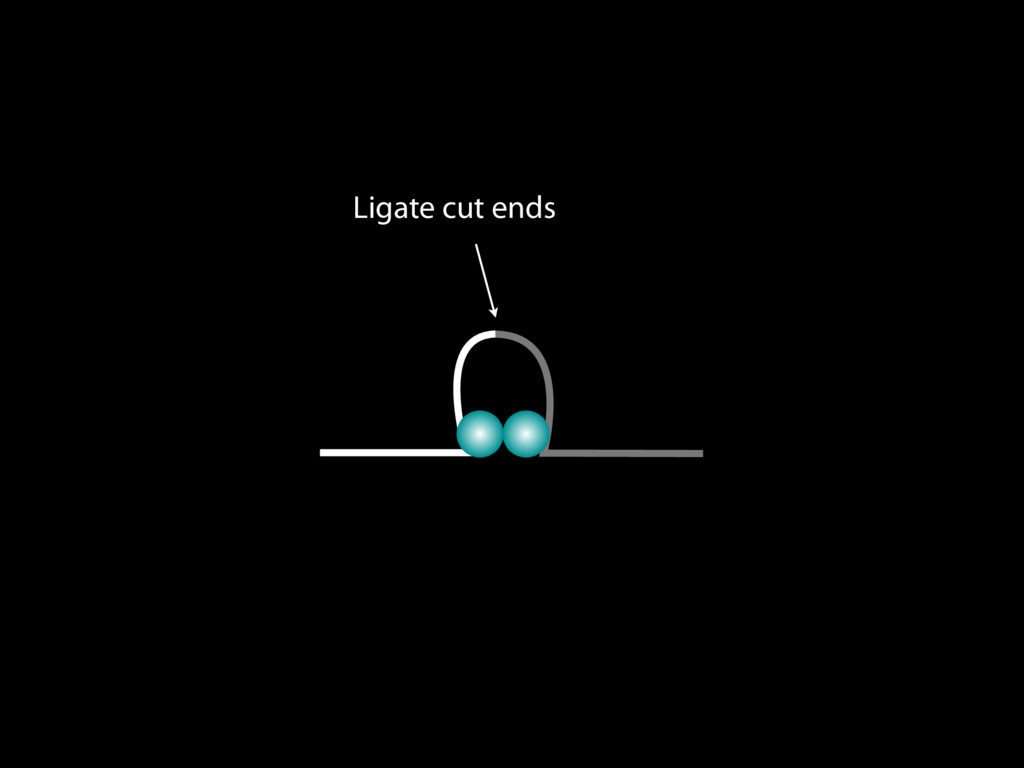
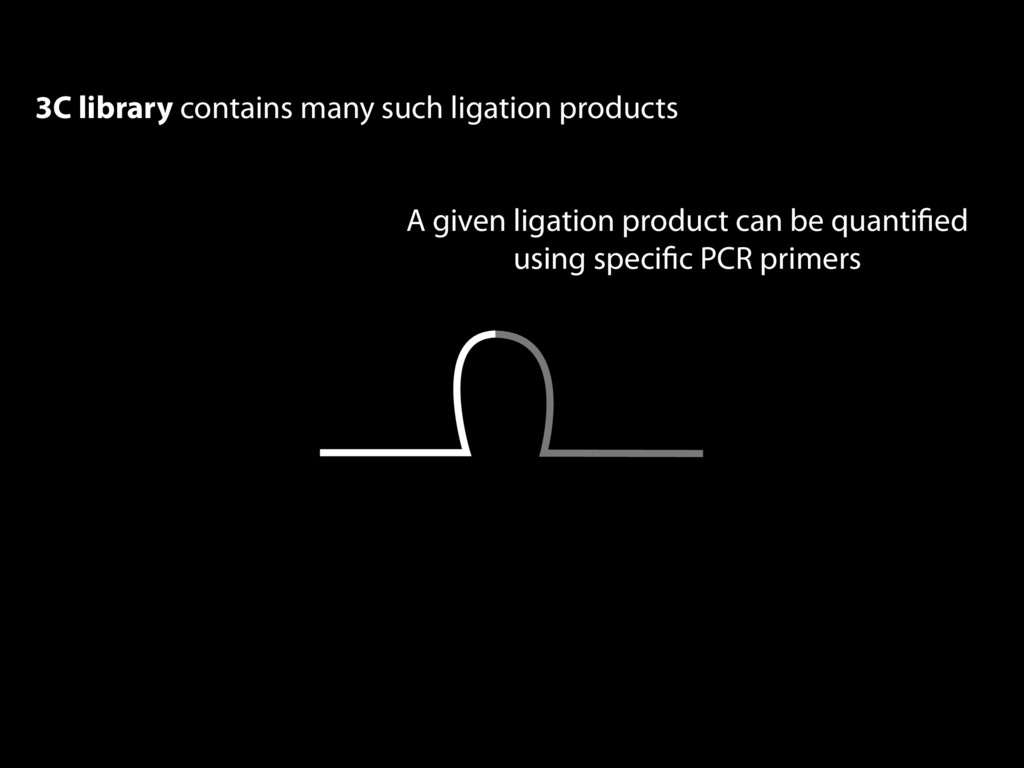
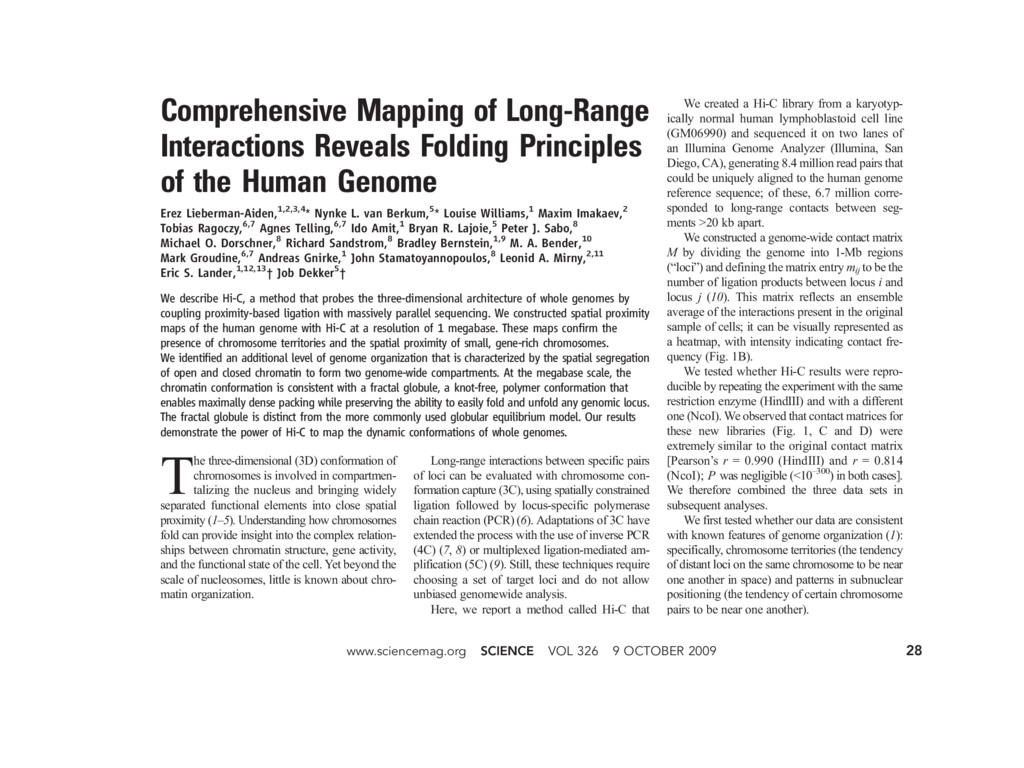
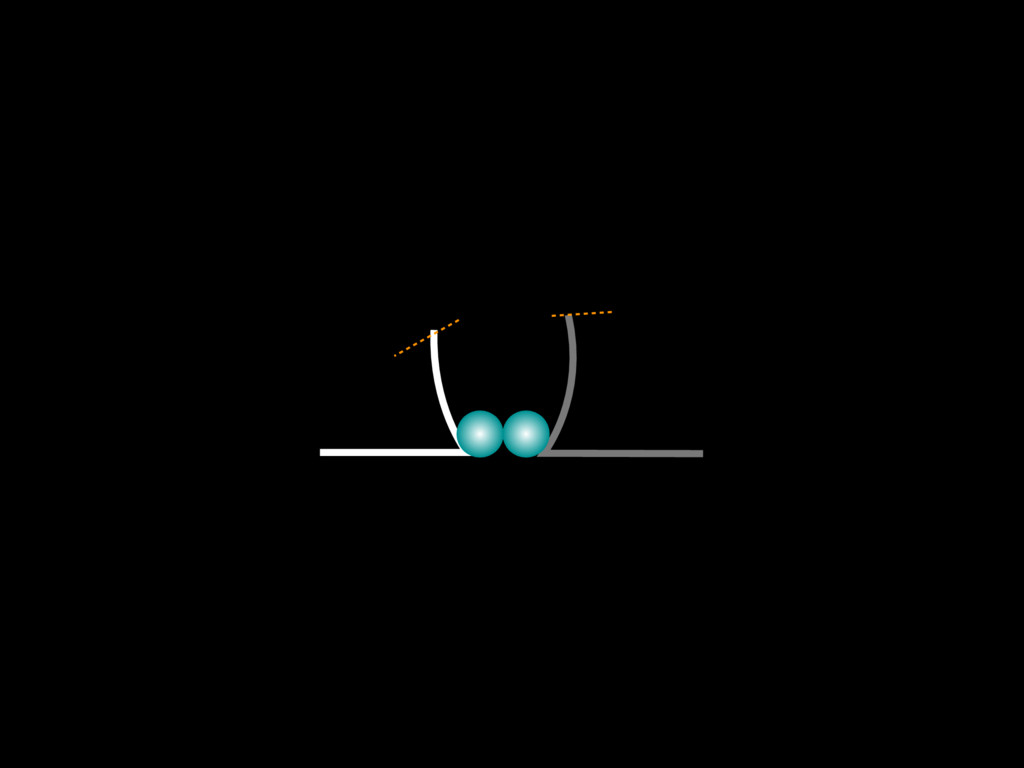
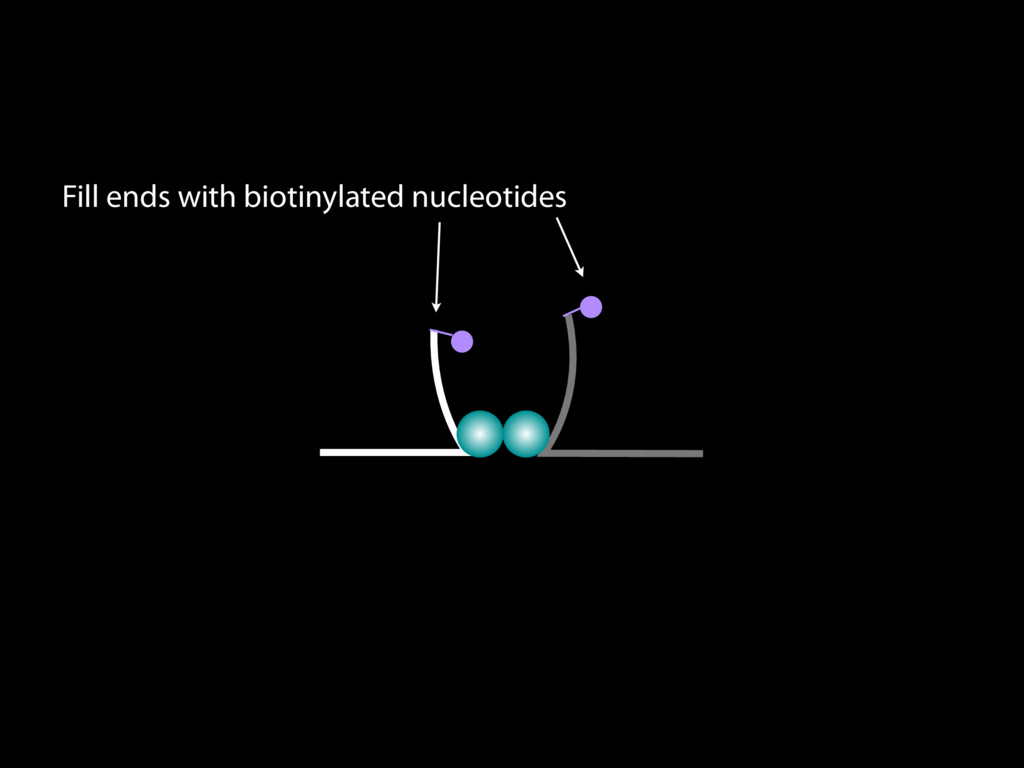
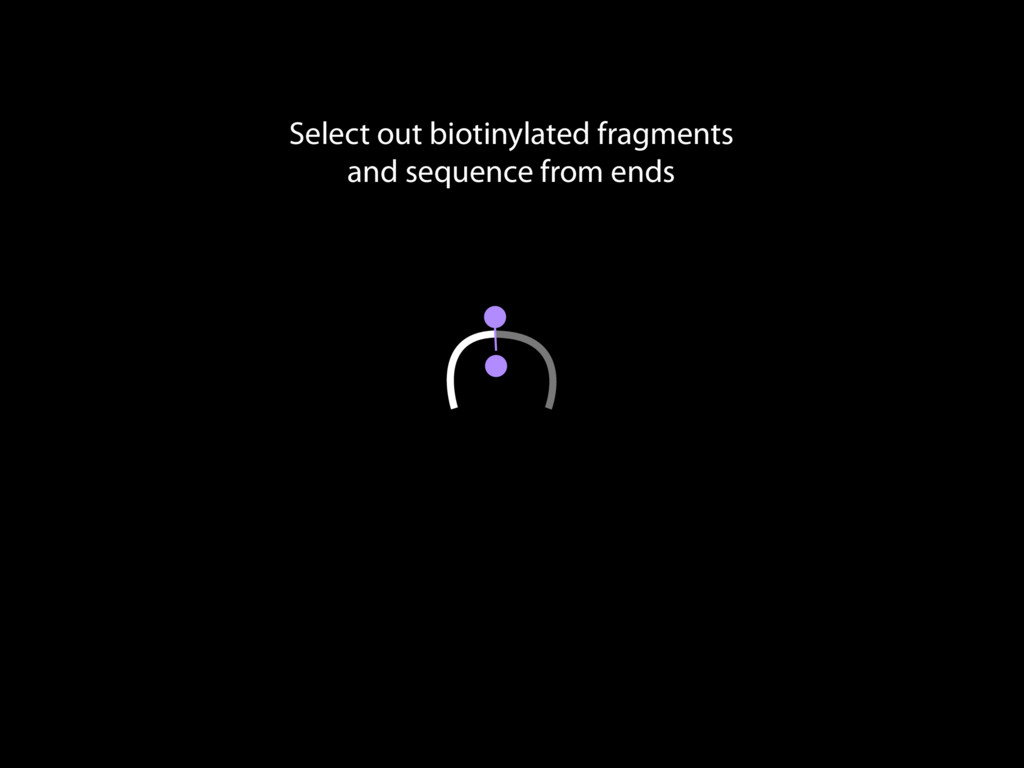
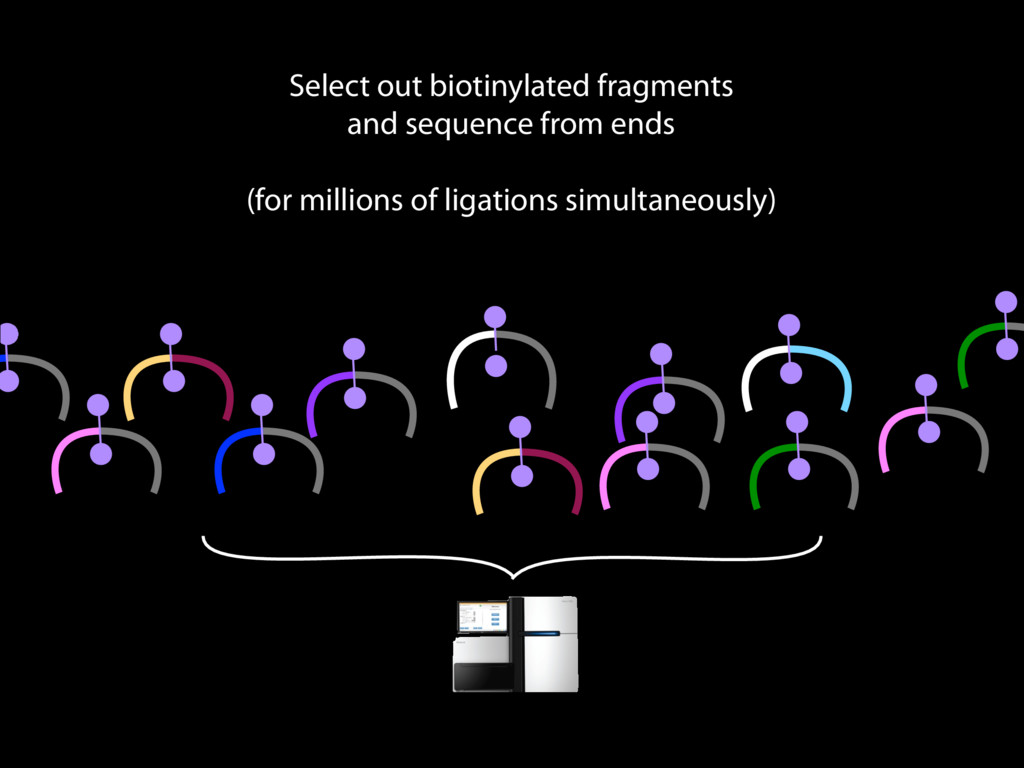
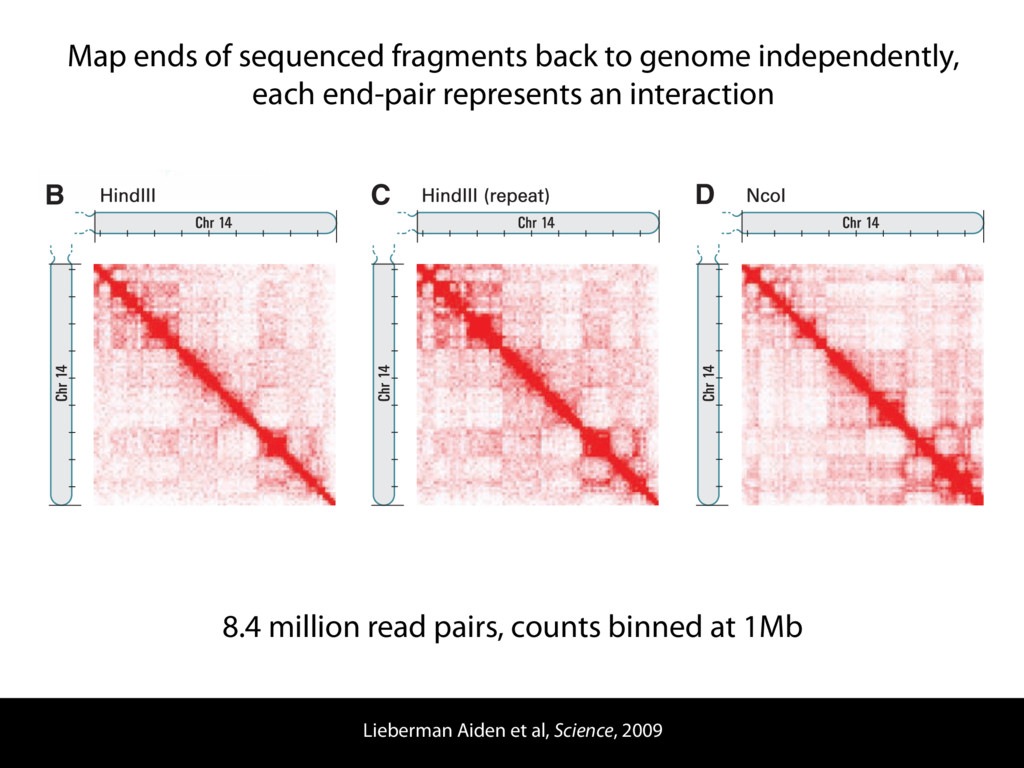
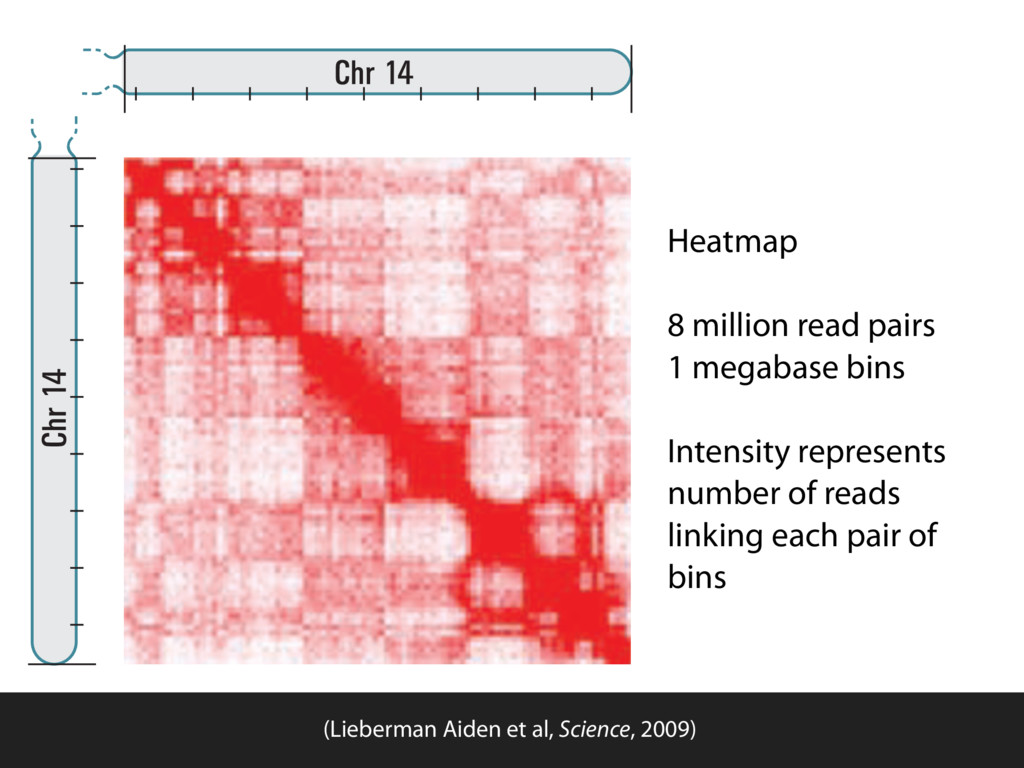
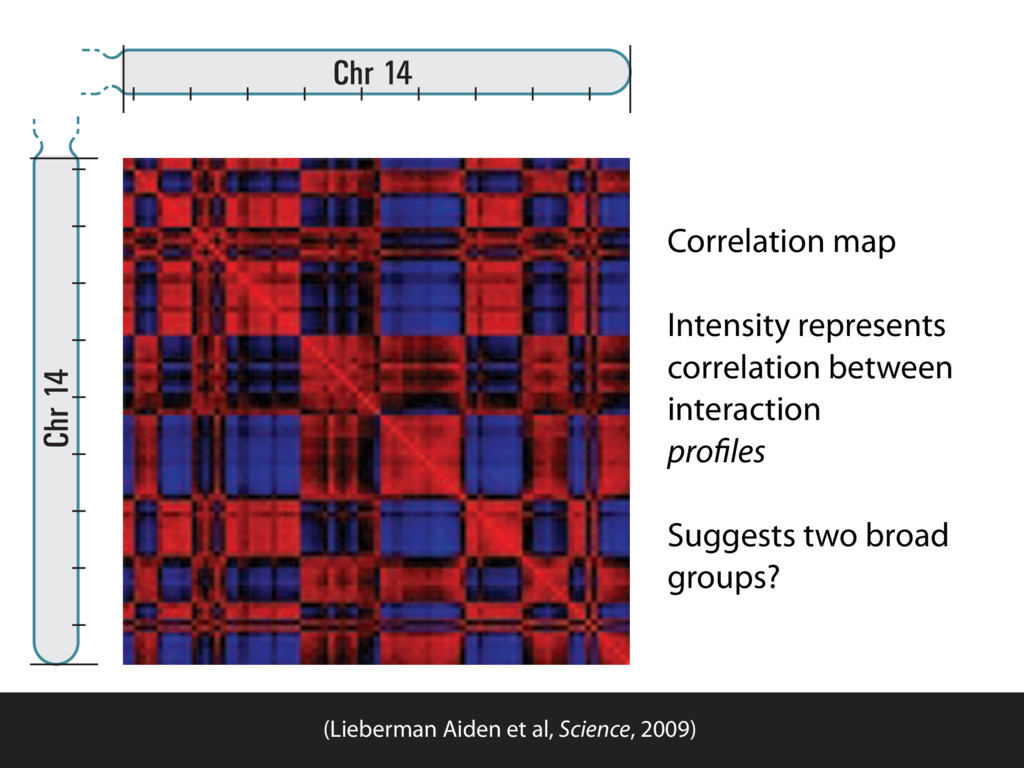
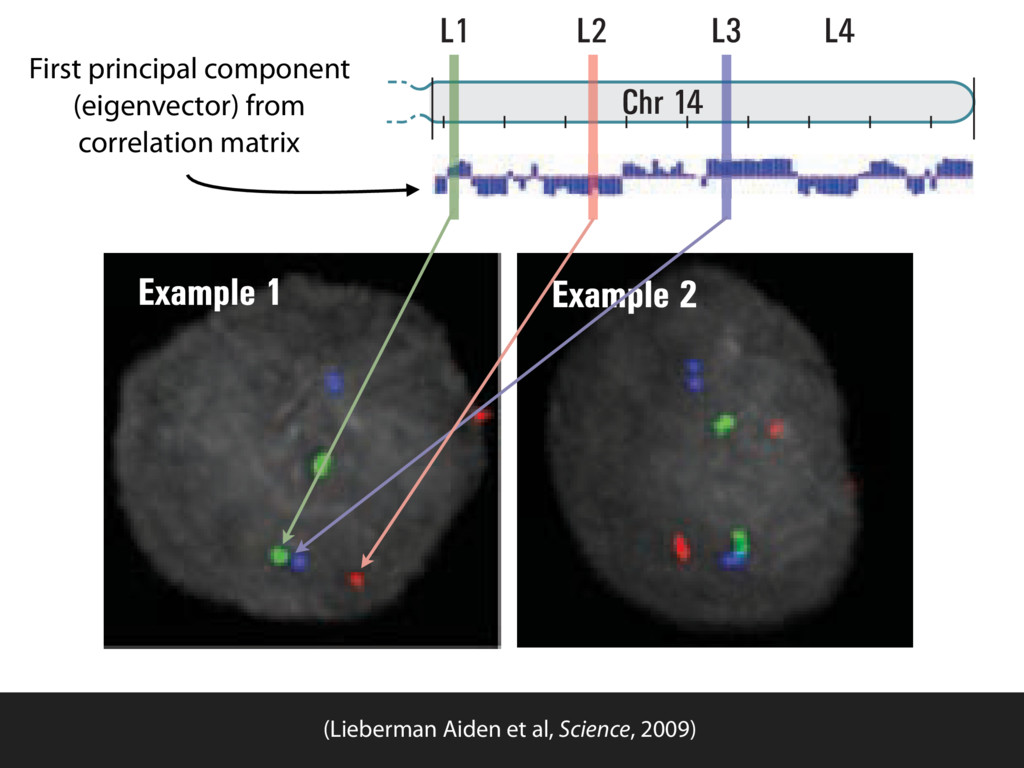
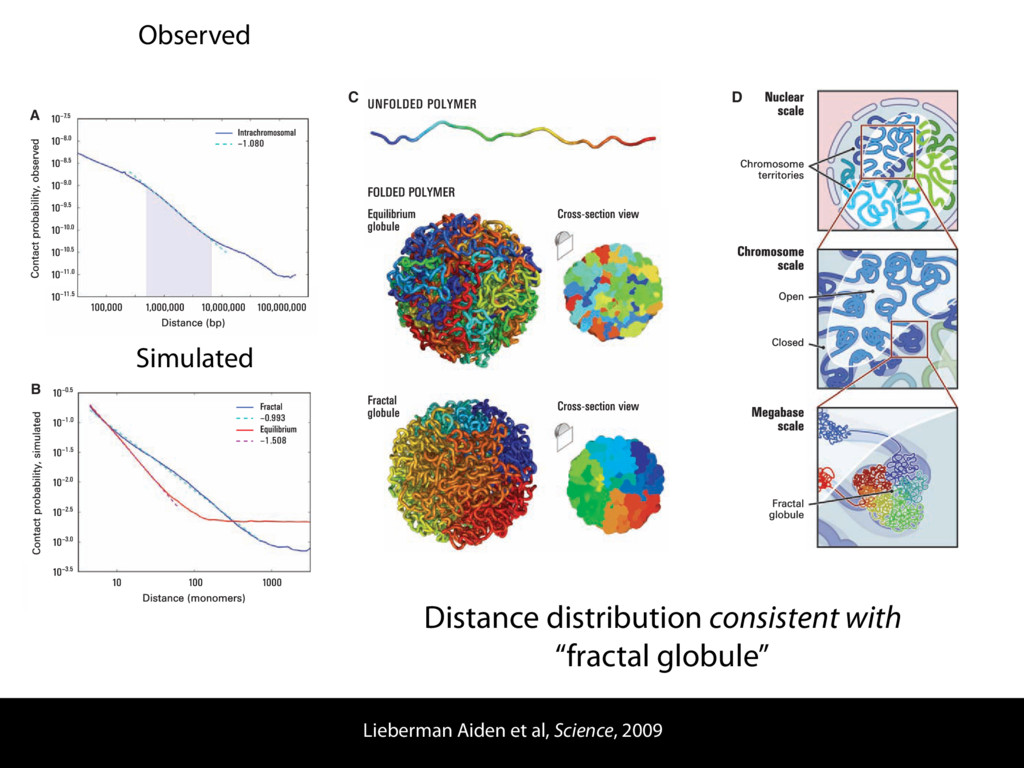
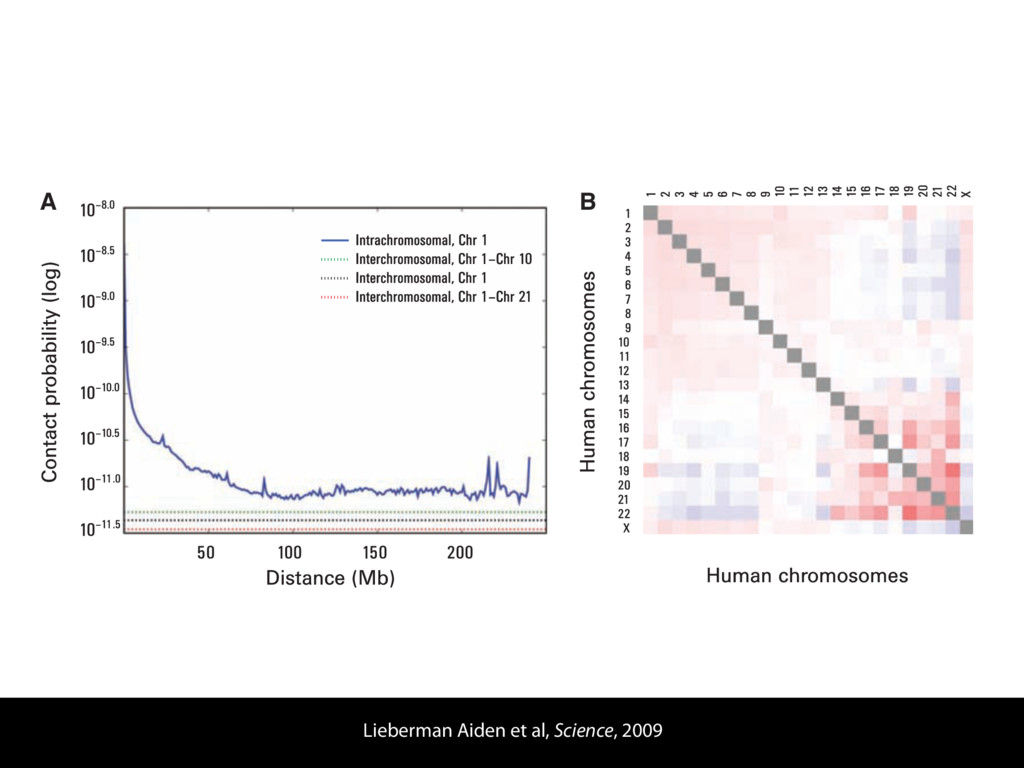
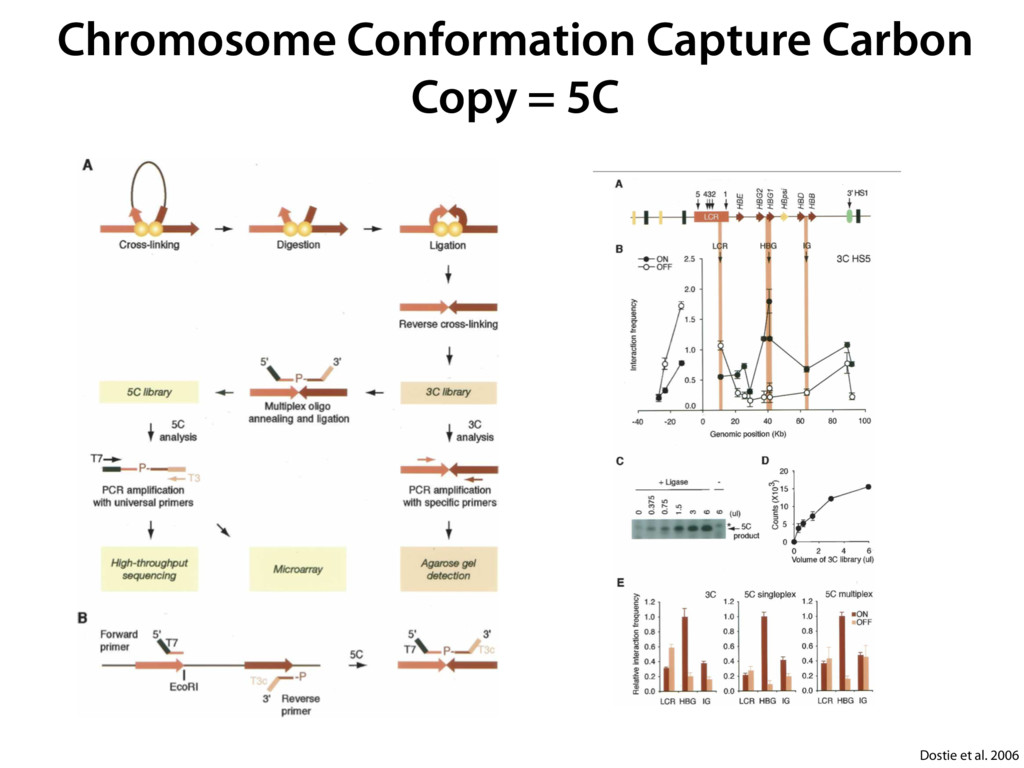
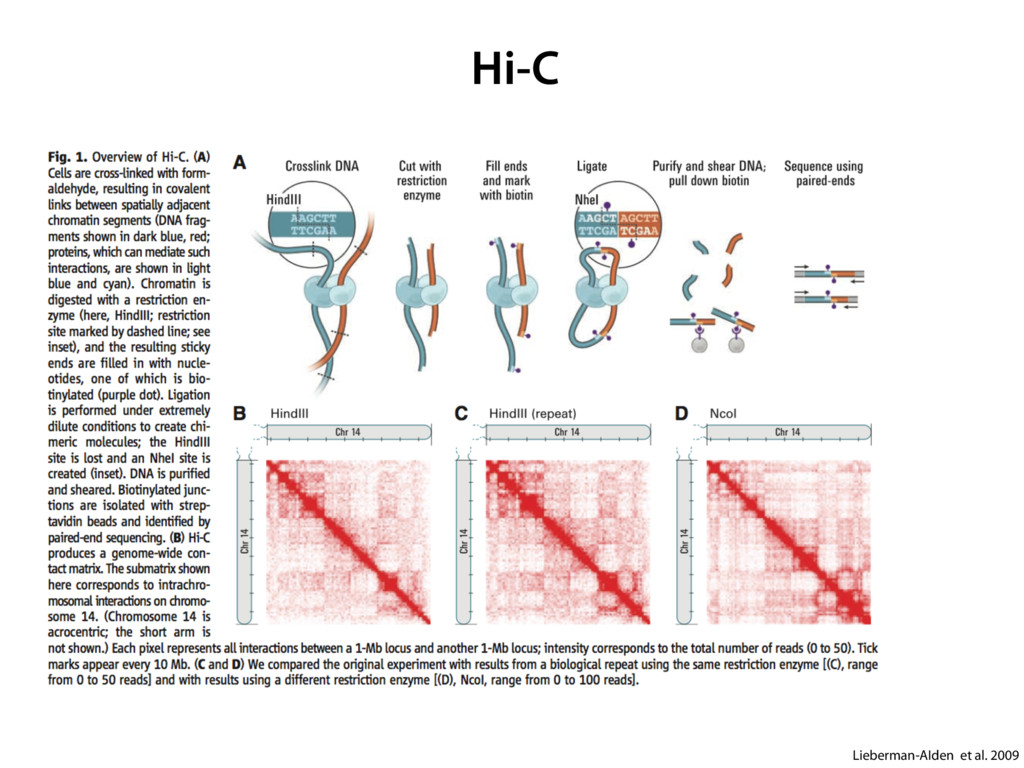
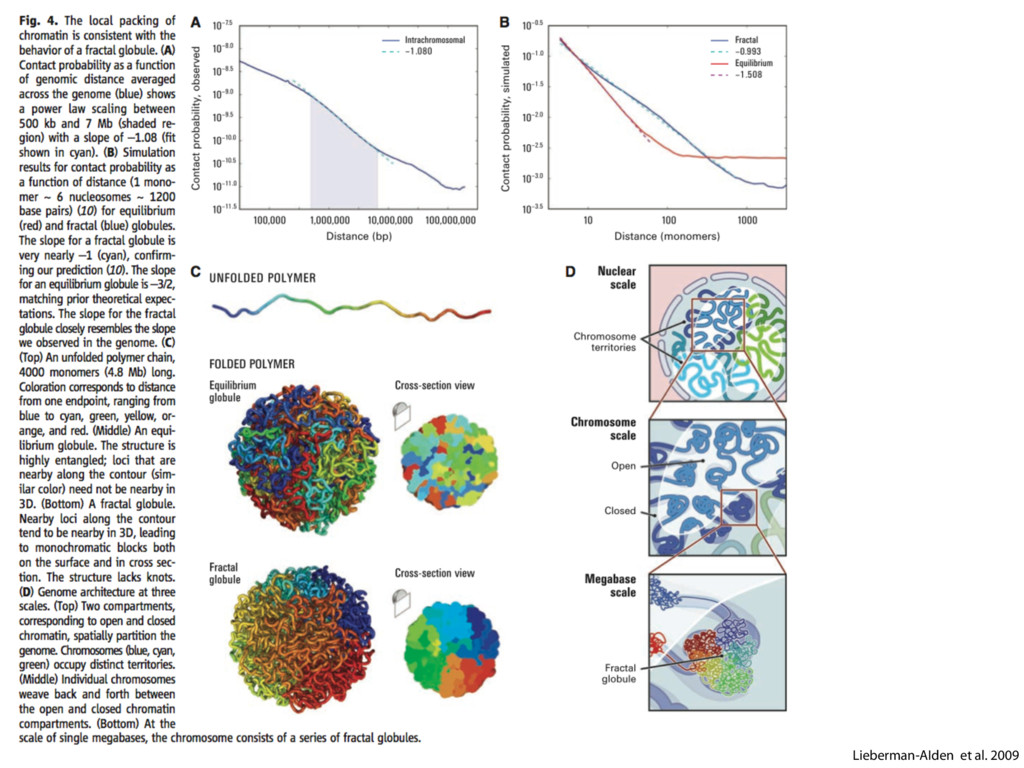
do not necessarily reflect the views of USAID
    or the U.S. government. The authors declare competing
    financial interests. Protocol G Principal Investigators:
    G. Miiro, J. Serwanga, A. Pozniak, D. McPhee,
    Supporting Online Material
    www.sciencemag.org/cgi/content/full/1178746/DC1
    Materials and Methods
    SOM Text
    7 July 2009; accepted 26 August 2009
    Published online 3 September 2009;
    10.1126/science.1178746
    Include this information when citing this paper.
    Comprehensive Mapping of Long-Range
    Interactions Reveals Folding Principles
    of the Human Genome
    Erez Lieberman-Aiden,1,2,3,4* Nynke L. van Berkum,5* Louise Williams,1 Maxim Imakaev,2
    Tobias Ragoczy,6,7 Agnes Telling,6,7 Ido Amit,1 Bryan R. Lajoie,5 Peter J. Sabo,8
    Michael O. Dorschner,8 Richard Sandstrom,8 Bradley Bernstein,1,9 M. A. Bender,10
    Mark Groudine,6,7 Andreas Gnirke,1 John Stamatoyannopoulos,8 Leonid A. Mirny,2,11
    Eric S. Lander,1,12,13† Job Dekker5†
    We describe Hi-C, a method that probes the three-dimensional architecture of whole genomes by
    coupling proximity-based ligation with massively parallel sequencing. We constructed spatial proximity
    maps of the human genome with Hi-C at a resolution of 1 megabase. These maps confirm the
    presence of chromosome territories and the spatial proximity of small, gene-rich chromosomes.
    We identified an additional level of genome organization that is characterized by the spatial segregation
    of open and closed chromatin to form two genome-wide compartments. At the megabase scale, the
    chromatin conformation is consistent with a fractal globule, a knot-free, polymer conformation that
    enables maximally dense packing while preserving the ability to easily fold and unfold any genomic locus.
    The fractal globule is distinct from the more commonly used globular equilibrium model. Our results
    demonstrate the power of Hi-C to map the dynamic conformations of whole genomes.
    The three-dimensional (3D) conformation of
    chromosomes is involved in compartmen-
    talizing the nucleus and bringing widely
    separated functional elements into close spatial
    proximity (1–5). Understanding how chromosomes
    fold can provide insight into the complex relation-
    ships between chromatin structure, gene activity,
    and the functional state of the cell. Yet beyond the
    scale of nucleosomes, little is known about chro-
    matin organization.
    Long-range interactions between specific pairs
    of loci can be evaluated with chromosome con-
    formation capture (3C), using spatially constrained
    ligation followed by locus-specific polymerase
    chain reaction (PCR) (6). Adaptations of 3C have
    extended the process with the use of inverse PCR
    (4C) (7, 8) or multiplexed ligation-mediated am-
    plification (5C) (9). Still, these techniques require
    choosing a set of target loci and do not allow
    unbiased genomewide analysis.
    Here, we report a method called Hi-C that
    adapts the above approach to enable purification
    of ligation products followed by massively par-
    allel sequencing. Hi-C allows unbiased identifi-
    cation of chromatin interactions across an entire
    genome.We briefly summarize the process: cells
    are crosslinked with formaldehyde; DNA is di-
    gested with a restriction enzyme that leaves a 5′
    overhang; the 5′ overhang is filled, including a
    biotinylated residue; and the resulting blunt-end
    fragments are ligated under dilute conditions that
    We created a Hi-C library from a karyotyp-
    ically normal human lymphoblastoid cell line
    (GM06990) and sequenced it on two lanes of
    an Illumina Genome Analyzer (Illumina, San
    Diego, CA), generating 8.4 million read pairs that
    could be uniquely aligned to the human genome
    reference sequence; of these, 6.7 million corre-
    sponded to long-range contacts between seg-
    ments >20 kb apart.
    We constructed a genome-wide contact matrix
    M by dividing the genome into 1-Mb regions
    (“loci”) and defining the matrix entry mij
    to be the
    number of ligation products between locus i and
    locus j (10). This matrix reflects an ensemble
    average of the interactions present in the original
    sample of cells; it can be visually represented as
    a heatmap, with intensity indicating contact fre-
    quency (Fig. 1B).
    We tested whether Hi-C results were repro-
    ducible by repeating the experiment with the same
    restriction enzyme (HindIII) and with a different
    one (NcoI). We observed that contact matrices for
    these new libraries (Fig. 1, C and D) were
    extremely similar to the original contact matrix
    [Pearson’s r = 0.990 (HindIII) and r = 0.814
    (NcoI); P was negligible (<10–300) in both cases].
    We therefore combined the three data sets in
    subsequent analyses.
    We first tested whether our data are consistent
    with known features of genome organization (1):
    specifically, chromosome territories (the tendency
    of distant loci on the same chromosome to be near
    one another in space) and patterns in subnuclear
    positioning (the tendency of certain chromosome
    pairs to be near one another).
    We calculated the average intrachromosomal
    contact probability, In
    (s), for pairs of loci sepa-
    rated by a genomic distance s (distance in base
    pairs along the nucleotide sequence) on chromo-
    some n. In
    (s) decreases monotonically on every
    chromosome, suggesting polymer-like behavior
    in which the 3D distance between loci increases
    with increasing genomic distance; these findings
    are in agreement with 3C and fluorescence in situ
    hybridization (FISH) (6, 11). Even at distances
    1Broad Institute of Harvard and Massachusetts Institute of
    Technology (MIT), MA 02139, USA. 2Division of Health
    Sciences and Technology, MIT, Cambridge, MA 02139,
    USA. 3Program for Evolutionary Dynamics, Department of
    Organismic and Evolutionary Biology, Department of Math-
    ematics, Harvard University, Cambridge, MA 02138, USA.
    4Department of Applied Mathematics, Harvard University,
    Cambridge, MA 02138, USA. 5Program in Gene Function
    and Expression and Department of Biochemistry and Mo-
    lecular Pharmacology, University of Massachusetts Medical
    School, Worcester, MA 01605, USA. 6Fred Hutchinson Can-
    cer Research Center, Seattle, WA 98109, USA. 7Department
    on April 19, 2012
    www.sciencemag.org
    Downloaded from
    coupling proximity-based ligation with massively parallel sequencing. We constructed spatial proximity
    maps of the human genome with Hi-C at a resolution of 1 megabase. These maps confirm the
    presence of chromosome territories and the spatial proximity of small, gene-rich chromosomes.
    We identified an additional level of genome organization that is characterized by the spatial segregation
    of open and closed chromatin to form two genome-wide compartments. At the megabase scale, the
    chromatin conformation is consistent with a fractal globule, a knot-free, polymer conformation that
    enables maximally dense packing while preserving the ability to easily fold and unfold any genomic locus.
    The fractal globule is distinct from the more commonly used globular equilibrium model. Our results
    demonstrate the power of Hi-C to map the dynamic conformations of whole genomes.
    The three-dimensional (3D) conformation of
    chromosomes is involved in compartmen-
    talizing the nucleus and bringing widely
    separated functional elements into close spatial
    proximity (1–5). Understanding how chromosomes
    fold can provide insight into the complex relation-
    ships between chromatin structure, gene activity,
    and the functional state of the cell. Yet beyond the
    scale of nucleosomes, little is known about chro-
    matin organization.
    Long-range interactions between specific pairs
    of loci can be evaluated with chromosome con-
    formation capture (3C), using spatially constrained
    ligation followed by locus-specific polymerase
    chain reaction (PCR) (6). Adaptations of 3C have
    extended the process with the use of inverse PCR
    (4C) (7, 8) or multiplexed ligation-mediated am-
    plification (5C) (9). Still, these techniques require
    choosing a set of target loci and do not allow
    unbiased genomewide analysis.
    Here, we report a method called Hi-C that
    adapts the above approach to enable purification
    of ligation products followed by massively par-
    allel sequencing. Hi-C allows unbiased identifi-
    cation of chromatin interactions across an entire
    genome.We briefly summarize the process: cells
    are crosslinked with formaldehyde; DNA is di-
    gested with a restriction enzyme that leaves a 5′
    overhang; the 5′ overhang is filled, including a
    biotinylated residue; and the resulting blunt-end
    fragments are ligated under dilute conditions that
    favor ligation events between the cross-linked
    DNA fragments. The resulting DNA sample con-
    tains ligation products consisting of fragments
    that were originally in close spatial proximity in
    the nucleus, marked with biotin at the junction.
    A Hi-C library is created by shearing the DNA
    and selecting the biotin-containing fragments
    with streptavidin beads. The library is then ana-
    lyzed by using massively parallel DNA sequenc-
    ing, producing a catalog of interacting fragments
    (Fig. 1A) (10).
    average of the interactions present in the original
    sample of cells; it can be visually represented as
    a heatmap, with intensity indicating contact fre-
    quency (Fig. 1B).
    We tested whether Hi-C results were repro-
    ducible by repeating the experiment with the same
    restriction enzyme (HindIII) and with a different
    one (NcoI). We observed that contact matrices for
    these new libraries (Fig. 1, C and D) were
    extremely similar to the original contact matrix
    [Pearson’s r = 0.990 (HindIII) and r = 0.814
    (NcoI); P was negligible (<10–300) in both cases].
    We therefore combined the three data sets in
    subsequent analyses.
    We first tested whether our data are consistent
    with known features of genome organization (1):
    specifically, chromosome territories (the tendency
    of distant loci on the same chromosome to be near
    one another in space) and patterns in subnuclear
    positioning (the tendency of certain chromosome
    pairs to be near one another).
    We calculated the average intrachromosomal
    contact probability, In
    (s), for pairs of loci sepa-
    rated by a genomic distance s (distance in base
    pairs along the nucleotide sequence) on chromo-
    some n. In
    (s) decreases monotonically on every
    chromosome, suggesting polymer-like behavior
    in which the 3D distance between loci increases
    with increasing genomic distance; these findings
    are in agreement with 3C and fluorescence in situ
    hybridization (FISH) (6, 11). Even at distances
    greater than 200 Mb, In
    (s) is always much greater
    than the average contact probability between dif-
    ferent chromosomes (Fig. 2A). This implies the
    existence of chromosome territories.
    Interchromosomal contact probabilities be-
    tween pairs of chromosomes (Fig. 2B) show
    that small, gene-rich chromosomes (chromosomes
    16, 17, 19, 20, 21, and 22) preferentially interact
    with each other. This is consistent with FISH
    studies showing that these chromosomes fre-
    quently colocalize in the center of the nucleus
    1Broad Institute of Harvard and Massachusetts Institute of
    Technology (MIT), MA 02139, USA. 2Division of Health
    Sciences and Technology, MIT, Cambridge, MA 02139,
    USA. 3Program for Evolutionary Dynamics, Department of
    Organismic and Evolutionary Biology, Department of Math-
    ematics, Harvard University, Cambridge, MA 02138, USA.
    4Department of Applied Mathematics, Harvard University,
    Cambridge, MA 02138, USA. 5Program in Gene Function
    and Expression and Department of Biochemistry and Mo-
    lecular Pharmacology, University of Massachusetts Medical
    School, Worcester, MA 01605, USA. 6Fred Hutchinson Can-
    cer Research Center, Seattle, WA 98109, USA. 7Department
    of Radiation Oncology, University of Washington School of
    Medicine, Seattle, WA 98195, USA. 8Department of Genome
    Sciences, University of Washington, Seattle, WA 98195, USA.
    9Department of Pathology, Harvard Medical School, Boston, MA
    02115, USA. 10Department of Pediatrics, University of Wash-
    ington, Seattle, WA 98195, USA. 11Department of Physics, MIT,
    Cambridge, MA 02139, USA. 12Department of Biology, MIT,
    Cambridge, MA 02139, USA. 13Department of Systems Biol-
    ogy, Harvard Medical School, Boston, MA 02115, USA.
    *These authors contributed equally to this work.
    †To whom correspondence should be addressed. E-mail:
    [email protected] (E.S.L.); job.dekker@umassmed.
    edu (J.D.)
    www.sciencemag.org SCIENCE VOL 326 9 OCTOBER 2009 289
    on A
    www.sciencemag.org
    Downloaded from

    View Slide

  36. View Slide

  37. Fill ends with biotinylated nucleotides

    View Slide

  38. Blunt end ligation

    View Slide

  39. Purify DNA and shear randomly

    View Slide

  40. Select out biotinylated fragments
    and sequence from ends

    View Slide

  41. Select out biotinylated fragments
    and sequence from ends
    (for millions of ligations simultaneously)

    View Slide

  42. is
    n-
    on
    ee
    ky
    e-
    o-
    on
    ly
    hi-
    III
    is
    ed
    c-
    p-
    by
    -C
    n-
    wn
    o-
    o-
    is
    is
    ents all interactions between a 1-Mb locus and another 1-Mb locus; intensity corresponds to the total number of reads (0 to 50). Tick
    C and D) We compared the original experiment with results from a biological repeat using the same restriction enzyme [(C), range
    results using a different restriction enzyme [(D), NcoI, range from 0 to 100 reads].
    B C D
    a-
    o-
    act
    e-
    1,
    at
    A B
    Lieberman Aiden et al, Science, 2009
    8.4 million read pairs, counts binned at 1Mb
    Map ends of sequenced fragments back to genome independently,
    each end-pair represents an interaction

    View Slide

  43. A B
    Heatmap
    8 million read pairs
    1 megabase bins
    Intensity represents
    number of reads
    linking each pair of
    bins
    (Lieberman Aiden et al, Science, 2009)

    View Slide

  44. C D
    (Lieberman Aiden et al, Science, 2009)
    Correlation map
    Intensity represents
    correlation between
    interaction
    profiles
    Suggests two broad
    groups?

    View Slide

  45. Fig. 3. The nucleus is segregated into tw
    E
    (Lieberman Aiden et al, Science, 2009)
    First principal component
    (eigenvector) from
    correlation matrix

    View Slide

  46. Lieberman Aiden et al, Science, 2009
    n pairs of loci in com-
    uggests that compart-
    cked (15). The FISH
    s observation; loci in
    stronger tendency for
    (DNAseI) sensitivity, Spearman’s r = 0.651, P
    negligible] (16, 17). Compartment A also shows
    enrichment for both activating (H3K36 trimethyl-
    ation, Spearman’s r = 0.601, P < 10–296) and
    repressive (H3K27 trimethylation, Spearman’s
    r = 0.282, P < 10–56) chromatin marks (18).
    transcribed chromatin.
    We repeated our experiment with K562 cells,
    an erythroleukemia cell line with an aberrant kar-
    yotype (19). We again observed two compart-
    ments; these were similar in composition to those
    observed in GM06990 cells [Pearson’s r = 0.732,
    of
    the
    (A)
    tion
    ged
    ows
    een
    re-
    (fit
    tion
    y as
    no-
    200
    ium
    les.
    e is
    rm-
    ope
    3/2,
    pec-
    ctal
    ope
    (C)
    ain,
    ong.
    ance
    rom
    or-
    qui-
    e is
    are
    im-
    y in
    ule.
    our
    ding
    both
    sec-
    ots.
    hree
    nts,
    osed
    the
    yan,
    ries.
    mes
    A
    C D
    B
    on April 19, 2012
    www.sciencemag.org
    Downloaded from
    a function of distance (1 mono-
    mer ~ 6 nucleosomes ~ 1200
    base pairs) (10) for equilibrium
    (red) and fractal (blue) globules.
    The slope for a fractal globule is
    very nearly –1 (cyan), confirm-
    ing our prediction (10). The slope
    for an equilibrium globule is –3/2,
    matching prior theoretical expec-
    tations. The slope for the fractal
    globule closely resembles the slope
    we observed in the genome. (C)
    (Top) An unfolded polymer chain,
    4000 monomers (4.8 Mb) long.
    Coloration corresponds to distance
    from one endpoint, ranging from
    blue to cyan, green, yellow, or-
    ange, and red. (Middle) An equi-
    librium globule. The structure is
    highly entangled; loci that are
    nearby along the contour (sim-
    ilar color) need not be nearby in
    3D. (Bottom) A fractal globule.
    Nearby loci along the contour
    tend to be nearby in 3D, leading
    to monochromatic blocks both
    on the surface and in cross sec-
    tion. The structure lacks knots.
    (D) Genome architecture at three
    scales. (Top) Two compartments,
    corresponding to open and closed
    chromatin, spatially partition the
    genome. Chromosomes (blue, cyan,
    green) occupy distinct territories.
    (Middle) Individual chromosomes
    weave back and forth between
    the open and closed chromatin
    compartments. (Bottom) At the
    scale of single megabases, the chromosome consists of a series of fractal globules.
    C D
    9 OCTOBER 2009 VOL 326 SCIENCE www.sciencemag.org
    292
    www.sciencema
    Downloaded from
    al compart-
    s of the ge-
    ts identified
    own genetic
    A correlates
    Spearman’s
    ression [via
    Spearman’s
    d accessible
    onuclease I
    = 0.651, P
    also shows
    6 trimethyl-
    10–296) and
    Spearman’s
    marks (18).
    We repeated the above analysis at a resolution
    of 100 kb (Fig. 3G) and saw that, although the
    correlation of compartment A with all other ge-
    nomic and epigenetic features remained strong
    (Spearman’s r > 0.4, P negligible), the correla-
    tion with the sole repressive mark, H3K27 trimeth-
    ylation, was dramatically attenuated (Spearman’s
    r = 0.046, P < 10–15). On the basis of these re-
    sults we concluded that compartment A is more
    closely associated with open, accessible, actively
    transcribed chromatin.
    We repeated our experiment with K562 cells,
    an erythroleukemia cell line with an aberrant kar-
    yotype (19). We again observed two compart-
    ments; these were similar in composition to those
    observed in GM06990 cells [Pearson’s r = 0.732,
    D
    B
    on April 19, 2012
    www.sciencemag.org
    Downloaded from
    Observed
    Simulated
    Distance distribution consistent with
    “fractal globule”

    View Slide

  47. o-
    o-
    is
    is
    ents all interactions between a 1-Mb locus and another 1-Mb locus; intensity corresponds to the total number of reads (0 to 50). Tick
    C and D) We compared the original experiment with results from a biological repeat using the same restriction enzyme [(C), range
    results using a different restriction enzyme [(D), NcoI, range from 0 to 100 reads].
    a-
    o-
    ct
    e-
    1,
    at
    n-
    ck
    rs
    o-
    r-
    10
    ly
    o-
    o-
    ed
    n-
    ed
    n-
    mosomes. Red indicates enrichment, and blue indicates depletion (range from 0.5 to 2). Small, gene-rich chromosomes tend to interact
    sting that they cluster together in the nucleus.
    A B
    9 OCTOBER 2009 VOL 326 SCIENCE www.sciencemag.org
    Lieberman Aiden et al, Science, 2009

    View Slide

  48. Conformation at the
    super-megabase scale

    View Slide

  49. LETTER
    doi:10.1038/nature11082
    Topological domains in mammalian genomes
    identified by analysis of chromatin interactions
    Jesse R. Dixon1,2,3, Siddarth Selvaraj1,4, Feng Yue1, Audrey Kim1, Yan Li1, Yin Shen1, Ming Hu5, Jun S. Liu5 & Bing Ren1,6
    The spatial organization of the genome is intimately linked to its
    biological function, yet our understanding of higher order genomic
    structure is coarse, fragmented and incomplete. In the nucleus of
    eukaryotic cells, interphase chromosomes occupy distinct chro-
    mosome territories, and numerous models have been proposed
    for how chromosomes fold within chromosome territories1. These
    models, however, provide only few mechanistic details about the
    relationship between higher order chromatin structure and genome
    function.Recentadvancesin genomic technologieshaveledtorapid
    advances in the study of three-dimensional genome organiza-
    tion. In particular, Hi-C has been introduced as a method for iden-
    tifying higher order chromatin interactions genome wide2. Here we
    investigate the three-dimensional organization of the human and
    mouse genomes in embryonic stem cells and terminally differen-
    tiated cell types at unprecedented resolution. We identify large,
    megabase-sized local chromatin interaction domains, which we
    term ‘topological domains’, as a pervasive structural feature of the
    genome organization. These domains correlate with regions of the
    genome that constrain the spread of heterochromatin. The domains
    are stable across different cell types and highly conserved across
    species, indicating that topological domains are an inherent
    property of mammalian genomes. Finally, we find that the
    boundaries of topological domains are enriched for the insulator
    binding protein CTCF, housekeeping genes, transfer RNAs and
    high quality and accurately capture the higher order chromatin struc-
    tures in mammalian cells.
    We next visualized two-dimensional interaction matrices using a
    variety of binsizes to identify interactionpatterns revealed as a resultof
    our high sequencing depth (Supplementary Fig. 7). We noticed that at
    bin sizes less than 100 kilobases (kb), highly self-interacting regions
    begin to emerge (Fig. 1a and Supplementary Fig. 7, seen as ‘triangles’
    on the heat map). These regions, which we term topological domains,
    are bounded by narrow segments where the chromatin interactions
    appear to end abruptly. We hypothesized that these abrupt transitions
    may represent boundary regions in the genome that separate topo-
    logical domains.
    To identify systematically all such topological domains in the
    genome, we devised a simple statistic termed the directionality index
    to quantify the degree of upstream or downstream interaction bias for
    a genomic region, which varies considerably at the periphery of the
    topological domains (Fig. 1b; see Supplementary Methods for details).
    The directionality index was reproducible (Supplementary Table 2)
    and pervasive, with 52% of the genome having a directionality
    index that was not expected by random chance (Fig. 1c, false discovery
    rate 5 1%). We then used a Hidden Markov model (HMM) based on
    the directionality index to identify biased ‘states’ and therefore infer
    the locations of topological domains in the genome (Fig. 1a; see
    Supplementary Methods for details). The domains defined by HMM
    investigate the three-dimensional organization of the human and
    mouse genomes in embryonic stem cells and terminally differen-
    tiated cell types at unprecedented resolution. We identify large,
    megabase-sized local chromatin interaction domains, which we
    term ‘topological domains’, as a pervasive structural feature of the
    genome organization. These domains correlate with regions of the
    genome that constrain the spread of heterochromatin. The domains
    are stable across different cell types and highly conserved across
    species, indicating that topological domains are an inherent
    property of mammalian genomes. Finally, we find that the
    boundaries of topological domains are enriched for the insulator
    binding protein CTCF, housekeeping genes, transfer RNAs and
    short interspersed element (SINE) retrotransposons, indicating
    that these factors may have a role in establishing the topological
    domain structure of the genome.
    To study chromatin structure in mammalian cells, we determined
    genome-wide chromatin interaction frequencies by performing the
    Hi-C experiment2 in mouse embryonic stem (ES) cells,human ES cells,
    and human IMR90 fibroblasts. Together with Hi-C data for the mouse
    cortex generated in a separate study (Y. Shen et al., manuscript in
    preparation), we analysed over 1.7-billion read pairs of Hi-C data
    corresponding to pluripotent and differentiated cells (Supplemen-
    tary Table 1). We normalized the Hi-C interactions for biases in the
    data (Supplementary Figs 1 and 2)3. To validate the quality of our Hi-C
    data, we compared the data with previous chromosome conformation
    capture (3C), chromosome conformation capture carbon copy (5C),
    and fluorescence in situ hybridization (FISH) results4–6. Our IMR90
    Hi-C data show a high degree of similarity when compared to a previ-
    ously generated5Cdatasetfromlungfibroblasts(SupplementaryFig.4).
    In addition, our mouse ES cell Hi-C data correctly recovered a previ-
    ously described cell-type-specific interaction at the Phc1 gene5
    (Supplementary Fig. 5). Furthermore, the Hi-C interaction frequencies
    in mouse ES cells are well-correlated with the mean spatial distance
    separating six loci as measured by two-dimensional FISH6
    (Supplementary Fig. 6), demonstrating that the normalized Hi-C data
    can accurately reproduce the expected nuclear distance using an inde-
    pendent method. These results demonstrate that our Hi-C data are of
    To identify systematically all such topological domains in the
    genome, we devised a simple statistic termed the directionality index
    to quantify the degree of upstream or downstream interaction bias for
    a genomic region, which varies considerably at the periphery of the
    topological domains (Fig. 1b; see Supplementary Methods for details).
    The directionality index was reproducible (Supplementary Table 2)
    and pervasive, with 52% of the genome having a directionality
    index that was not expected by random chance (Fig. 1c, false discovery
    rate 5 1%). We then used a Hidden Markov model (HMM) based on
    the directionality index to identify biased ‘states’ and therefore infer
    the locations of topological domains in the genome (Fig. 1a; see
    Supplementary Methods for details). The domains defined by HMM
    were reproducible between replicates (Supplementary Fig. 8).
    Therefore, we combined the data from the HindIII replicates and
    identified 2,200 topological domains in mouse ES cells with a median
    size of 880 kb that occupy ,91% of the genome (Supplementary
    Fig. 9). As expected, the frequency of intra-domain interactions is
    higher than inter-domain interactions (Fig. 1d, e). Similarly, FISH
    probes6 in the same topological domain (Fig. 1f) are closer in nuclear
    space than probes in different topological domains (Fig. 1g), despite
    similar genomic distances between probe pairs (Fig. 1h, i). These find-
    ings are best explained bya model of the organizationof genomic DNA
    into spatial modules linked by short chromatin segments. We define
    the genomic regions between topological domains as either ‘topo-
    logical boundary regions’ or ‘unorganized chromatin’, depending on
    their sizes (Supplementary Fig. 9).
    We next investigated the relationship between the topological
    domains and the transcriptional control process. The Hoxa locus is
    separated into two compartments by an experimentally validated insu-
    lator4,7,8, which we observed corresponds to a topological domain
    boundary in both mouse (Fig. 1a) and human (Fig. 2a). Therefore,
    we hypothesized that the boundaries of the topological domains might
    correspond to insulator or barrier elements.
    Many known insulator or barrier elements are bound by the zinc-
    finger-containing protein CTCF (refs 9–11). We see a strong enrich-
    ment of CTCF at the topological boundary regions (Fig. 2b and
    Supplementary Fig. 10), indicating that topological boundary regions
    1Ludwig Institute for Cancer Research, 9500 Gilman Drive, La Jolla, California 92093, USA. 2Medical Scientist Training Program, University of California, San Diego, La Jolla, California 92093, USA.
    3Biomedical Sciences Graduate Program, University of California, San Diego, La Jolla, California 92093, USA. 4Bioinformatics and Systems Biology Graduate Program, University of California, San Diego, La
    Jolla, California 92093, USA. 5Department of Statistics, Harvard University, 1 Oxford Street, Cambridge, Massachusetts 02138, USA. 6University of California, San Diego School of Medicine, Department of
    Cellular and Molecular Medicine, Institute of Genomic Medicine, UCSD Moores Cancer Center, 9500 Gilman Drive, La Jolla, California 92093, USA.
    0 0 M O N T H 2 0 1 2 | V O L 0 0 0 | N A T U R E | 1
    Macmillan Publishers Limited. All rights reserved
    ©2012
    (11 April 2012)

    View Slide

  50. •Human and Mouse Embryonic stem cells, human
    fibroblasts and mouse cortex
    •~1.7 Billion read pairs sequenced
    •Read pair counts binned to 40kb and 20kb bins

    View Slide

  51. CTCF
    H3K4me3
    RNA PolII
    p300
    H3K4me1
    HMM state
    DI
    Domains
    1.0
    0.8
    0.6
    0.4
    mpirical
    tive density
    False positive
    rate 1%
    DI (actual)
    DI (random)
    00 700
    nts
    B
    Interactions downstream e
    0
    100
    Normalized
    interacting
    counts
    Chr6: 50000000 51000000 52000000 53000000 54000000
    2410003K15Rik
    Igf2bp3
    Tra2a
    Ccdc126
    D330028D13Rik
    Stk31 Npy Mpp6
    Dfna5
    Osbpl3
    Cycs
    5430402O13Rik
    Npvf
    C530044C16Rik
    Mir148a
    Nfe2l3
    Hnrnpa2b1
    Cbx3
    Snx10
    Skap2
    Hoxa1
    Hoxa2
    Hoxa3
    Hoxa4
    Hoxa5
    Hoxa6
    Mira
    Hoxa7
    Hoxa9
    Mir196b
    Hoxa10
    Hoxa11
    Hoxa13
    5730457N03Rik
    Evx1
    Hibadh
    Tax1bp1
    Jazf1
    9430076C15Rik
    Creb5
    Tril
    Cpvl
    Chn2
    50 -
    –50 _
    5 -
    0.2
    _
    5 -
    0.3 _
    5 -
    0.5_
    3 -
    0.2 _
    3 -
    0.2 _
    b
    a
    c
    a
    b
    RESEARCH LETTER

    View Slide

  52. d
    ,
    m
    hESC DI
    IMR90 DI
    IMR90 H3K9me3
    hESC H3K9me3
    hESC domain
    IMR90 domain
    Boundary
    ± 500 kb
    Boundary
    ± 500 kb
    0 3.0
    log
    2
    (H3K9me3/input)
    0 3.0
    log
    2
    (H3K9me3/input)
    3.0 –3.0
    log
    2
    (Dam–laminB1/Dam)
    Chr2:
    2 Mb hg18
    138000000 139000000 140000000
    THSD7B
    HNMT
    SPOPL
    NXPH2
    LOC647012
    30
    _
    –30
    _
    30
    _
    –30
    _
    16
    _
    0 _
    16
    _
    0 _
    50
    0
    Normalized
    interacting counts
    e
    Boundary
    ± 500 kb
    Boundary
    ± 500 kb
    Boundary
    ± 500 kb
    Figure 2 | Topological boundaries demonstrate classical insulator or
    barrier element features. a, Two-dimensional heatmap surroundingthe Hoxa
    Chromatin organized into “topological domains”, mean size ~800kb

    View Slide

  53. 1.0
    0
    0.8
    0.6
    0.4
    0.2
    0 10 20 30 40 50
    1 – Empirical
    cumulative density
    DI (absolute value)
    False positive
    rate 1%
    DI (actual)
    DI (random)
    0
    10
    20
    30
    40
    0 0.5 1.0 1.5 2.0
    Median normalized
    interaction counts
    Genomic distance (Mb)
    0 100 200 300 400 500 600 700
    Normalized interacting counts
    Distance of 80-kb
    P-value = 1.65 × 10–126
    A
    B
    Interactions downstream
    Interactions upstream
    A B
    Biased
    upstream
    Biased
    downstream
    Degree of bias
    FISH probes:
    mESC DI
    HMM state
    FISH probes:
    mESC DI
    HMM state
    ‘Intra-domain’ ‘Inter-domain’
    Domain 1 Domain 2
    Domain
    d
    e
    Putative boundary
    Chr2:
    2410003K15Rik
    Igf2bp3
    Tra2a
    Ccdc126
    D330028D13Rik
    Stk31 Npy Mpp6
    Dfna5
    Osbpl3
    Cycs
    5430402O13Rik
    Npvf
    C530044C16Rik
    Mir148a
    Nfe2l3
    Hnrnpa2b1
    Cbx3
    Snx10
    Skap2
    Hoxa1
    Hoxa2
    Hoxa3
    Hoxa4
    Hoxa5
    Hoxa6
    Mira
    Hoxa7
    Hoxa9
    Mir196b
    Hoxa10
    Hoxa11
    Hoxa13
    5730457N03Rik
    Evx1
    Hibadh
    Tax1bp1
    Jazf1
    9430076C15Rik
    Creb5
    Tril
    Cpvl
    Chn2
    74500000 74600000
    50 -
    Chr11: 96200000 96300000
    50 -
    Intra
    Inter
    b
    Inter-domain
    Intra-domain
    f g
    c
    k between the topological domains and transcriptional
    he mammalian genome.
    ared the topological domains with previously described
    organizations of the genome, specifically with the A and B
    nts described by ref. 2, with lamina-associated domains
    replication time zones15,16, and large organized chromatin
    tion (LOCK) domains17. In all cases, we can see that topo-
    ains are related to, but independent from, each of these
    escribed domain-like structures (Supplementary Figs 12–
    , a subset of the domain boundaries we identify appear to
    nsition between either LAD and non-LAD regions of the
    g. 2f and Supplementary Fig. 12), the A and B compart-
    lementary Fig. 13, 14), and early and late replicating chro-
    plementary Fig. 14). Lastly, we can also confirm the
    eported similarities between the A and B compartments
    d late replication time zone (Supplementary Fig. 16)16.
    compared the locations of topological boundaries iden-
    h replicates of mouse ES cells and cortex, or between both
    human ES cells and IMR90 cells. In both human and
    t of the boundary regions are shared between cell types
    d Supplementary Fig. 17a), suggesting that the overall
    ucture between cell types is largely unchanged. At the
    mESC only
    776
    Cortex only
    169
    Overlap
    893
    hE
    Phc1
    Nanog
    Grik2
    (glutamate
    receptor)
    Snca
    Genes at
    mESC-specific
    interactions
    Genes at
    cortex-specific
    interactions
    -
    _
    -
    _
    -
    _
    -
    _
    -
    _
    -
    _
    -
    _
    -
    _
    Foxg1
    3
    0.2
    0.2
    5
    0.5
    5
    0.3
    5
    Foxg
    3
    0.2
    0.2
    5
    0.5
    5
    0.3
    5
    40
    400 kb
    51000000
    H3K4me3
    RNA Pol II
    CTCF
    H3K4me1
    Cortex-enriched
    dynamic interacting reg
    g1 RNA-seq (r.p.k.m.)
    mESC-e
    interac
    Chr12 Chr12
    0
    40
    Normalized
    interaction
    counts
    0
    40
    Normalized
    interaction
    counts
    b
    a
    c d e
    3
    6
    9
    12
    15
    1,272 (9
    ins and transcriptional
    th previously described
    ifically with the A and B
    ina-associated domains
    ge organized chromatin
    es, we can see that topo-
    ent from, each of these
    Supplementary Figs 12–
    es we identify appear to
    non-LAD regions of the
    the A and B compart-
    nd late replicating chro-
    can also confirm the
    mESC only
    776
    Cortex only
    169
    Overlap
    893
    Overlap
    1,289
    hESC only
    678
    IMR90 only
    504
    -
    _
    -
    _
    -
    _
    -
    -
    _
    -
    _
    -
    _
    - 3
    0.2
    5
    0.5
    5
    0.3
    5
    0.2
    5
    0.5
    5
    0.3
    5
    400 kb
    400 kb
    51000000 51000000
    H3K4me3
    RNA Pol II
    CTCF
    Cortex-enriched
    dynamic interacting region
    Chr12 Chr12
    0
    40
    Normalized
    interaction
    counts
    0
    40
    Normalized
    interaction
    counts
    b
    a
    LETTER RESEARCH
    Chromatin packing model
    for domains
    Domains largely constant
    between cell types

    View Slide

  54. Can we resolve sub-megabase scale structure?

    View Slide

  55. Chromosome conformation capture
    carbon-copy

    View Slide

  56. Chromosome Conformation Capture Carbon Copy / 5C (Dostie et al. 2006)
    Sequence specific probe
    Universal primer

    View Slide

  57. Chromosome Conformation Capture Carbon Copy / 5C (Dostie et al. 2006)
    For junctions present in the library, probes anneal and are ligated
    (Forward and reverse probes are separate sets,
    ligations are always forward to reverse)

    View Slide

  58. Chromosome Conformation Capture Carbon Copy / 5C (Dostie et al. 2006)
    Ligated probe sequences amplified and sequenced

    View Slide

  59. For many primers simultaneously
    3C
    5C Probe
    Ligation
    Amplification

    View Slide

  60. Probe design strategy for unbiased and high
    resolution mapping
    •Focus on regions on ~1MB in length
    •Alternating primers tiled across entire region
    •Probes represent fragments on ~1 to 10kb in length

    View Slide

  61. Universal primer
    Universal primer
    Alternating forward (blue) and reverse (red)
    primers across an ~1MB region
    Interrogate ~50% of the interactions in a region at single
    fragment resolution

    View Slide

  62. What does the data look like?

    View Slide

  63. Reverse Probes
    Forward Probes
    Single region
    Log counts
    (white is high,
    blue is missing)

    View Slide

  64. Chromosome Conformation Capture Carbon
    Copy = 5C
    Dostie et al. 2006

    View Slide

  65. Hi-C
    Lieberman-AIden et al. 2009

    View Slide

  66. Hi-C
    Lieberman-AIden et al. 2009

    View Slide

  67. Hi-C in Genome Assembly
    Burton et al. 2013

    View Slide

  68. Hi-C in Genome Assembly

    View Slide

  69. Burton et al. 2013
    The principle

    View Slide

  70. Kaplan & Dekker 2013
    cis versus trans

    View Slide

  71. Burton et al. 2013

    View Slide

  72. Kaplan & Dekker 2013
    Scaffold augmentation

    View Slide

  73. Hi-C in Haplotyping
    Burton et al. 2013

    View Slide

  74. Salvaraj et al. 2013

    View Slide

  75. cis versus trans
    Salvaraj et al. 2013

    View Slide

  76. Salvaraj et al. 2013

    View Slide

  77. Salvaraj et al. 2013

    View Slide