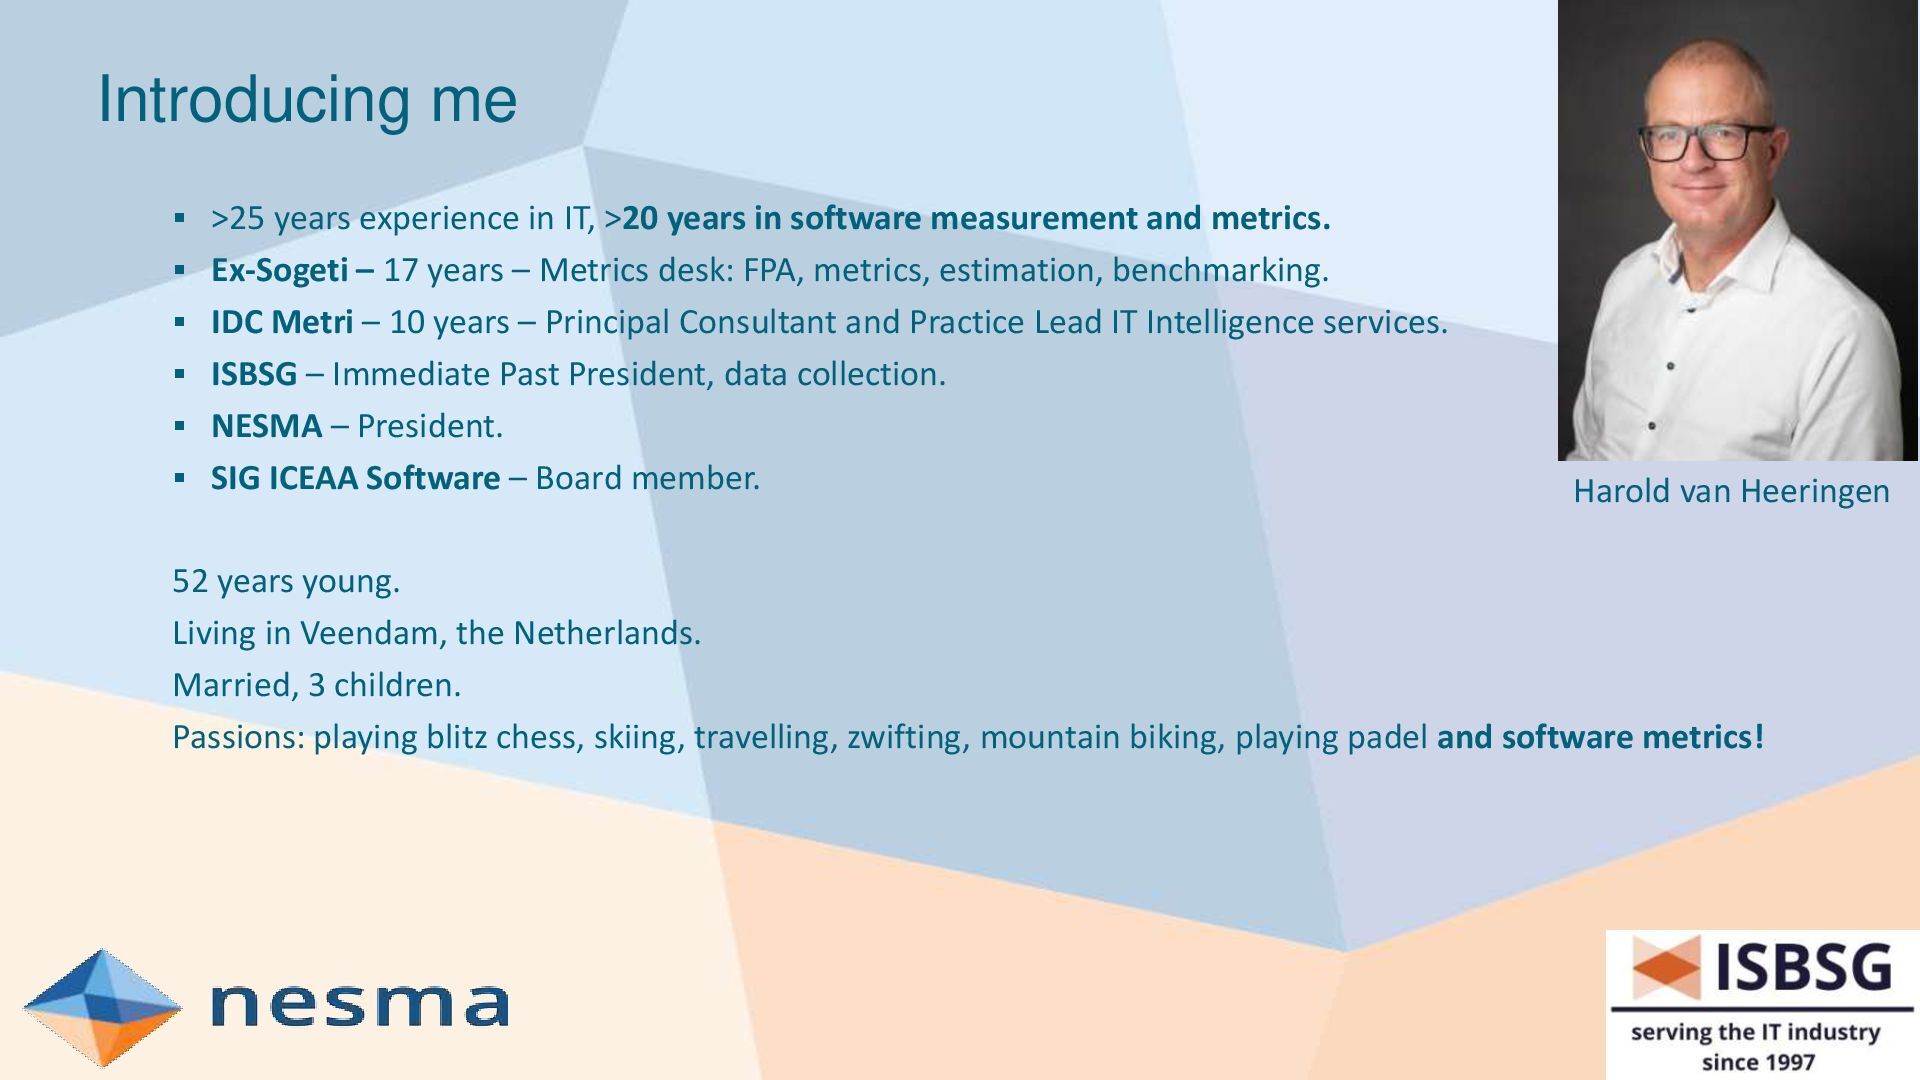
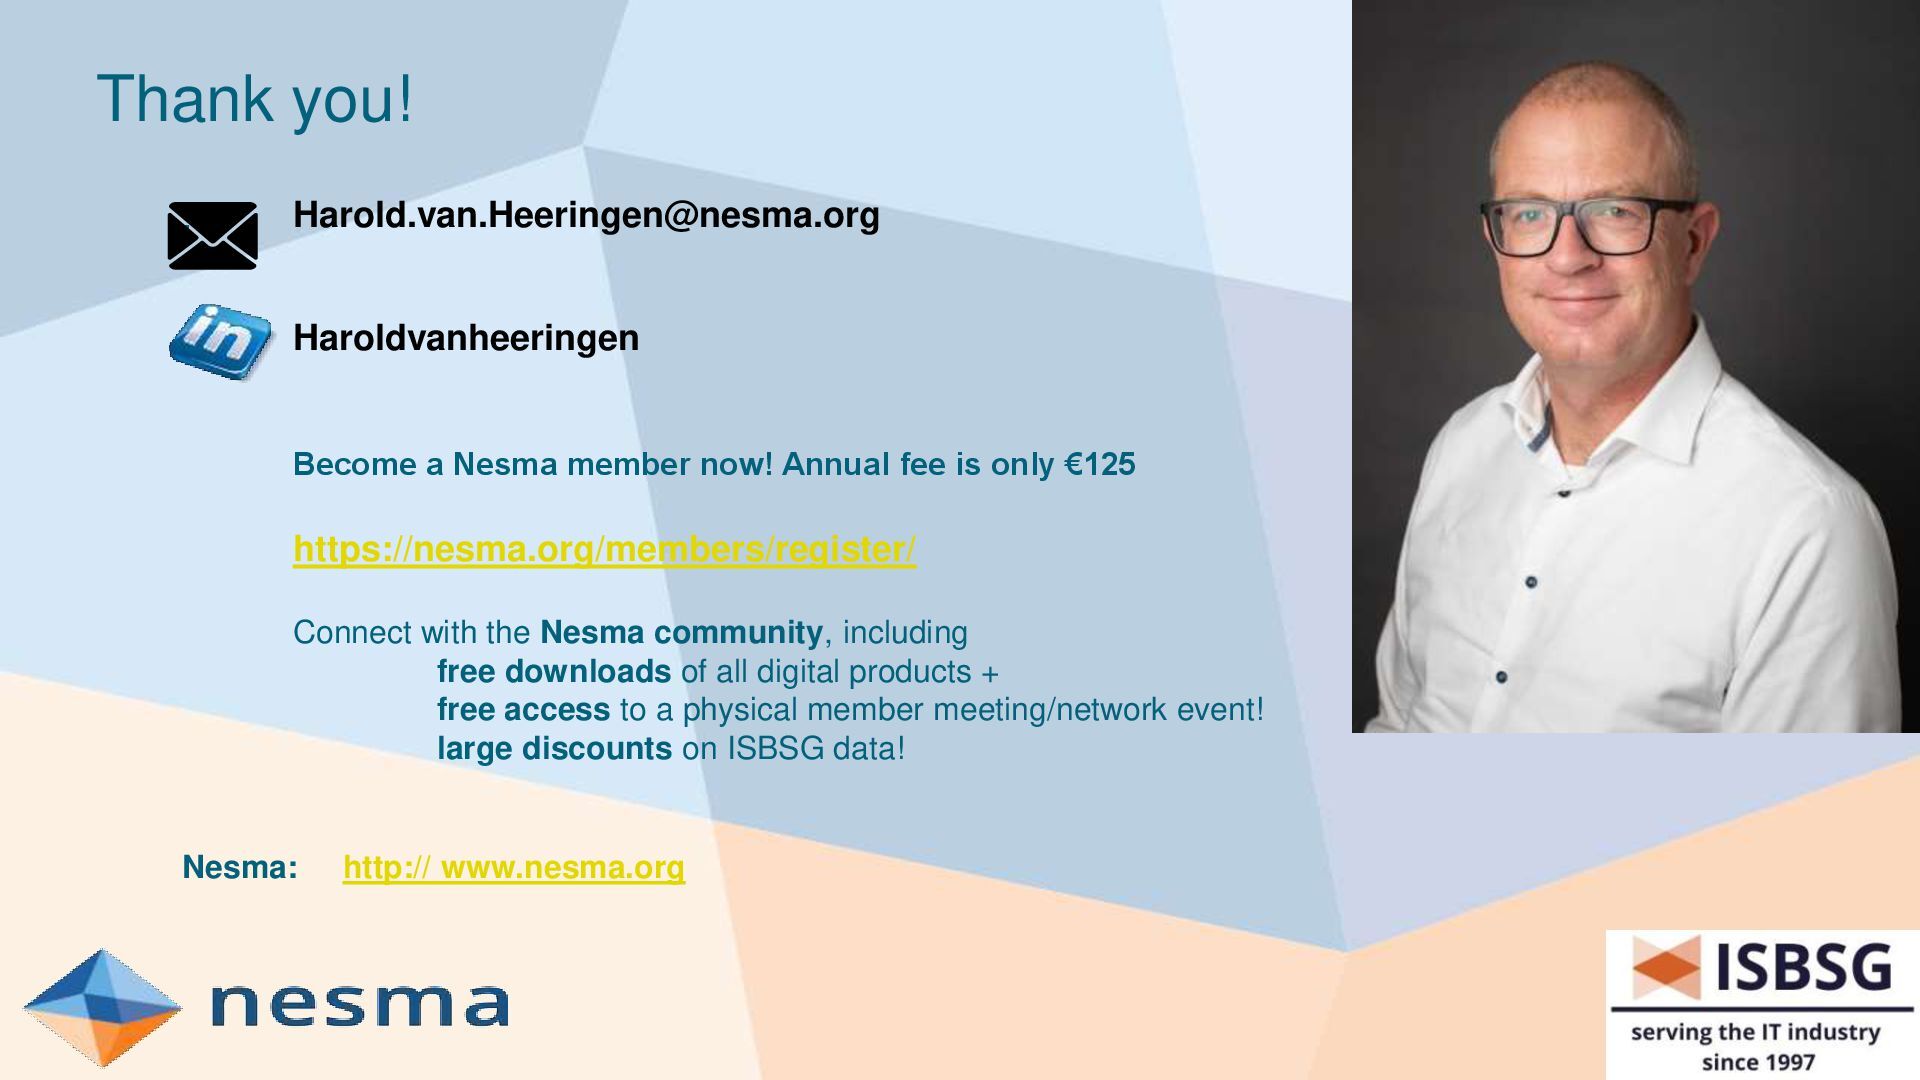
in software measurement and metrics. Ex-Sogeti – 17 years – Metrics desk: FPA, metrics, estimation, benchmarking. IDC Metri – 10 years – Principal Consultant and Practice Lead IT Intelligence services. ISBSG – Immediate Past President, data collection. NESMA – President. SIG ICEAA Software – Board member. 52 years young. Living in Veendam, the Netherlands. Married, 3 children. Passions: playing blitz chess, skiing, travelling, zwifting, mountain biking, playing padel and software metrics! Harold van Heeringen
Application Development contracts based on T&M (Agile) Team performance Measuring key metrics Benchmarking metrics using ISBSG data Output-based contracting Q&A
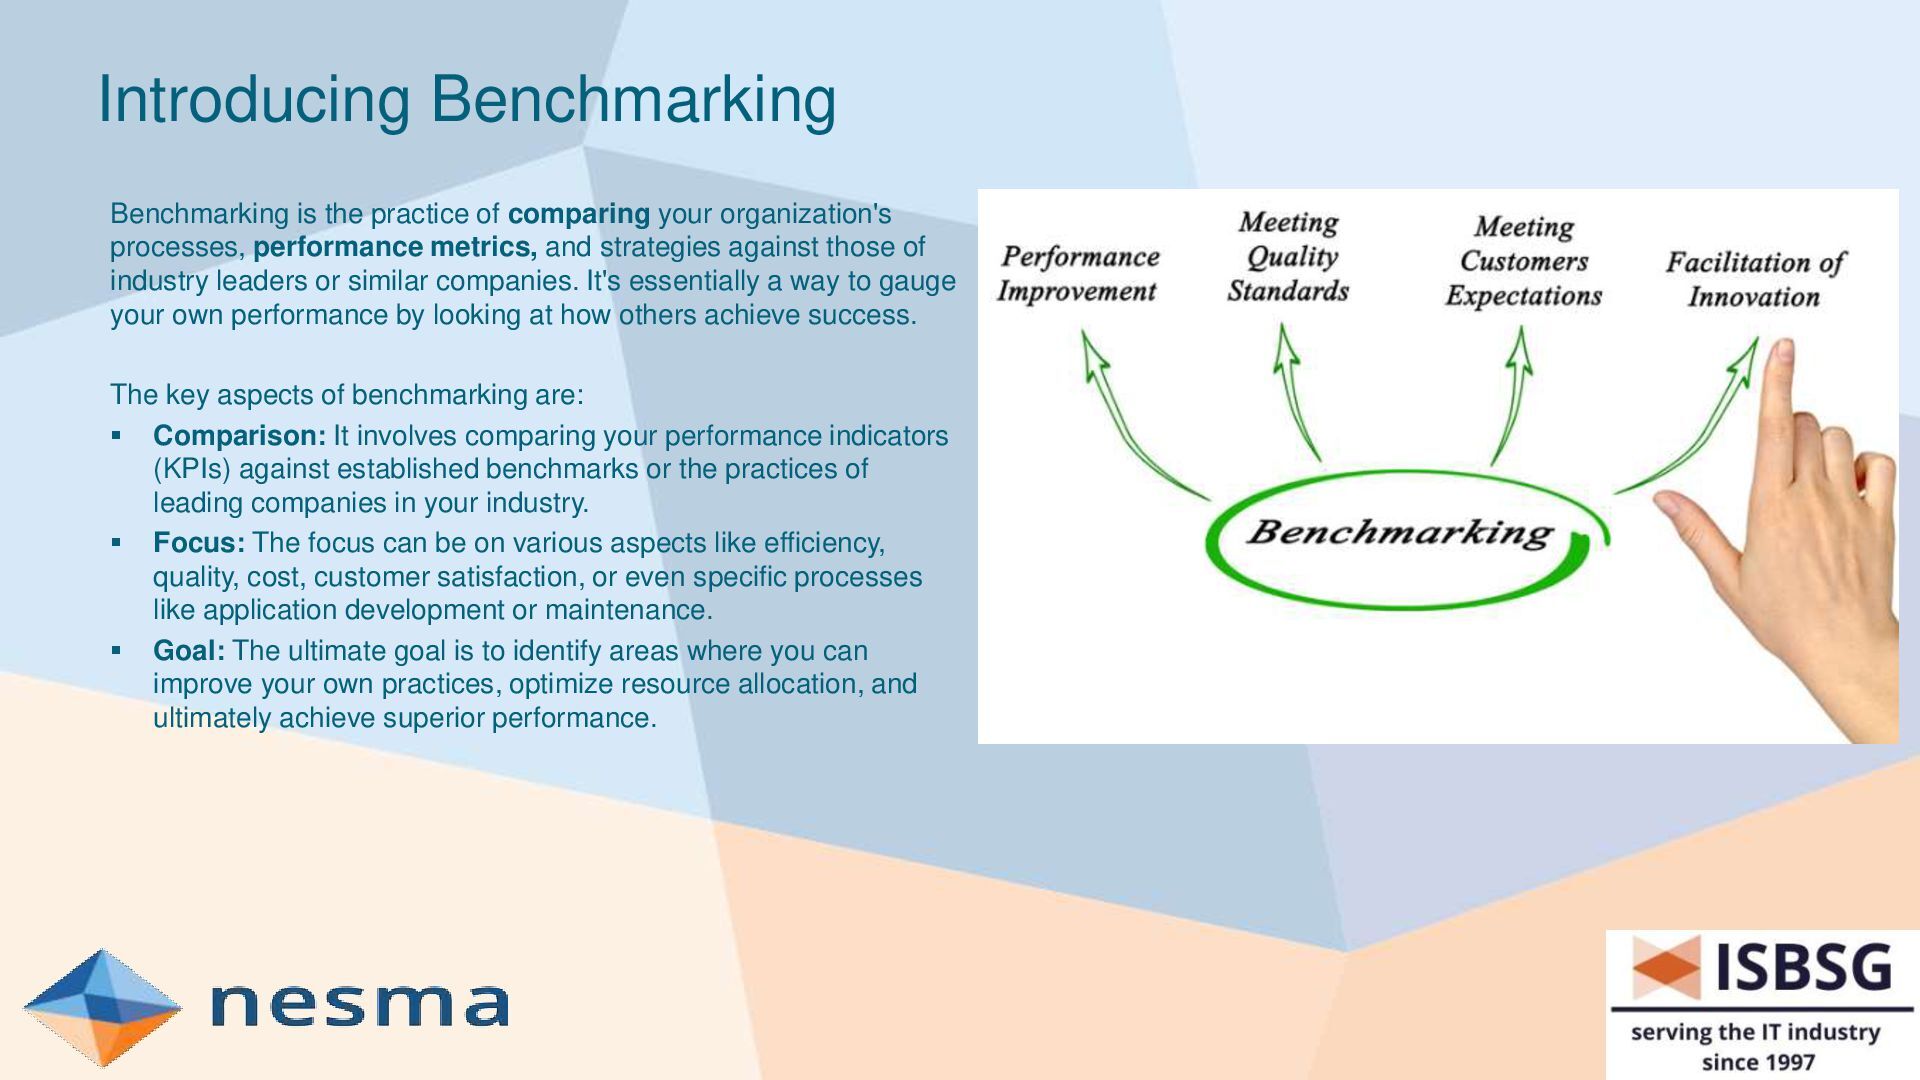
processes, performance metrics, and strategies against those of industry leaders or similar companies. It's essentially a way to gauge your own performance by looking at how others achieve success. The key aspects of benchmarking are: Comparison: It involves comparing your performance indicators (KPIs) against established benchmarks or the practices of leading companies in your industry. Focus: The focus can be on various aspects like efficiency, quality, cost, customer satisfaction, or even specific processes like application development or maintenance. Goal: The ultimate goal is to identify areas where you can improve your own practices, optimize resource allocation, and ultimately achieve superior performance.
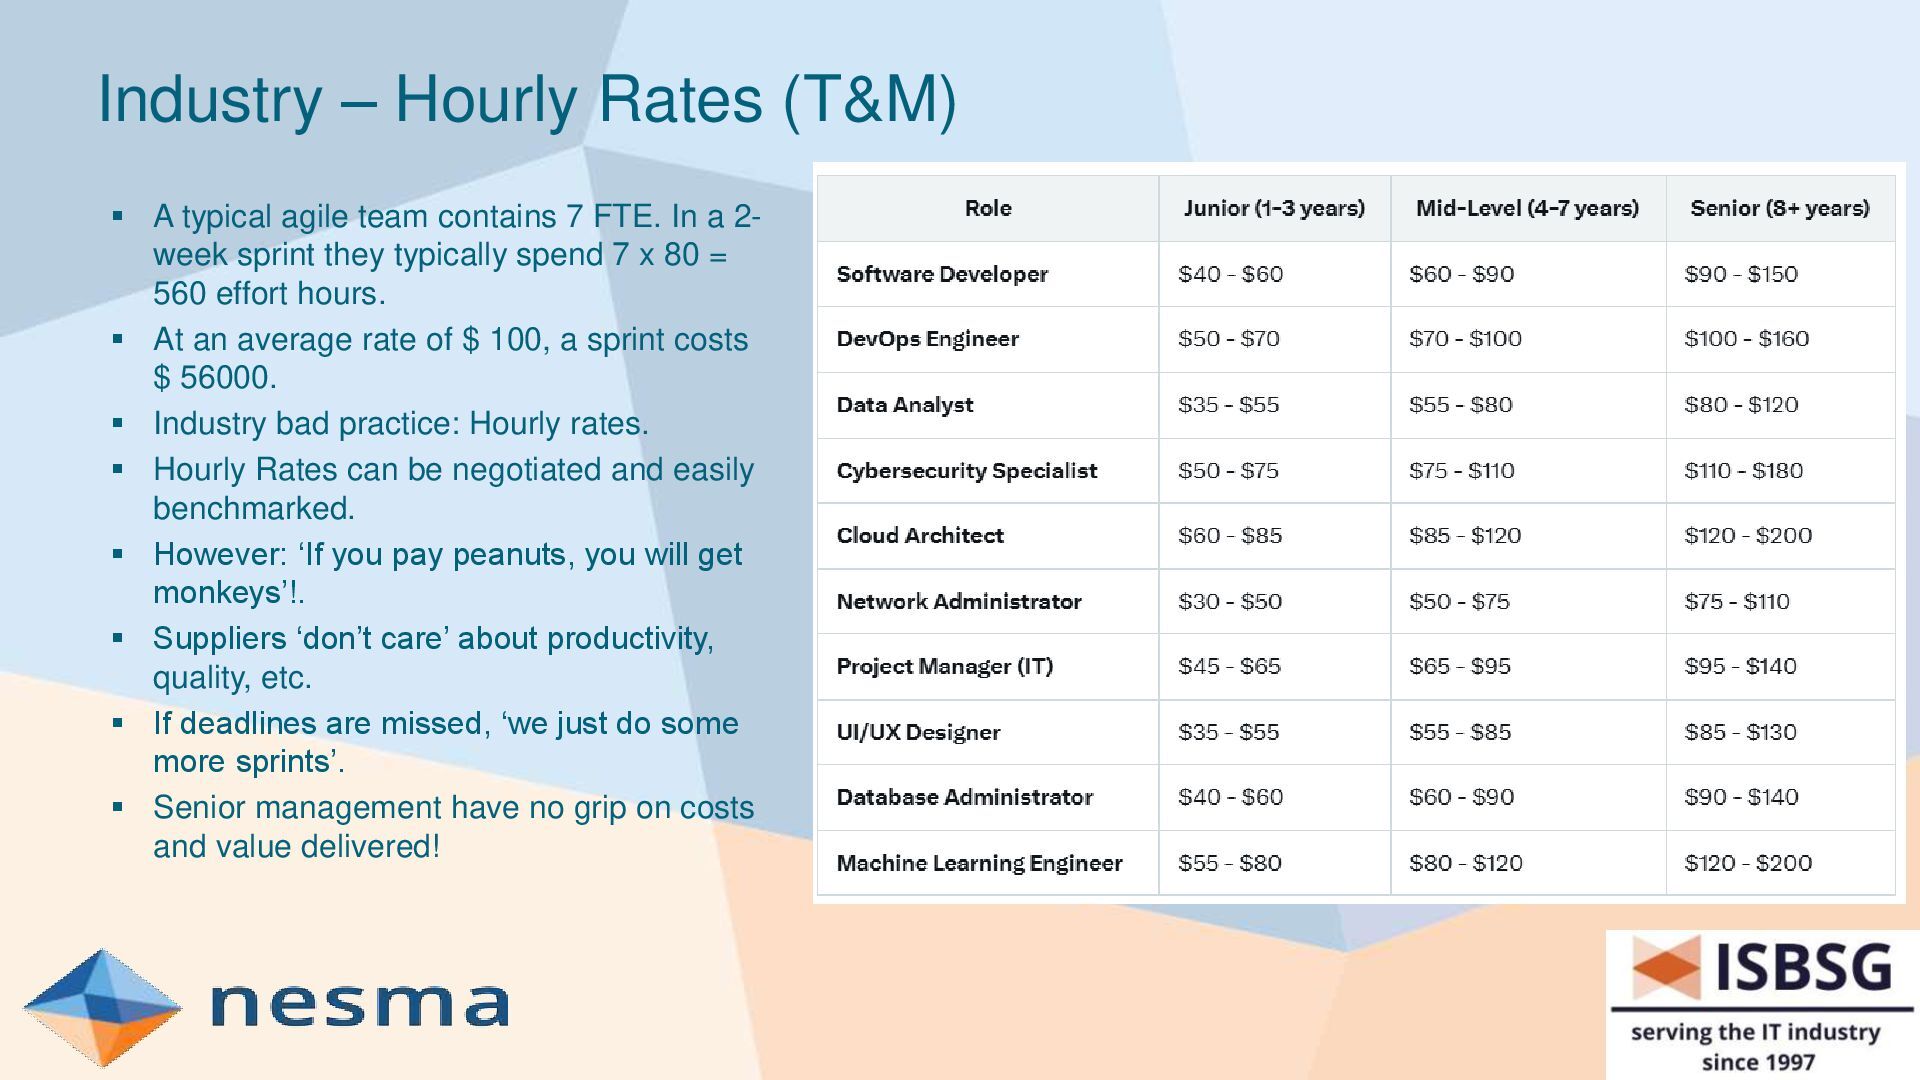
contains 7 FTE. In a 2- week sprint they typically spend 7 x 80 = 560 effort hours. At an average rate of $ 100, a sprint costs $ 56000. Industry bad practice: Hourly rates. Hourly Rates can be negotiated and easily benchmarked. However: ‘If you pay peanuts, you will get monkeys’!. Suppliers ‘don’t care’ about productivity, quality, etc. If deadlines are missed, ‘we just do some more sprints’. Senior management have no grip on costs and value delivered!
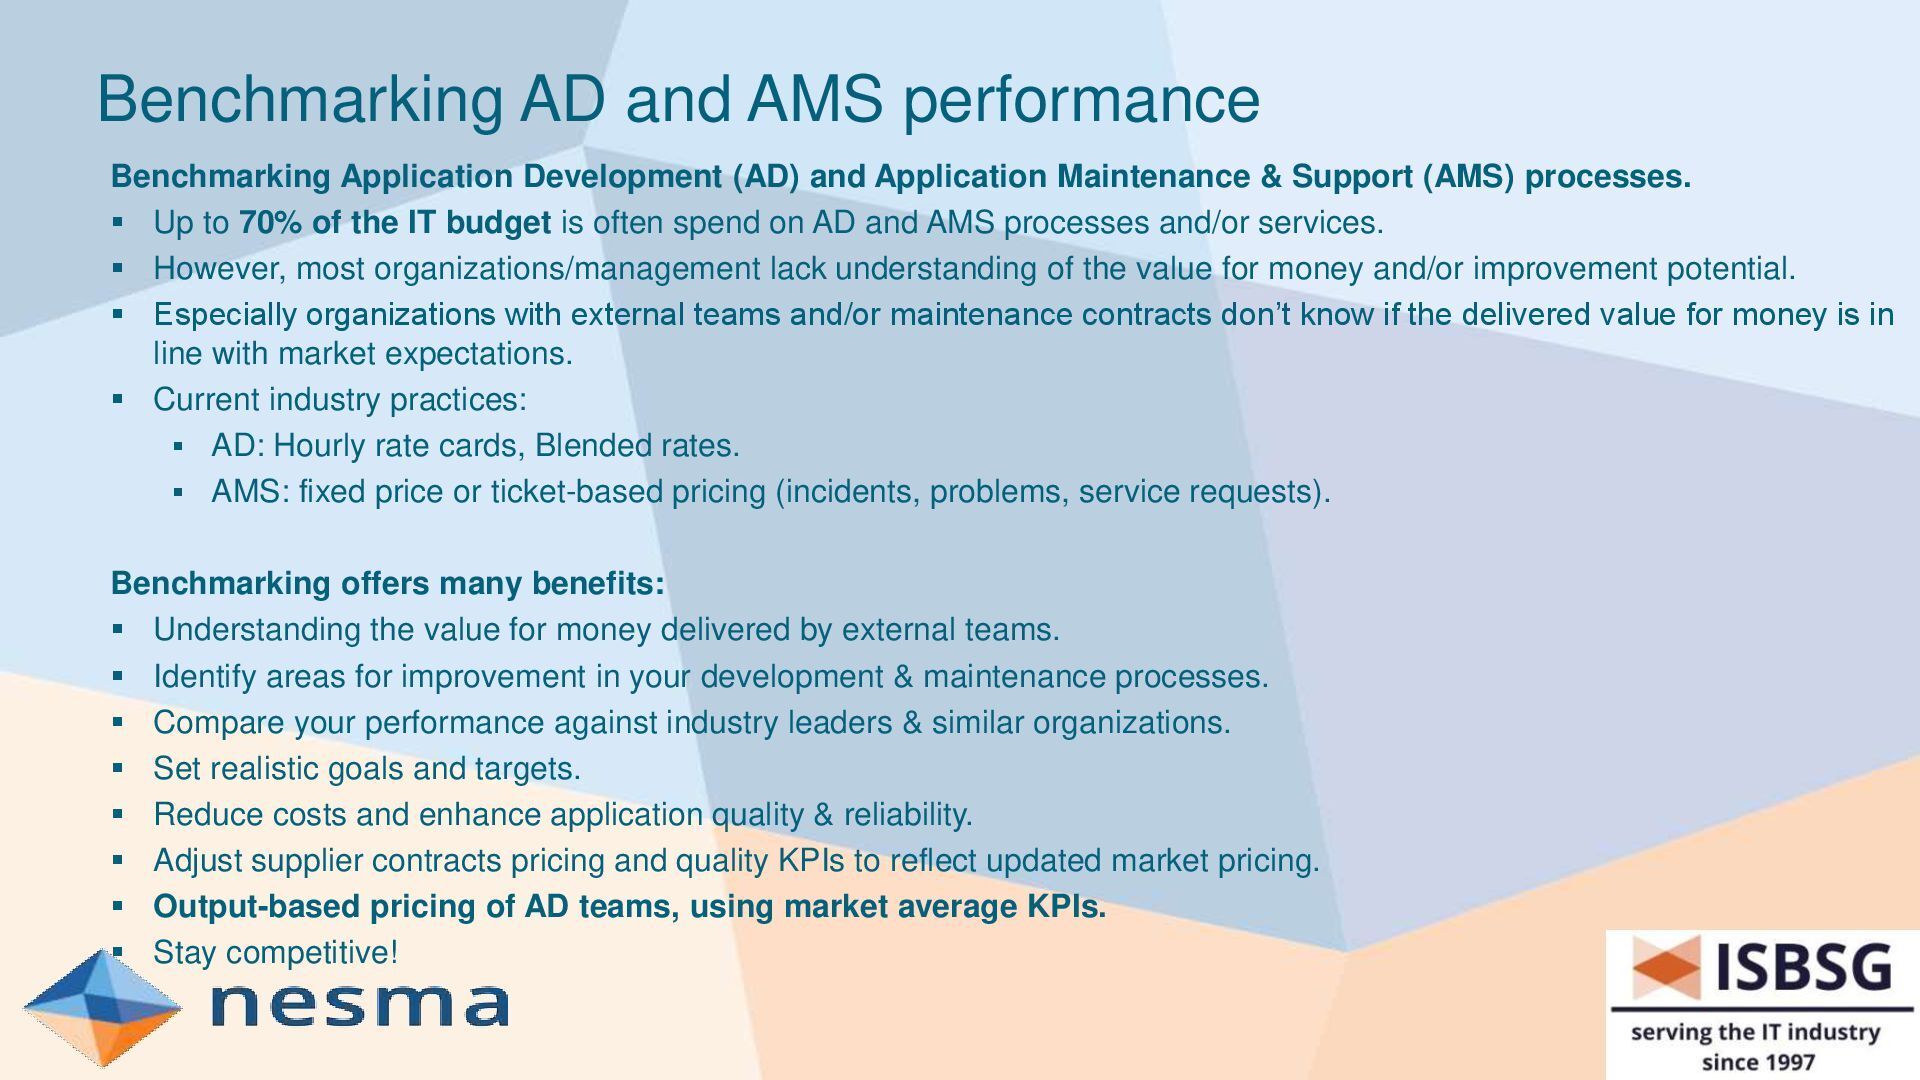
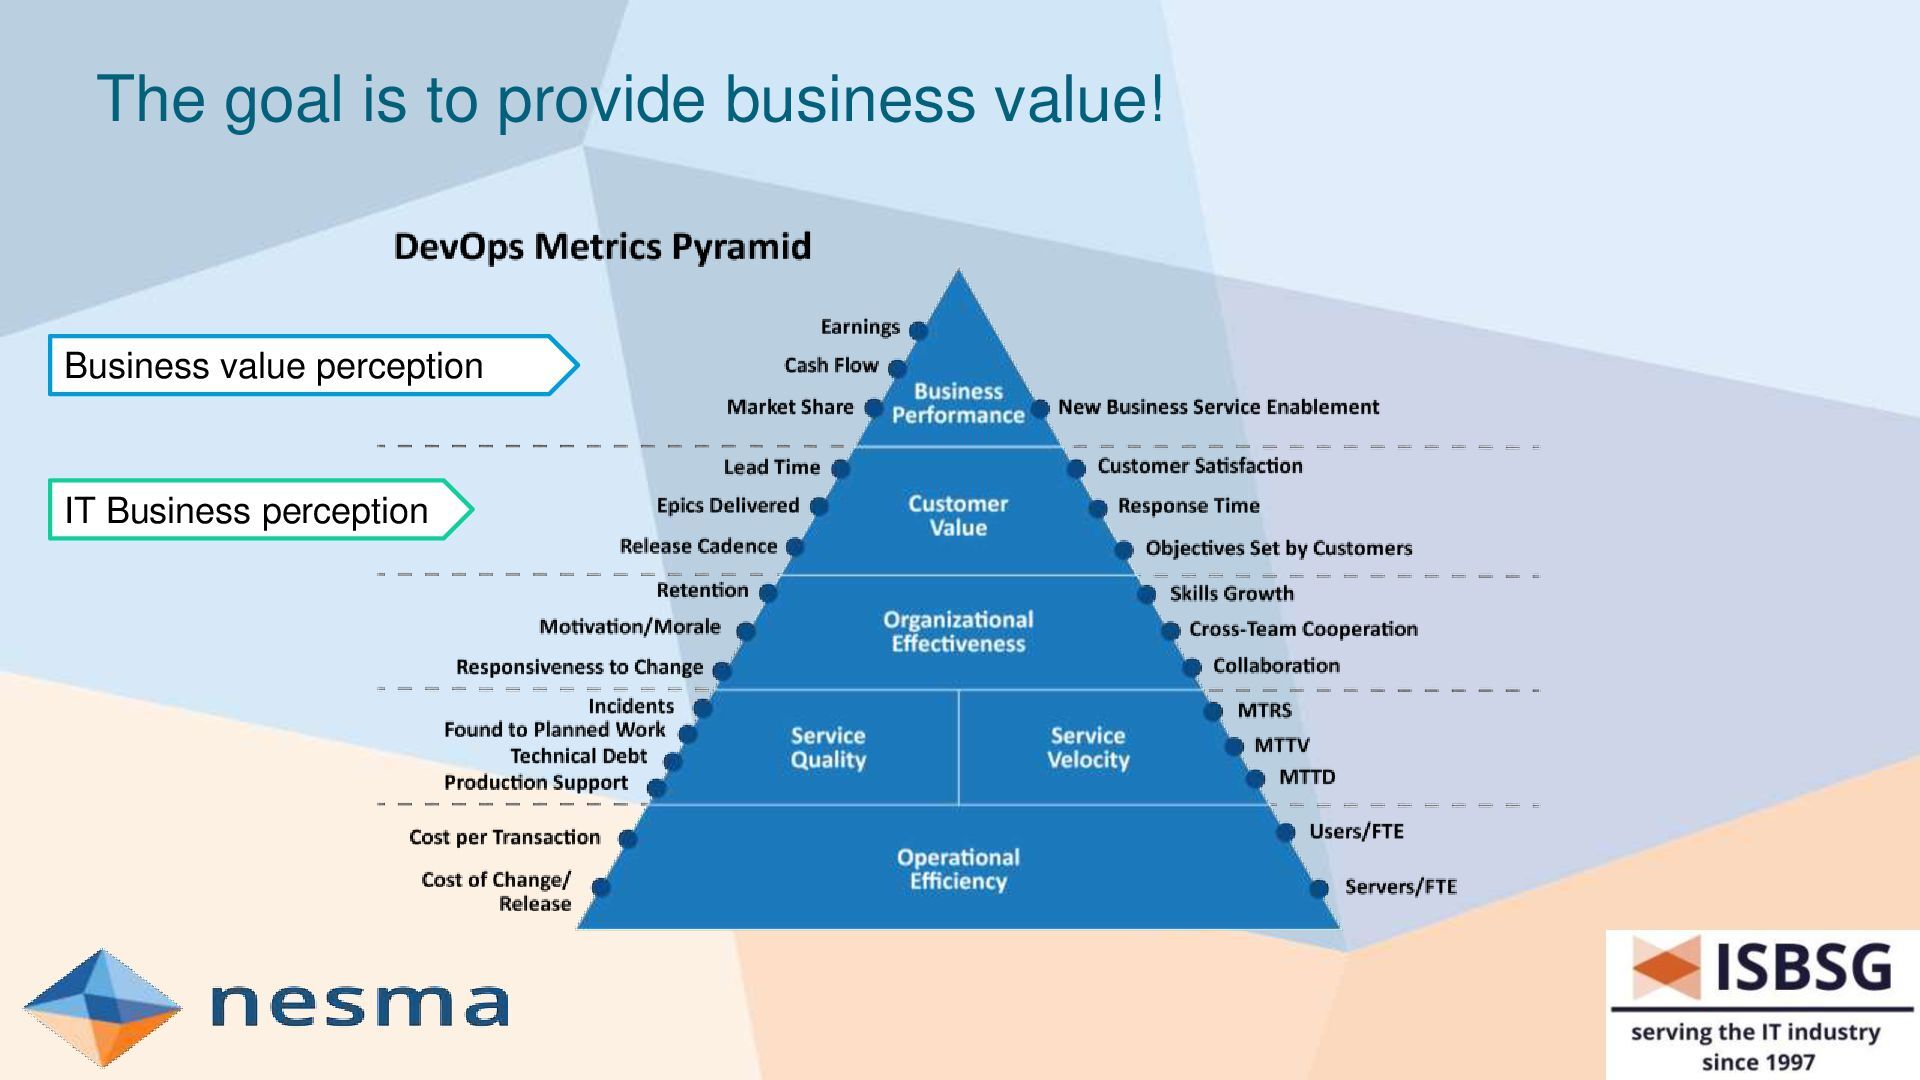
Application Maintenance & Support (AMS) processes. Up to 70% of the IT budget is often spend on AD and AMS processes and/or services. However, most organizations/management lack understanding of the value for money and/or improvement potential. Especially organizations with external teams and/or maintenance contracts don’t know if the delivered value for money is in line with market expectations. Current industry practices: AD: Hourly rate cards, Blended rates. AMS: fixed price or ticket-based pricing (incidents, problems, service requests). Benchmarking offers many benefits: Understanding the value for money delivered by external teams. Identify areas for improvement in your development & maintenance processes. Compare your performance against industry leaders & similar organizations. Set realistic goals and targets. Reduce costs and enhance application quality & reliability. Adjust supplier contracts pricing and quality KPIs to reflect updated market pricing. Output-based pricing of AD teams, using market average KPIs. Stay competitive!
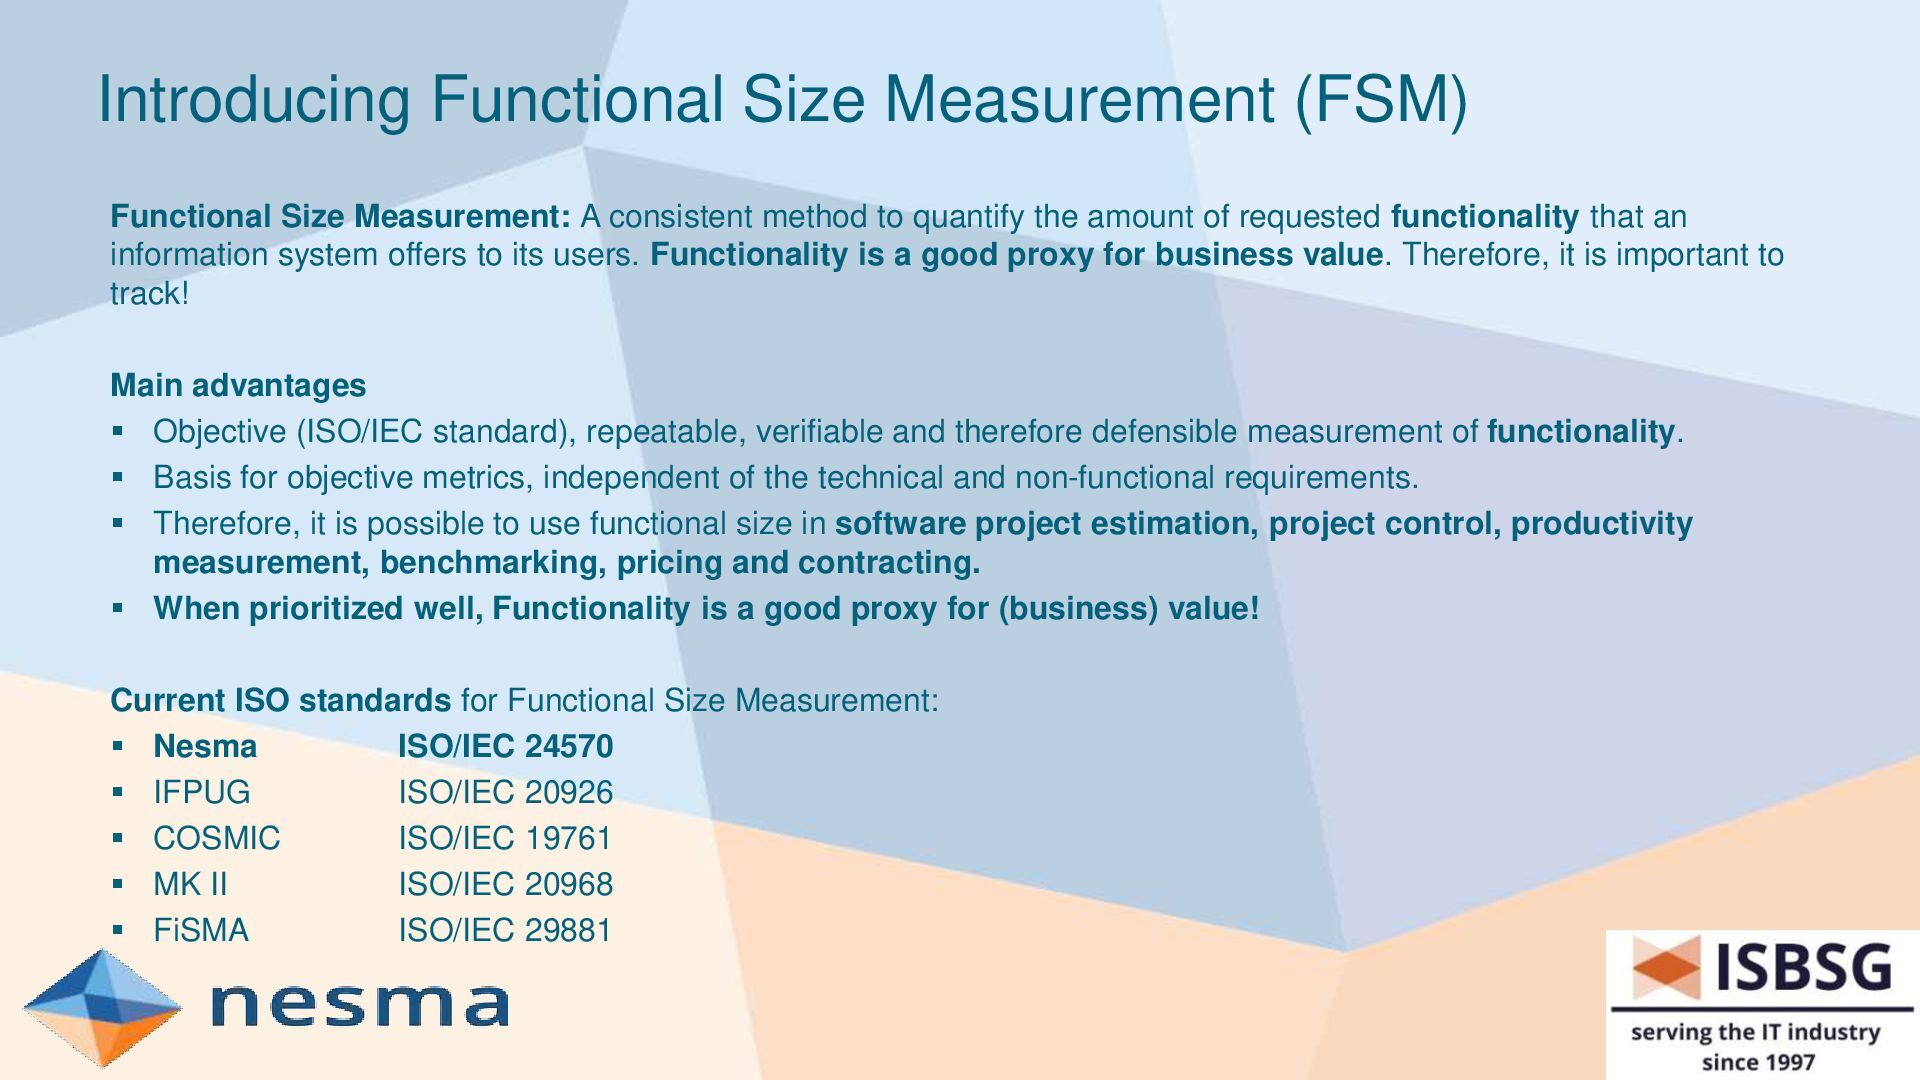
method to quantify the amount of requested functionality that an information system offers to its users. Functionality is a good proxy for business value. Therefore, it is important to track! Main advantages Objective (ISO/IEC standard), repeatable, verifiable and therefore defensible measurement of functionality. Basis for objective metrics, independent of the technical and non-functional requirements. Therefore, it is possible to use functional size in software project estimation, project control, productivity measurement, benchmarking, pricing and contracting. When prioritized well, Functionality is a good proxy for (business) value! Current ISO standards for Functional Size Measurement: Nesma ISO/IEC 24570 IFPUG ISO/IEC 20926 COSMIC ISO/IEC 19761 MK II ISO/IEC 20968 FiSMA ISO/IEC 29881
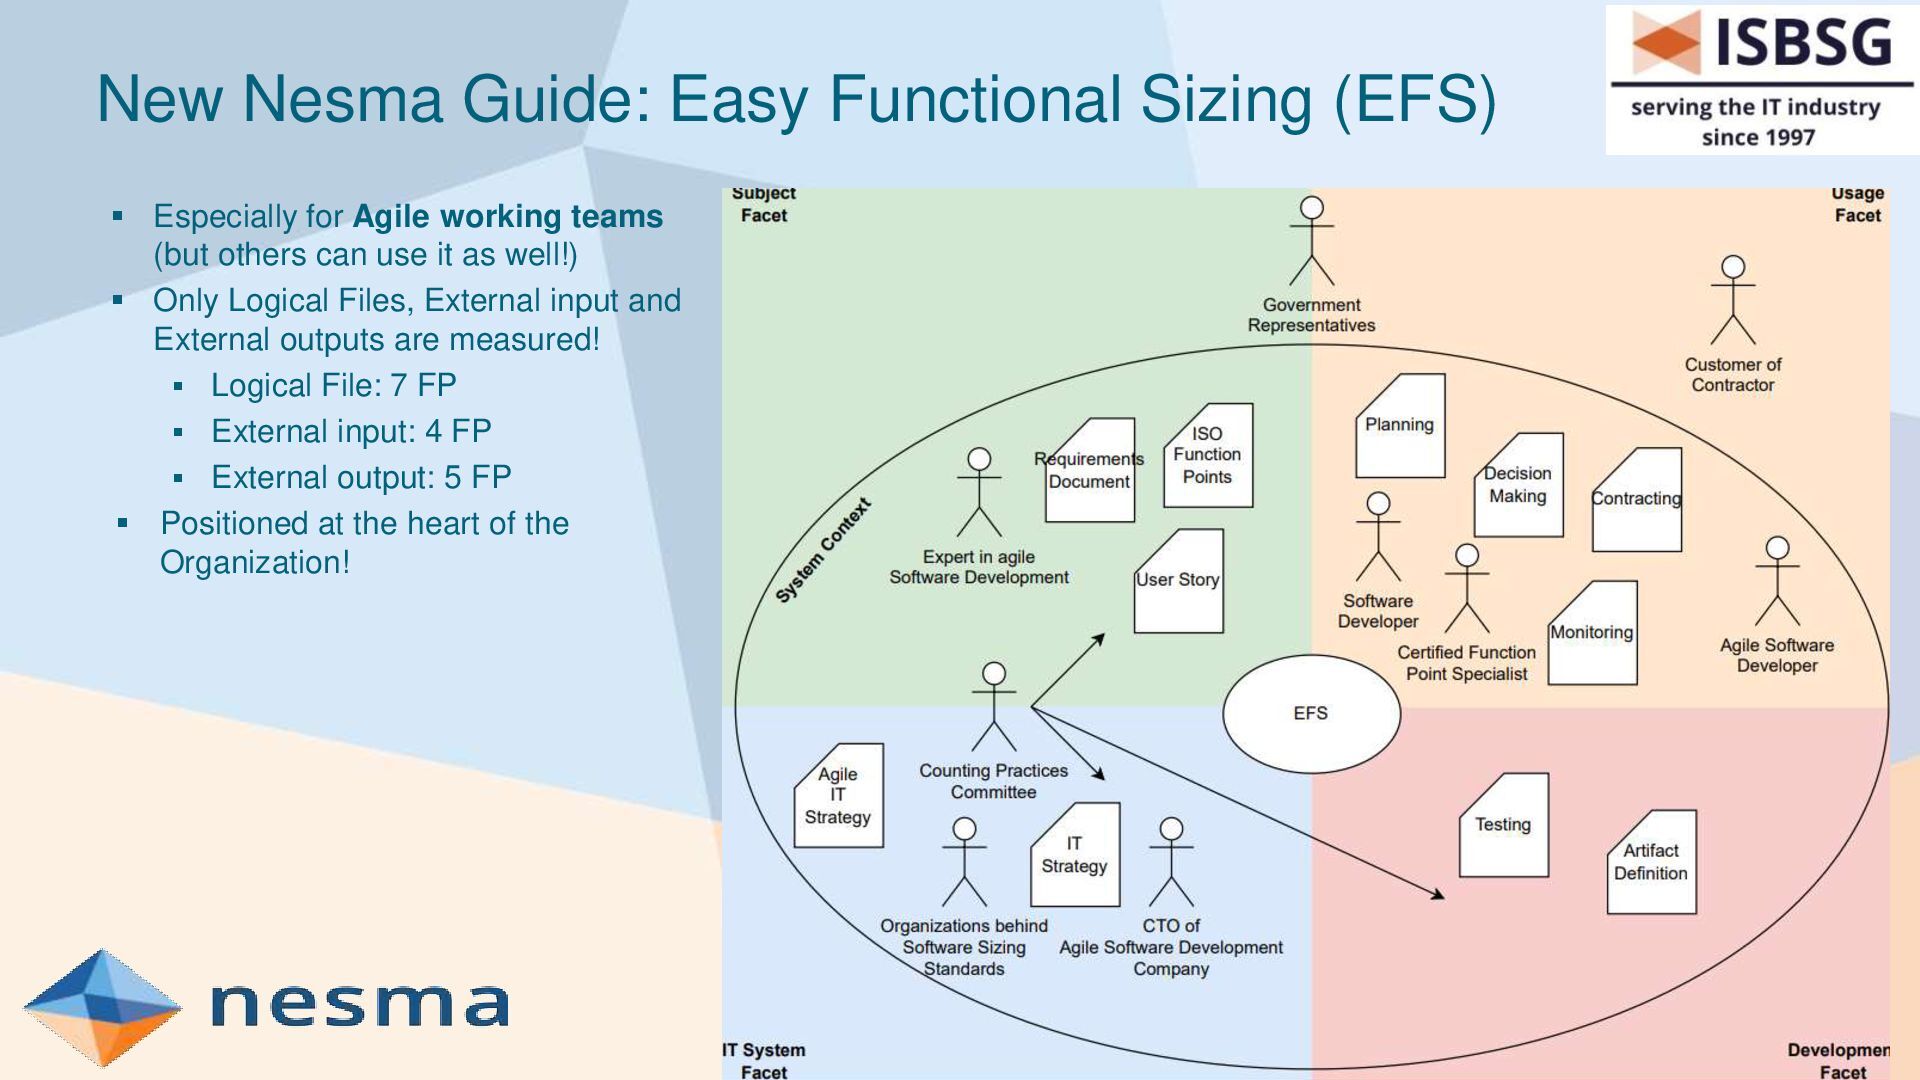
Agile working teams (but others can use it as well!) Only Logical Files, External input and External outputs are measured! Logical File: 7 FP External input: 4 FP External output: 5 FP Positioned at the heart of the Organization!
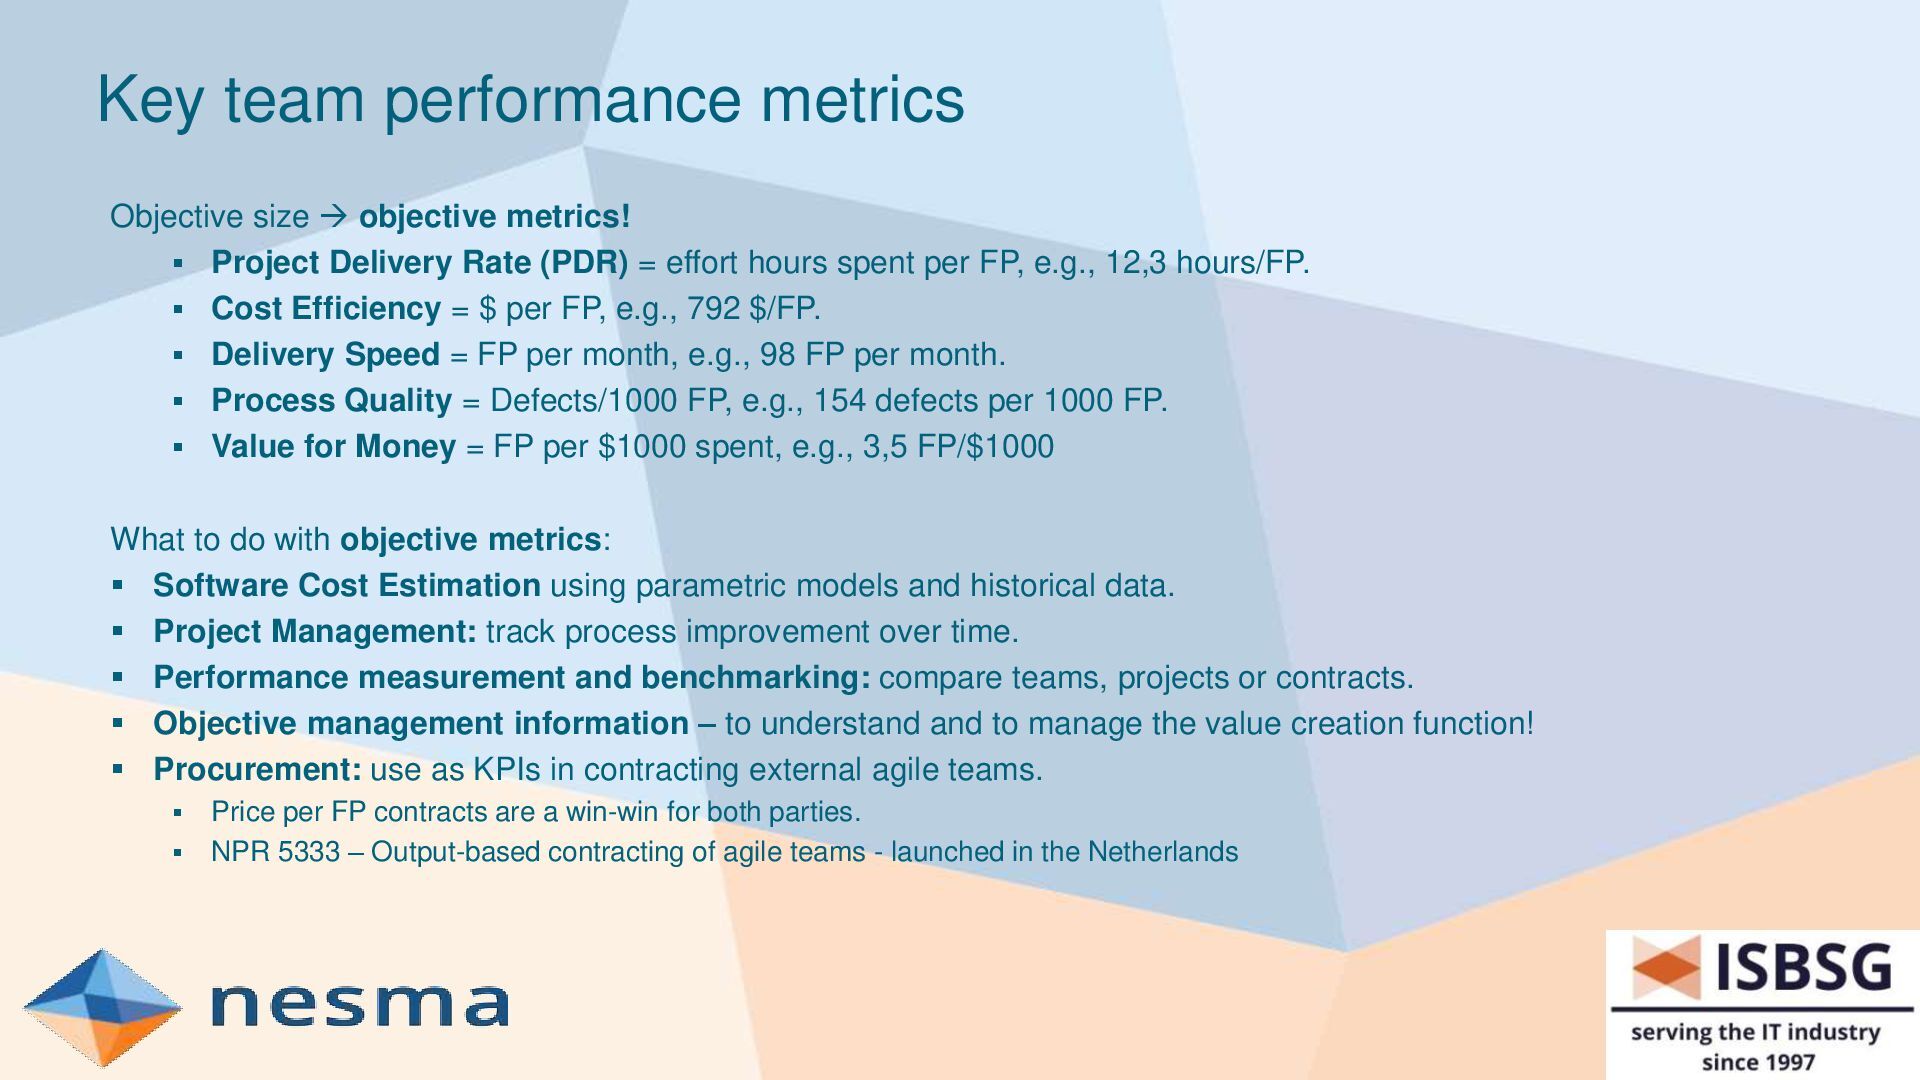
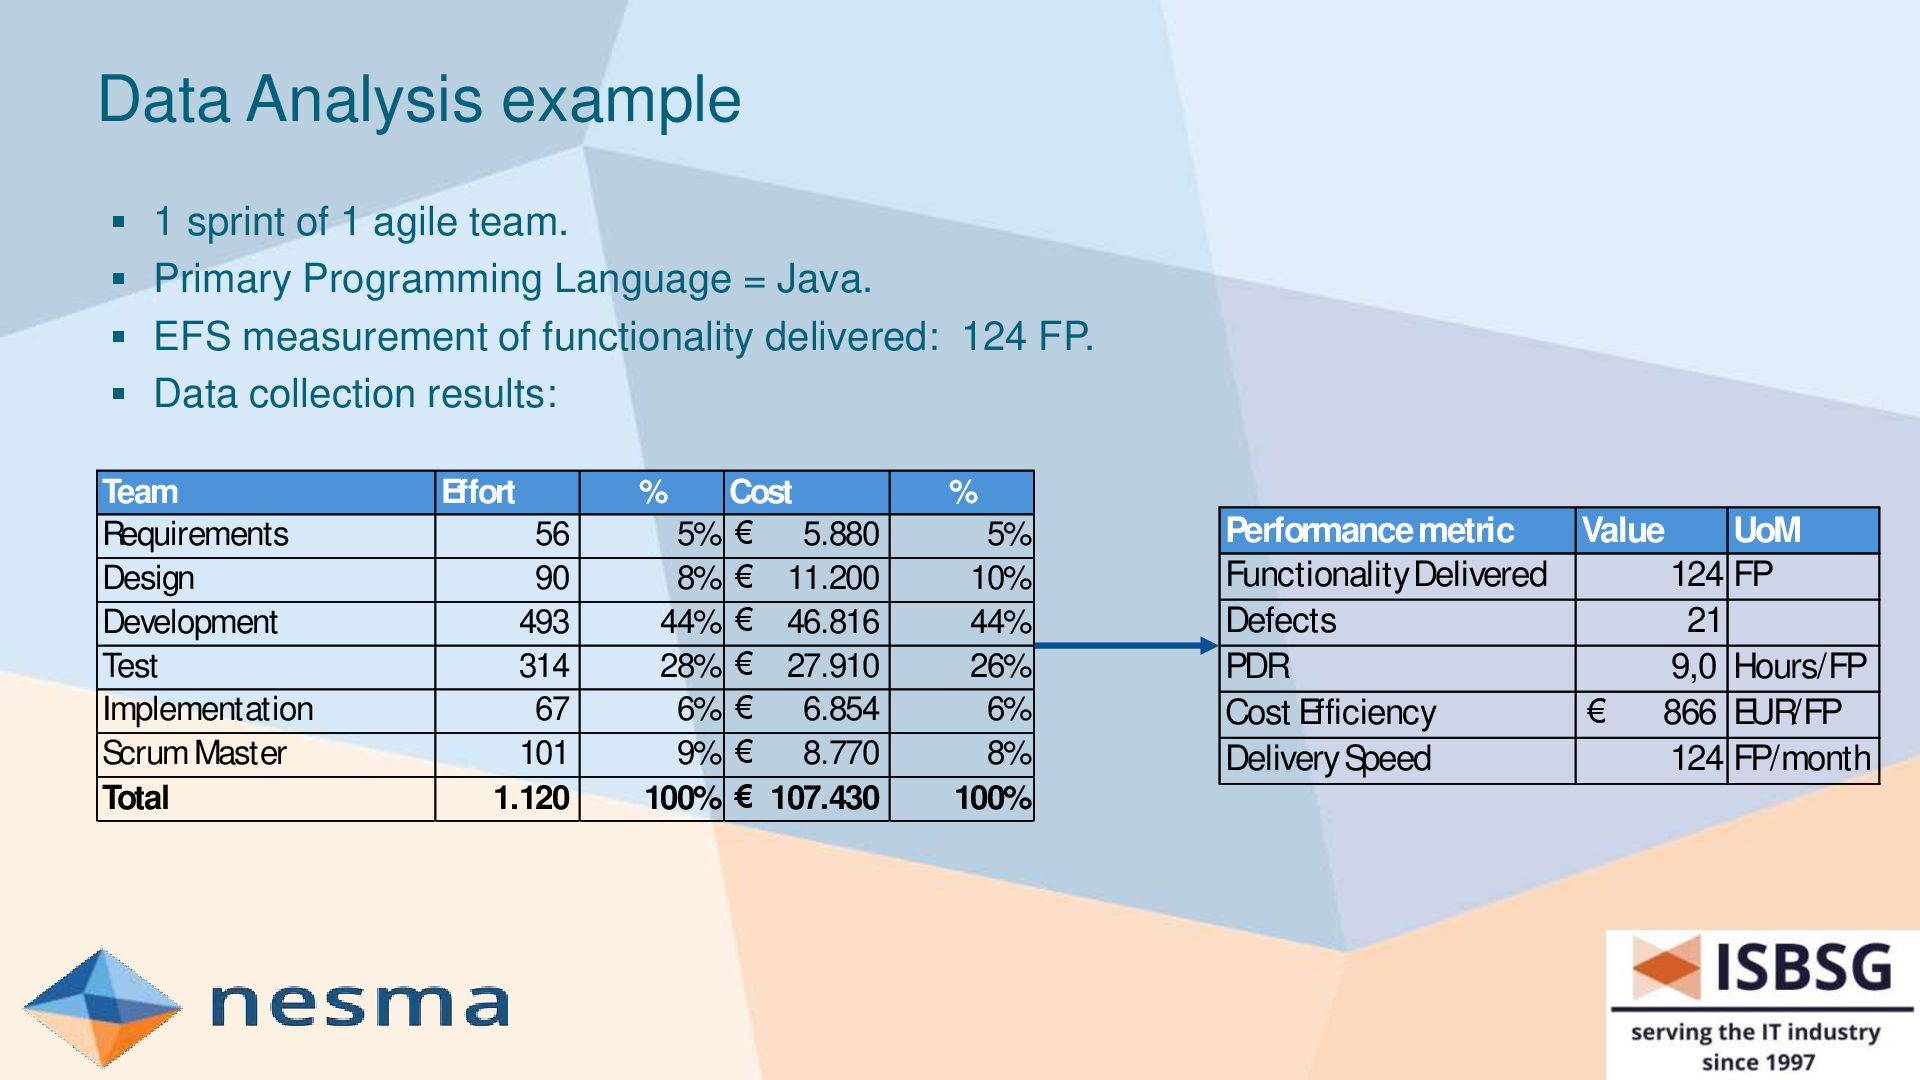
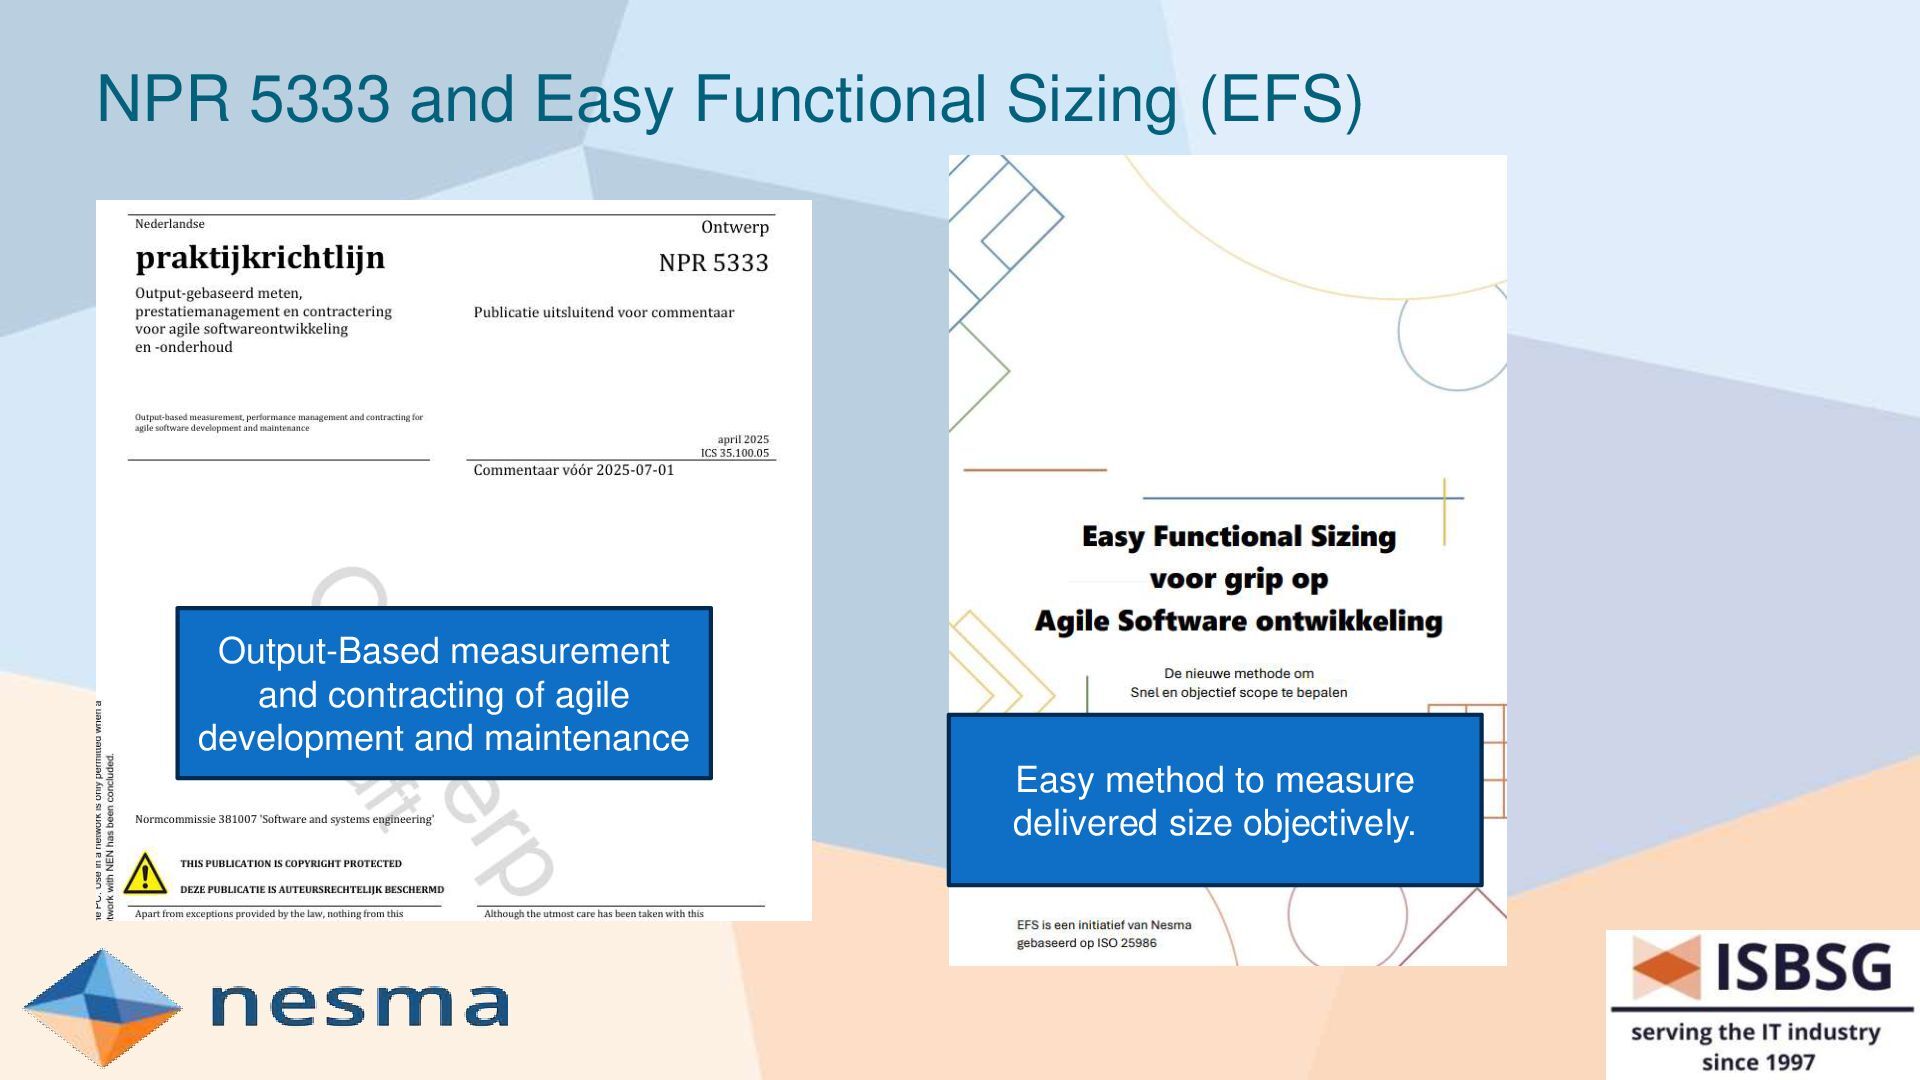
Project Delivery Rate (PDR) = effort hours spent per FP, e.g., 12,3 hours/FP. Cost Efficiency = $ per FP, e.g., 792 $/FP. Delivery Speed = FP per month, e.g., 98 FP per month. Process Quality = Defects/1000 FP, e.g., 154 defects per 1000 FP. Value for Money = FP per $1000 spent, e.g., 3,5 FP/$1000 What to do with objective metrics: Software Cost Estimation using parametric models and historical data. Project Management: track process improvement over time. Performance measurement and benchmarking: compare teams, projects or contracts. Objective management information – to understand and to manage the value creation function! Procurement: use as KPIs in contracting external agile teams. Price per FP contracts are a win-win for both parties. NPR 5333 – Output-based contracting of agile teams - launched in the Netherlands
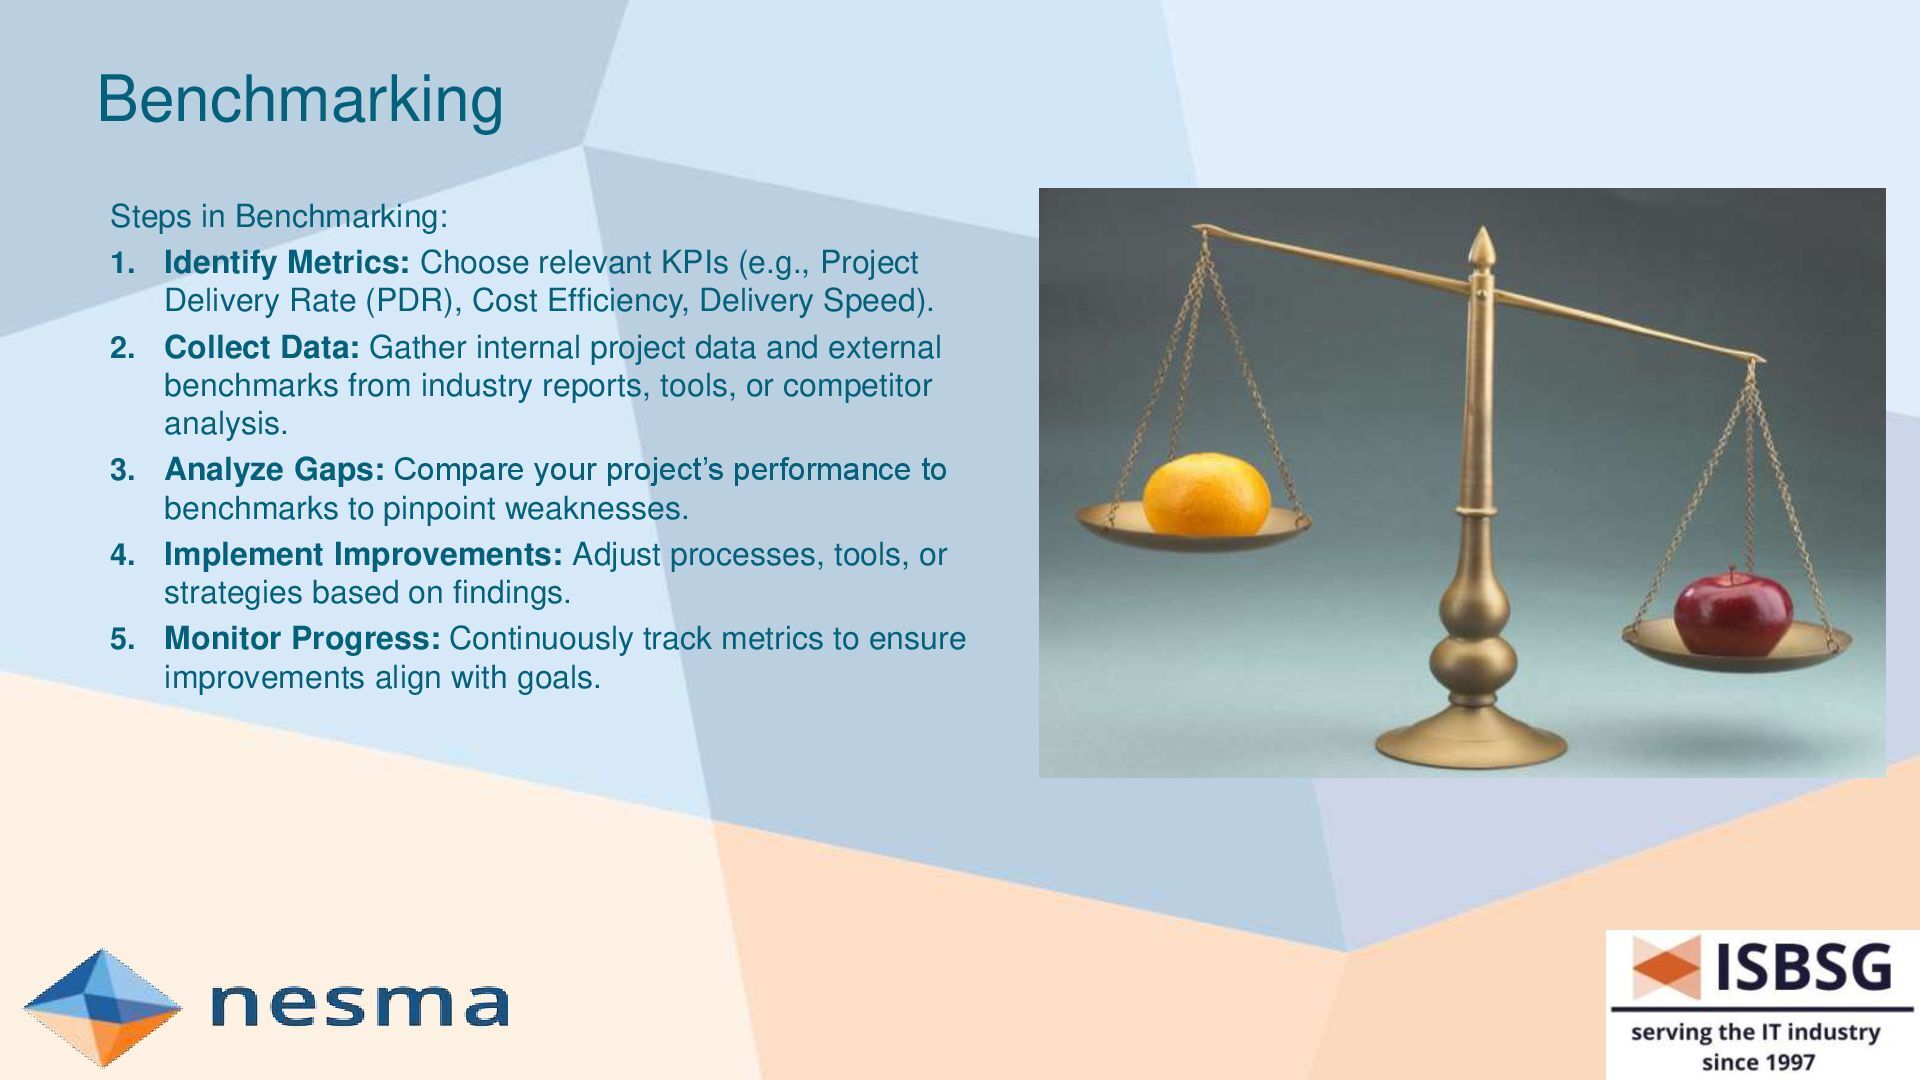
(e.g., Project Delivery Rate (PDR), Cost Efficiency, Delivery Speed). 2. Collect Data: Gather internal project data and external benchmarks from industry reports, tools, or competitor analysis. 3. Analyze Gaps: Compare your project’s performance to benchmarks to pinpoint weaknesses. 4. Implement Improvements: Adjust processes, tools, or strategies based on findings. 5. Monitor Progress: Continuously track metrics to ensure improvements align with goals.
Benchmarking Standards Group (ISBSG ), founded in 1997, is a non-profit organization dedicated to establishing and promoting industry standards for software development and maintenance benchmarking. They provide a comprehensive data repository of real-world project metrics from leading organizations worldwide. Mission: “To improve the management of IT resources by both business and government, through the provision and exploitation of public repositories of software engineering knowledge that are standardized, verified, recent and representative of current technologies” Nesma has been a Gold Partner of ISBSG since its establishment in 1997. This long-standing partnership signifies our deep commitment to: Reliable Benchmarking Data: Nesma leverage ISBSG data to allow our members to use the most up-to-date and reliable industry data for benchmarking, estimation, outsourcing, performance measurement, research and analysis, etc. Nesma members are encouraged to submit data and receive large discounts on ISBSG data. Advanced Benchmarking Expertise: Nesma shares extensive knowledge of ISBSG data and methodologies, allowing our members to deliver insightful analyses and actionable recommendations. Continuous Improvement: Nesma actively collaborates with ISBSG to contribute to the evolution of software benchmarking standards and best practices.
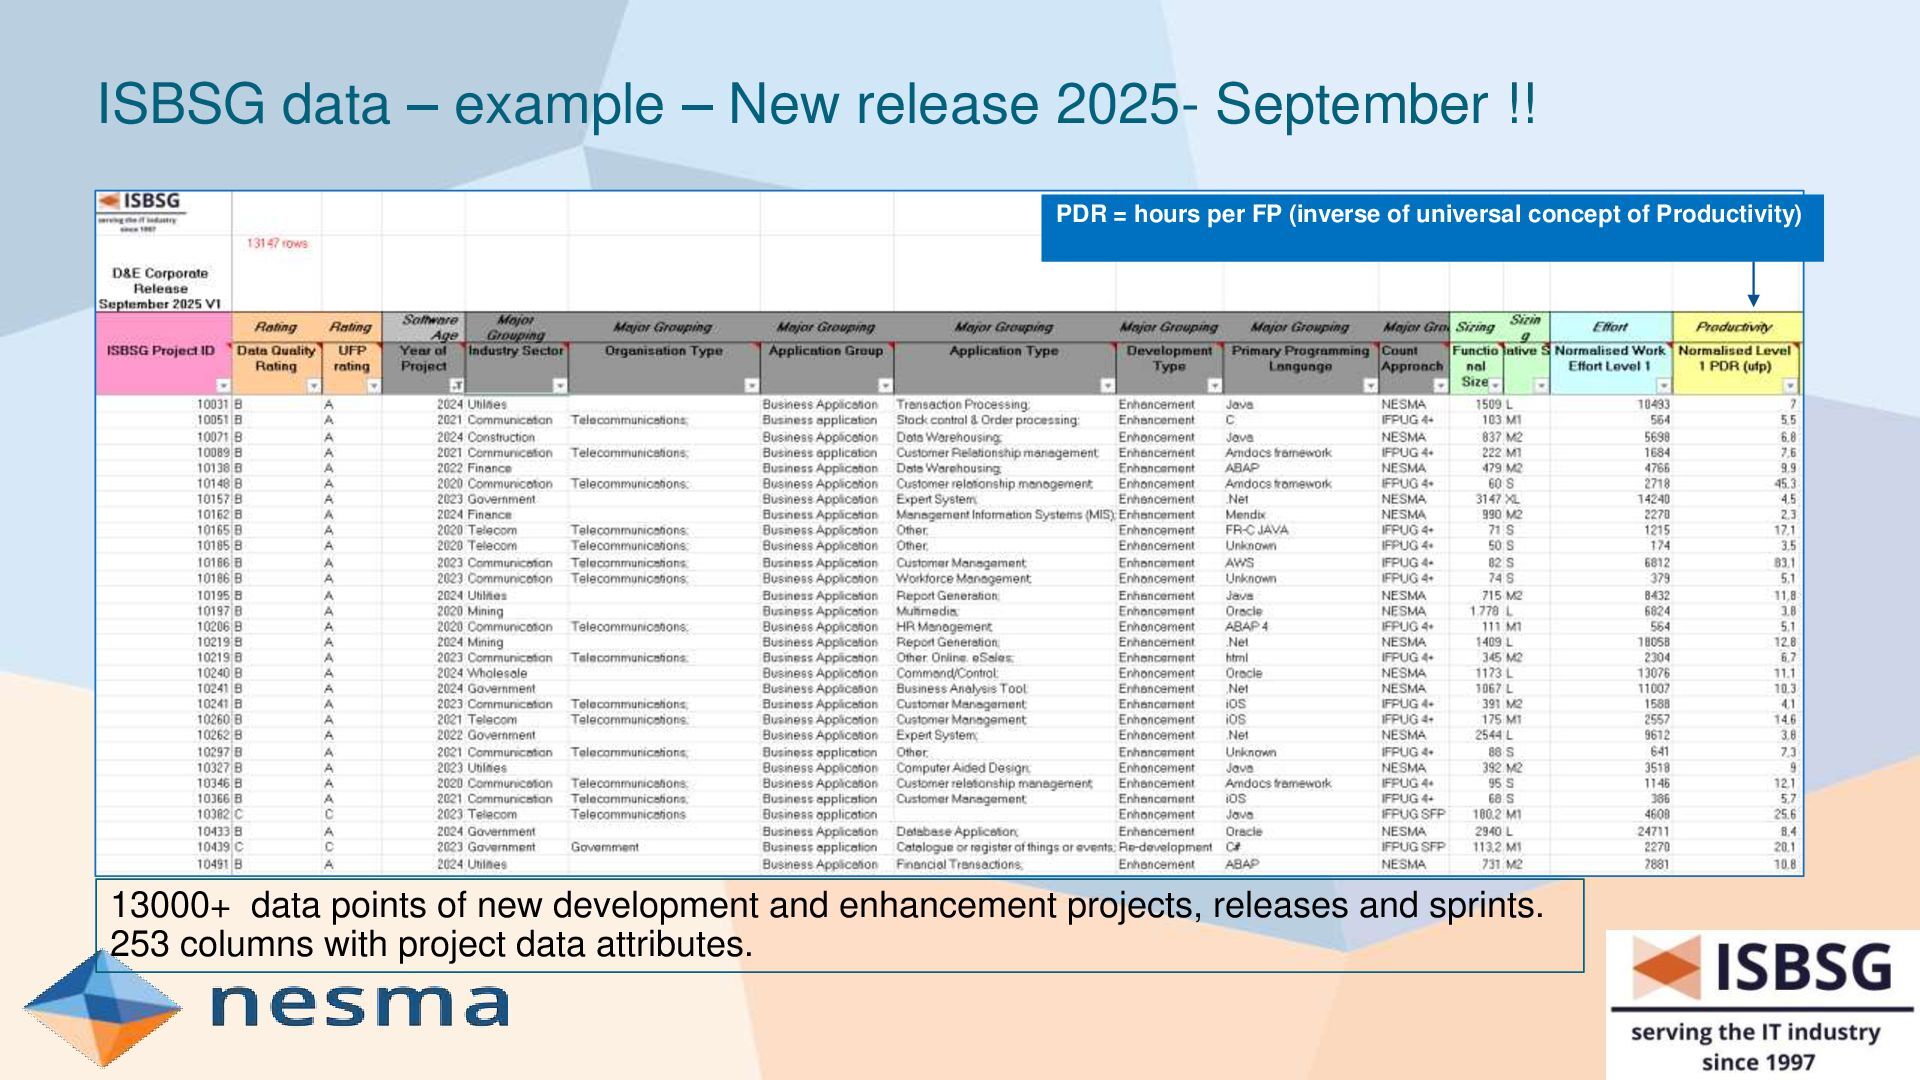
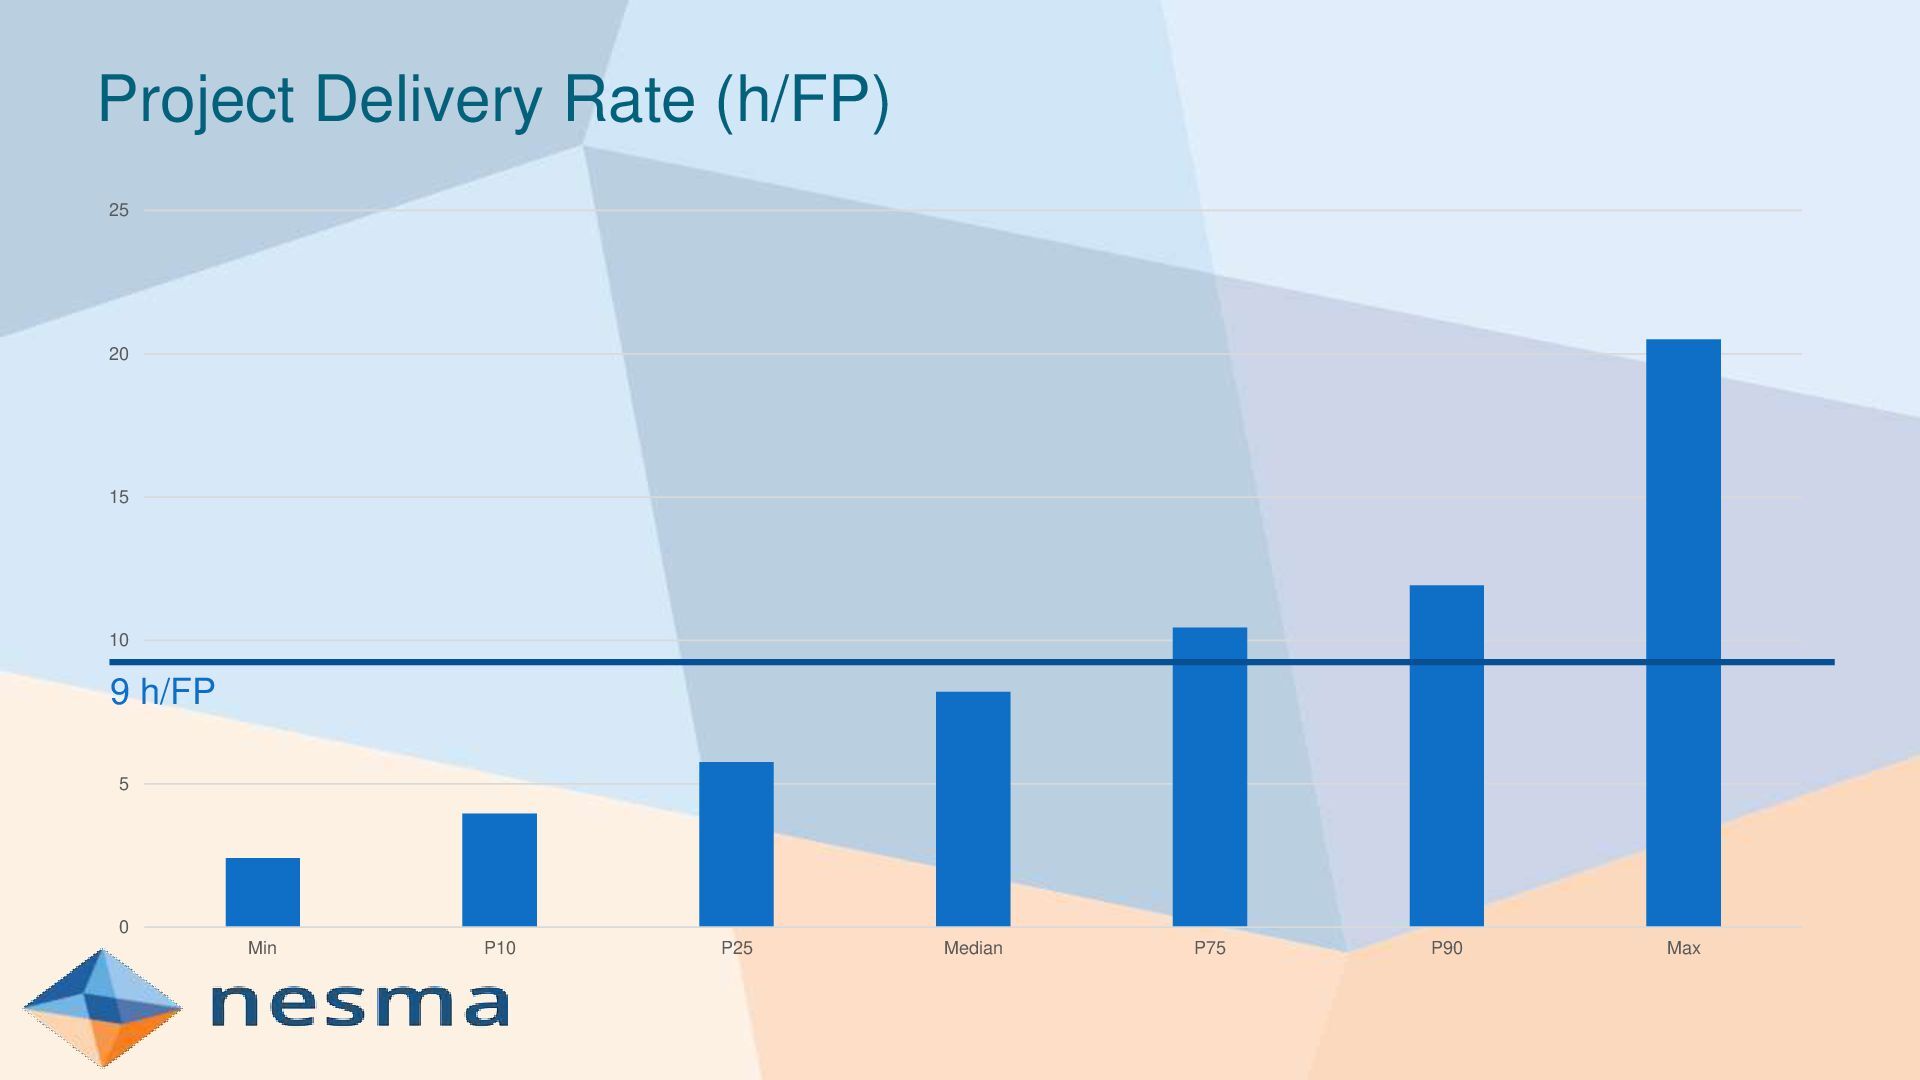
PDR = hours per FP (inverse of universal concept of Productivity) 13000+ data points of new development and enhancement projects, releases and sprints. 253 columns with project data attributes.
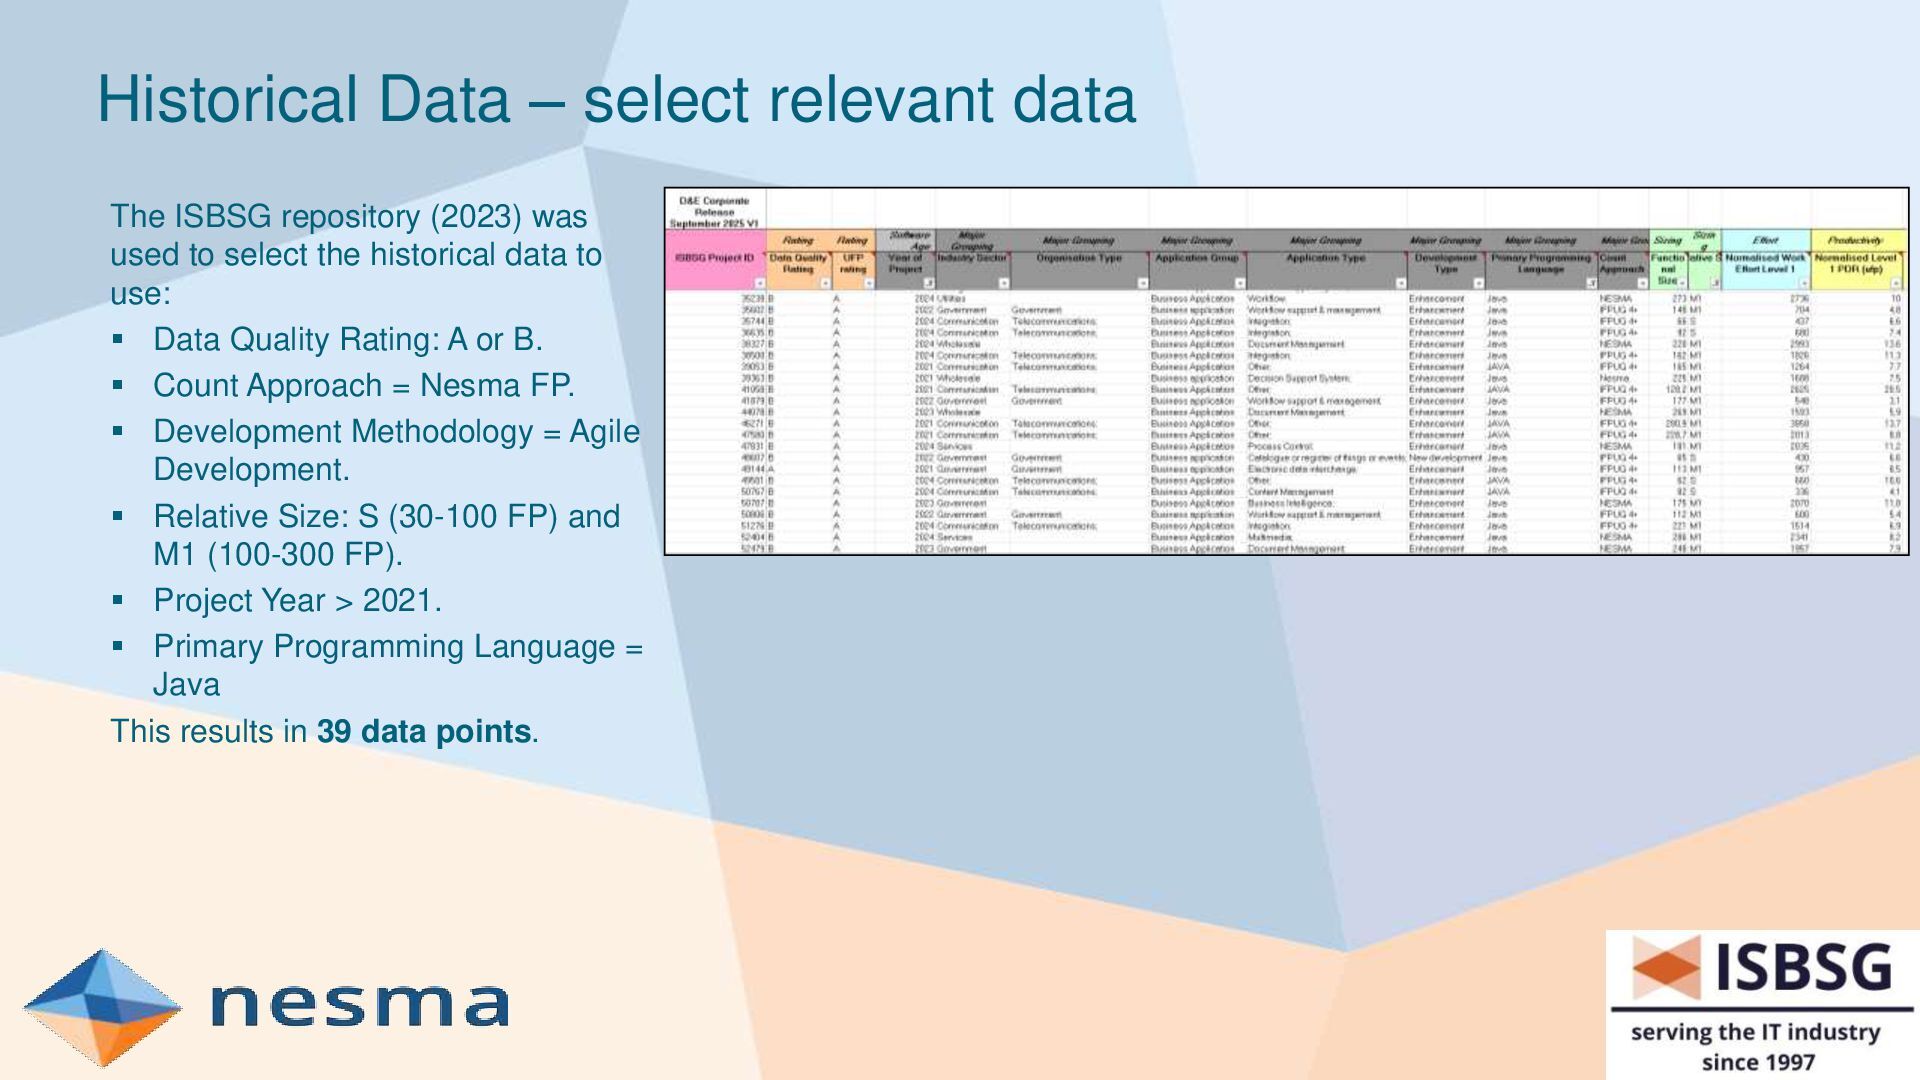
was used to select the historical data to use: Data Quality Rating: A or B. Count Approach = Nesma FP. Development Methodology = Agile Development. Relative Size: S (30-100 FP) and M1 (100-300 FP). Project Year > 2021. Primary Programming Language = Java This results in 39 data points.
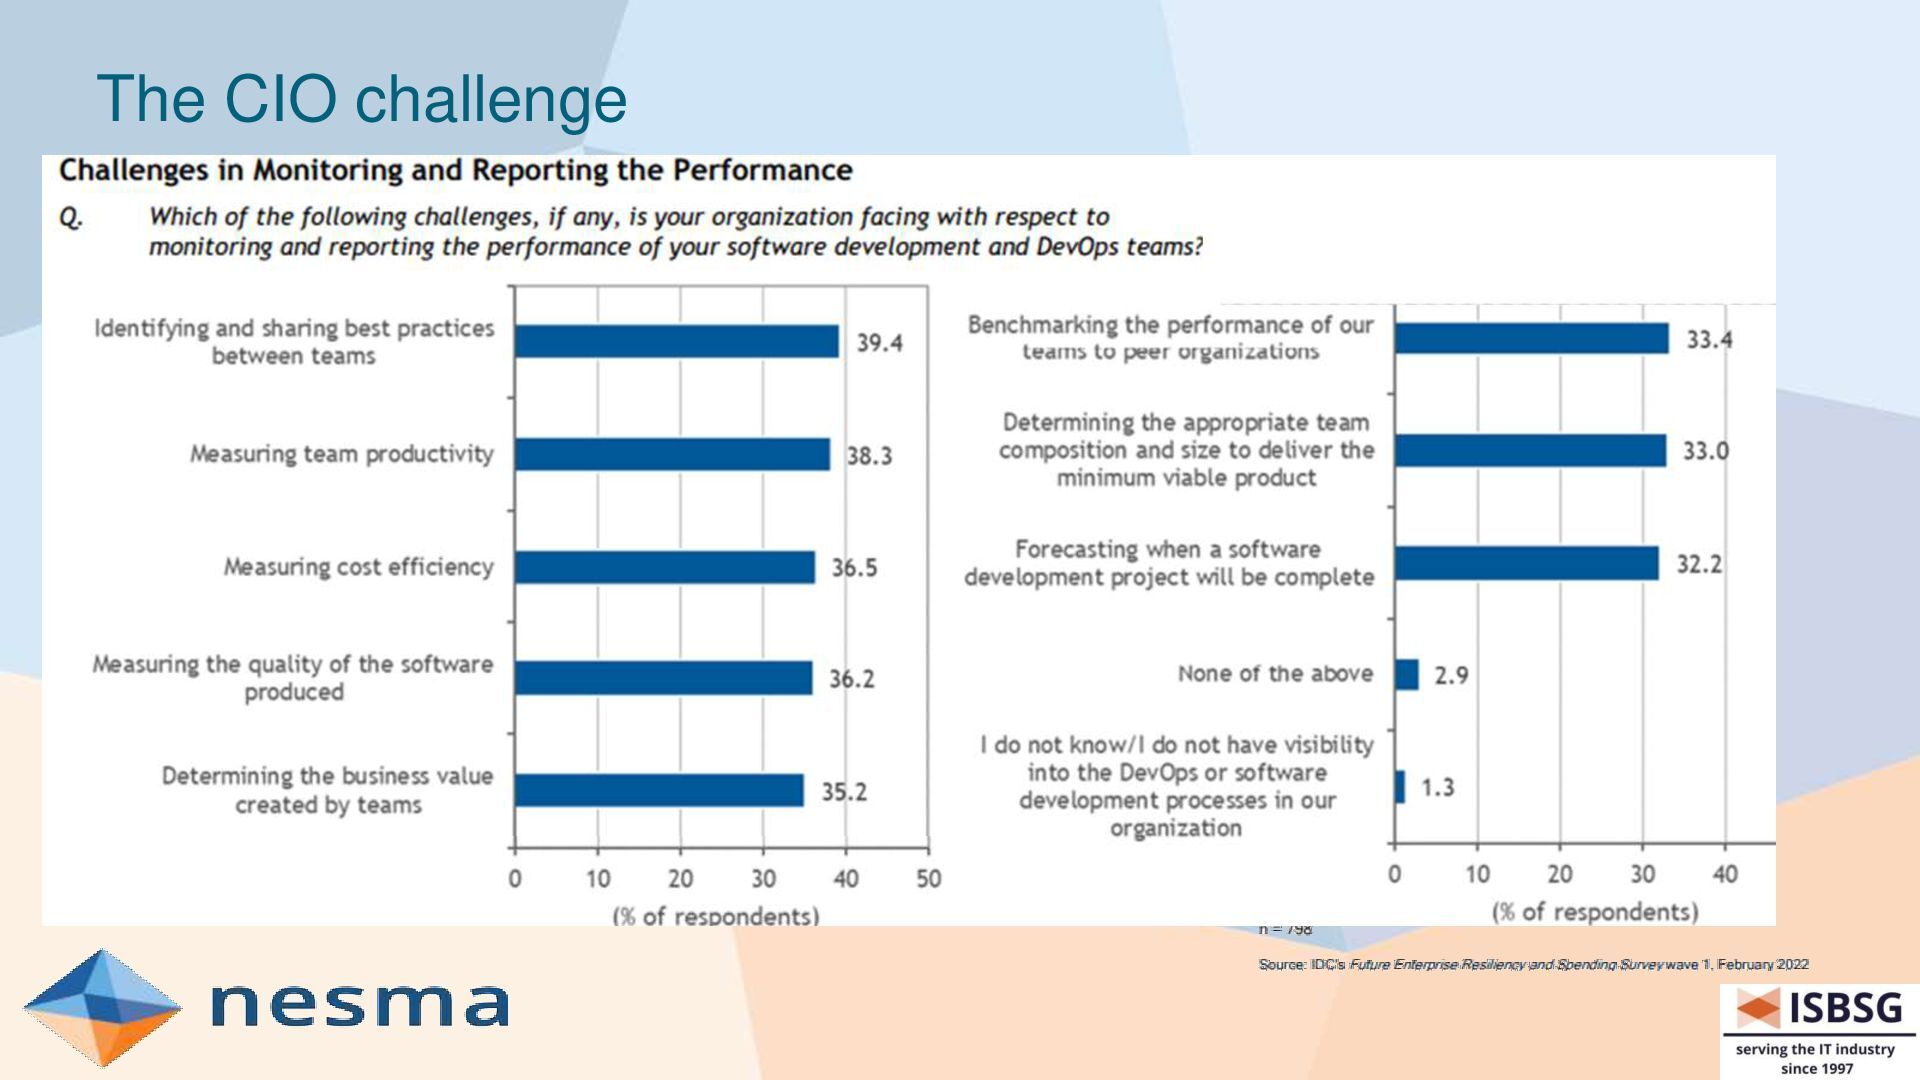
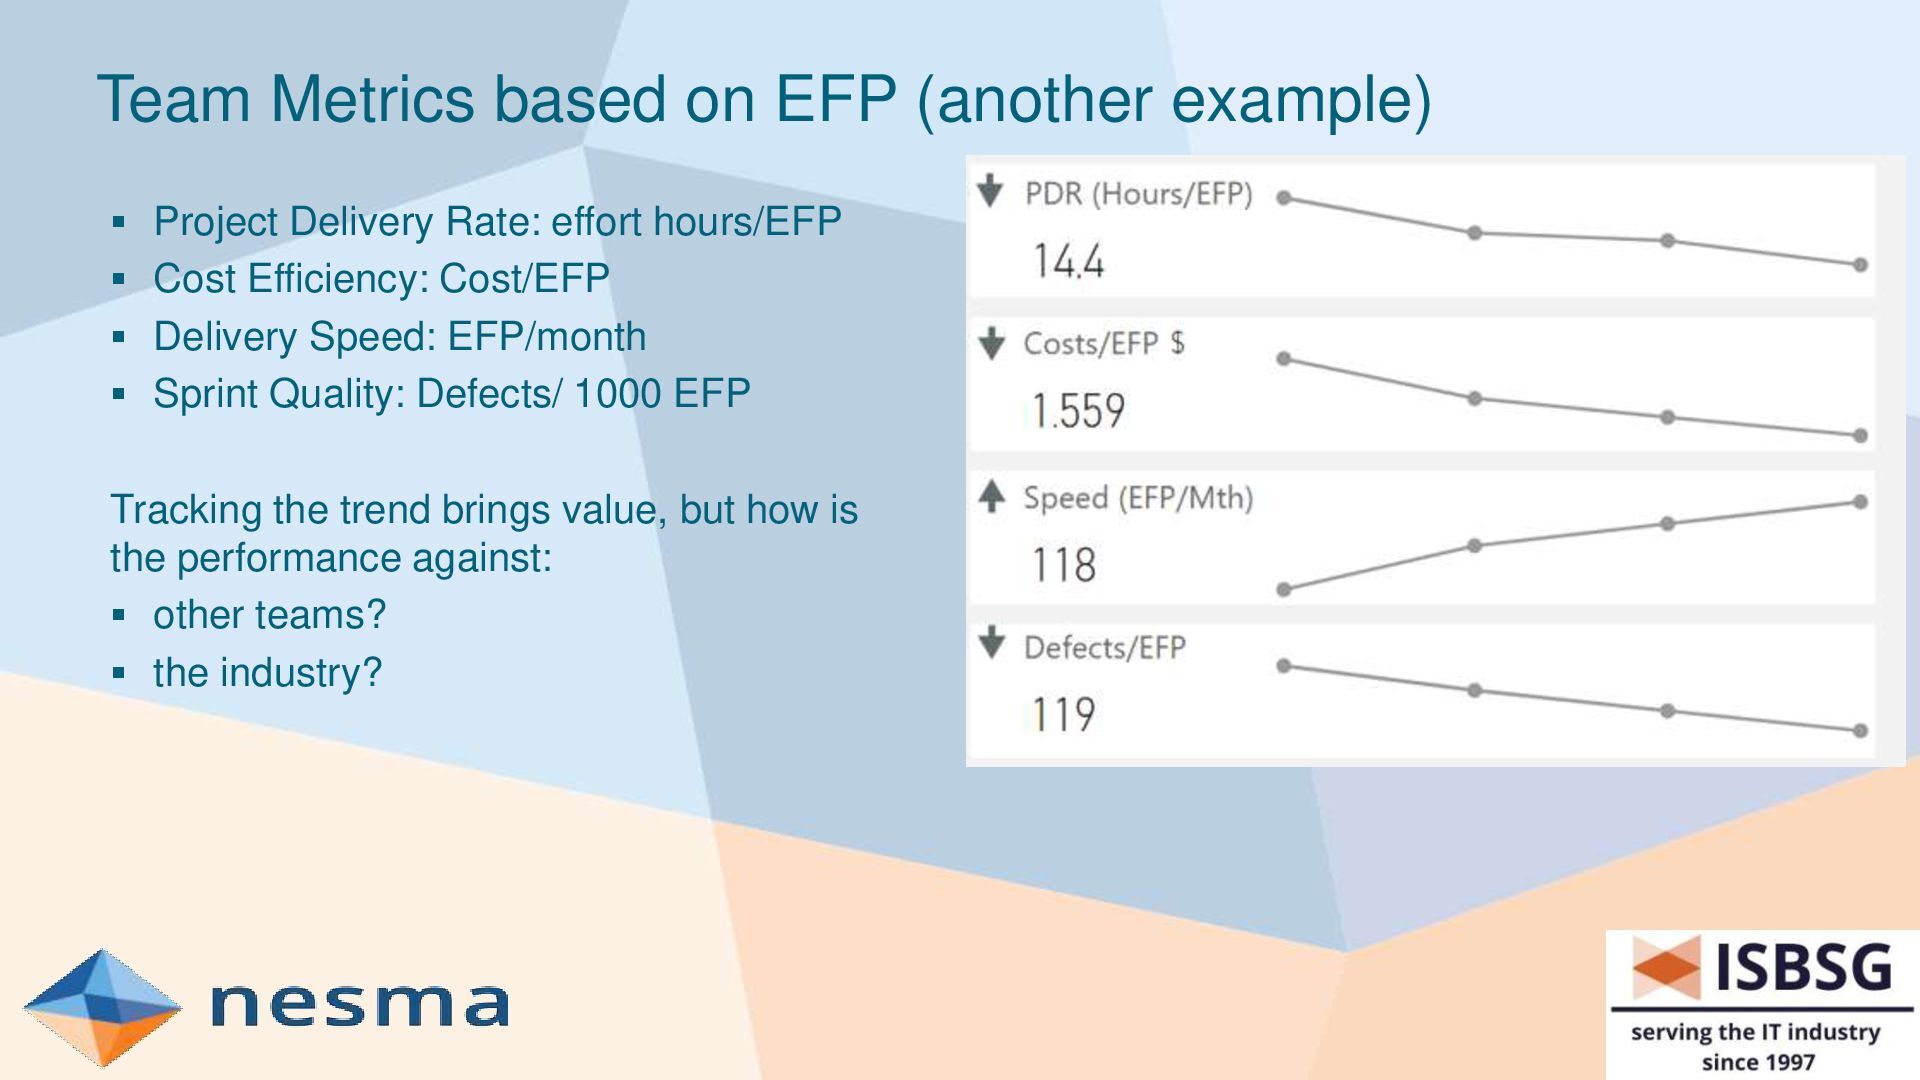
Rate: effort hours/EFP Cost Efficiency: Cost/EFP Delivery Speed: EFP/month Sprint Quality: Defects/ 1000 EFP Tracking the trend brings value, but how is the performance against: other teams? the industry?
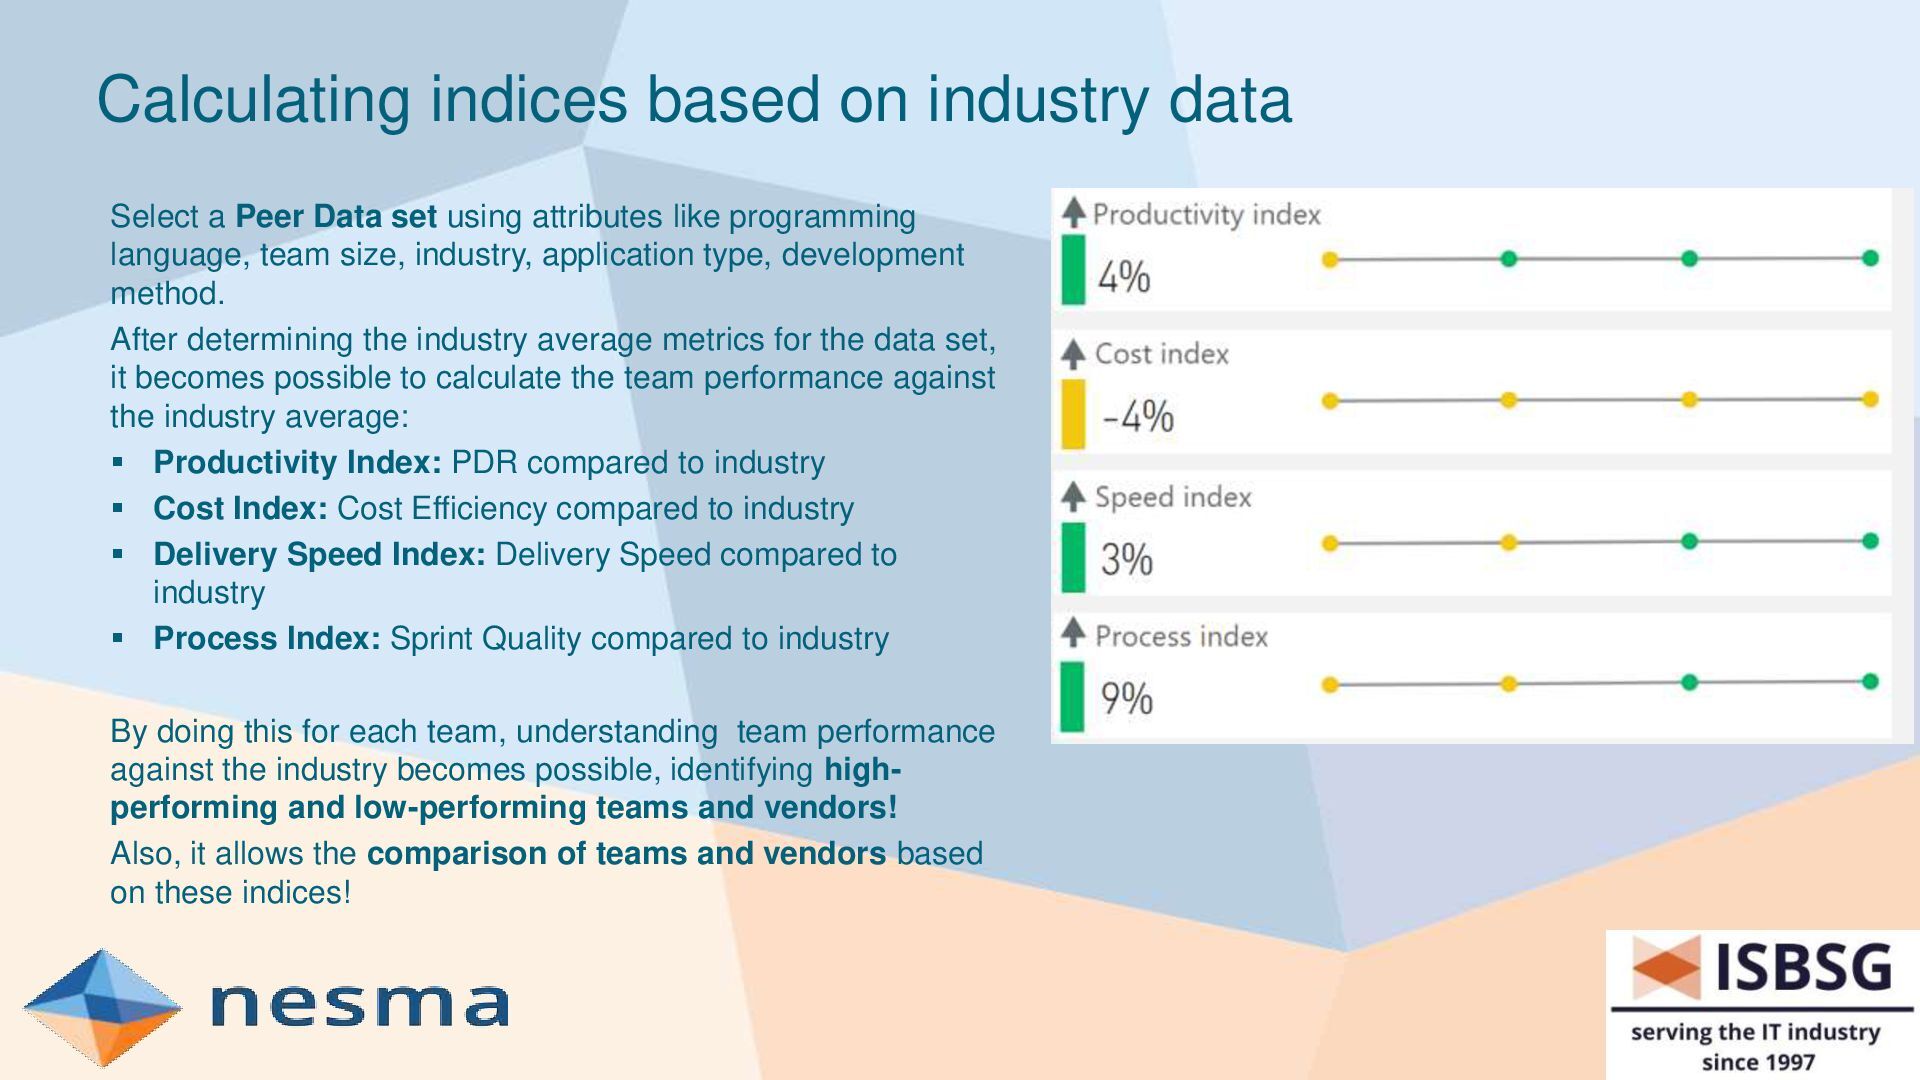
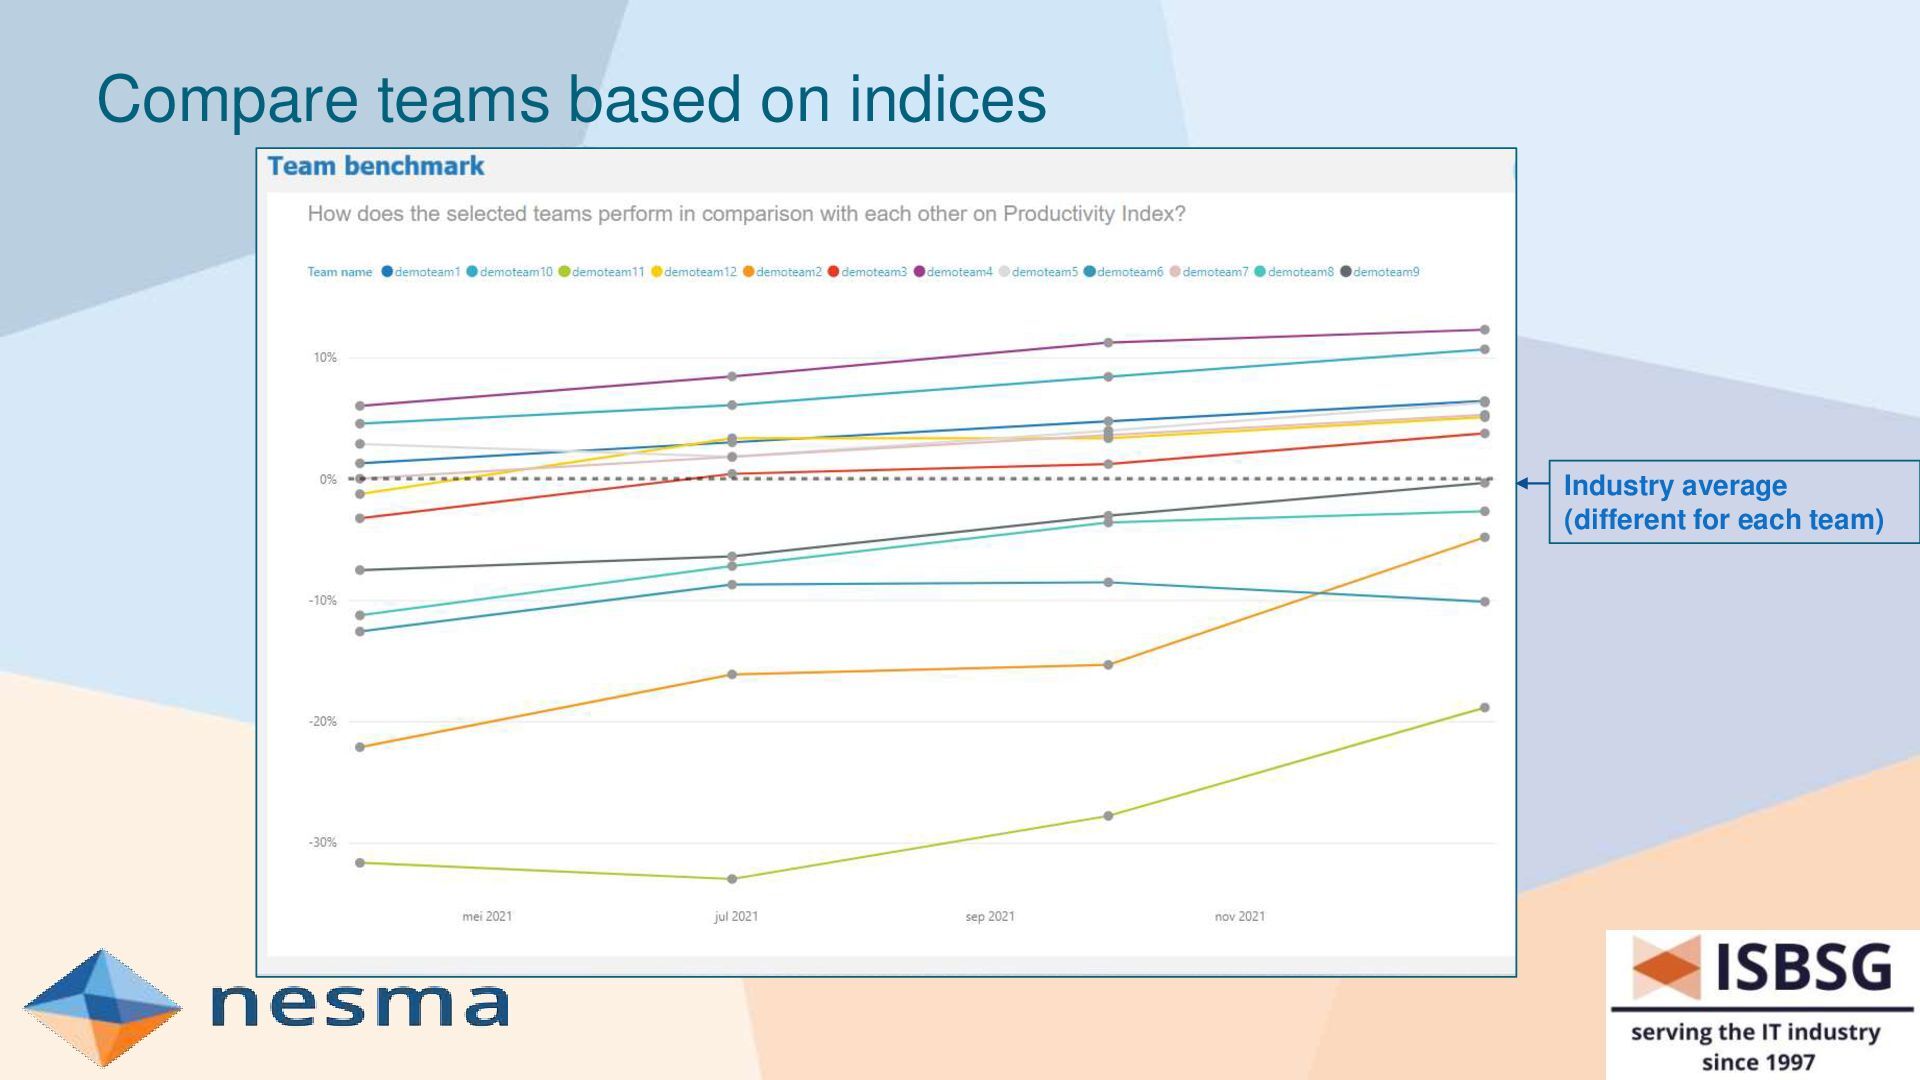
set using attributes like programming language, team size, industry, application type, development method. After determining the industry average metrics for the data set, it becomes possible to calculate the team performance against the industry average: Productivity Index: PDR compared to industry Cost Index: Cost Efficiency compared to industry Delivery Speed Index: Delivery Speed compared to industry Process Index: Sprint Quality compared to industry By doing this for each team, understanding team performance against the industry becomes possible, identifying high- performing and low-performing teams and vendors! Also, it allows the comparison of teams and vendors based on these indices!
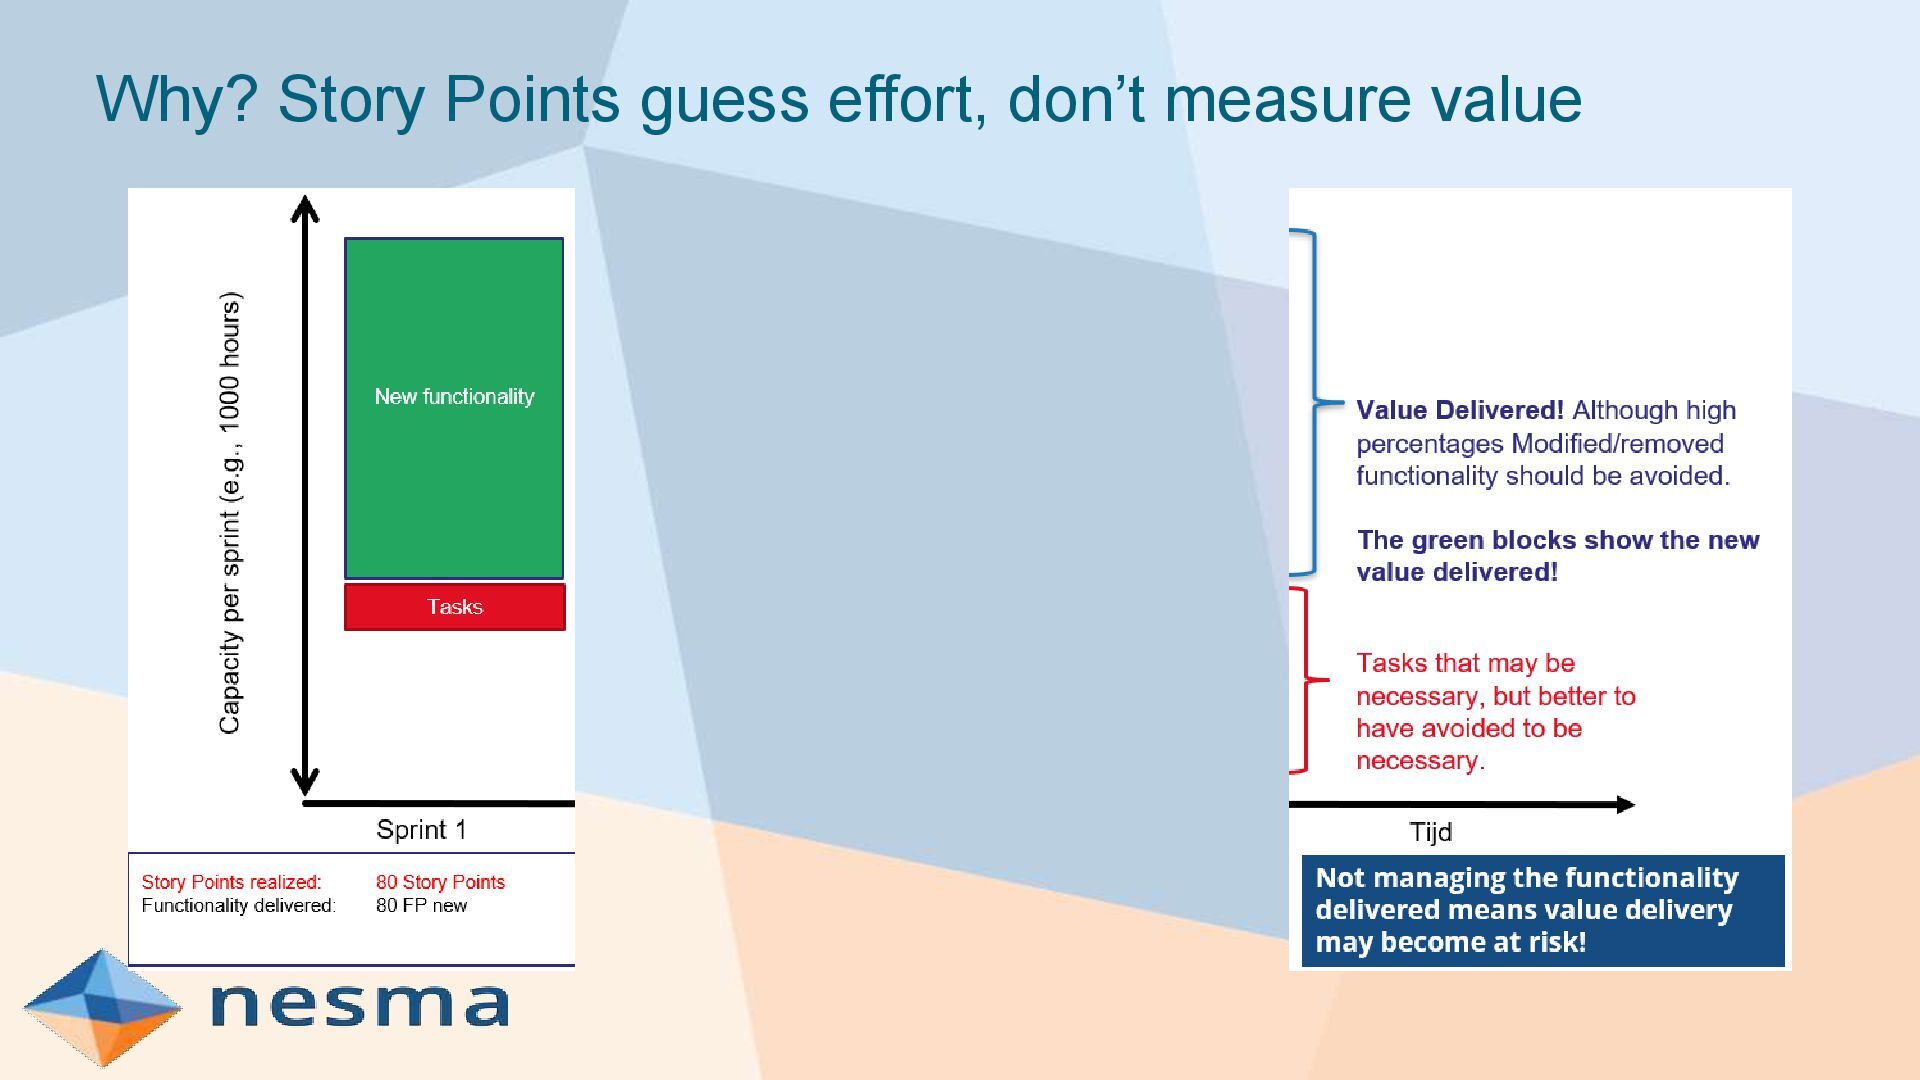
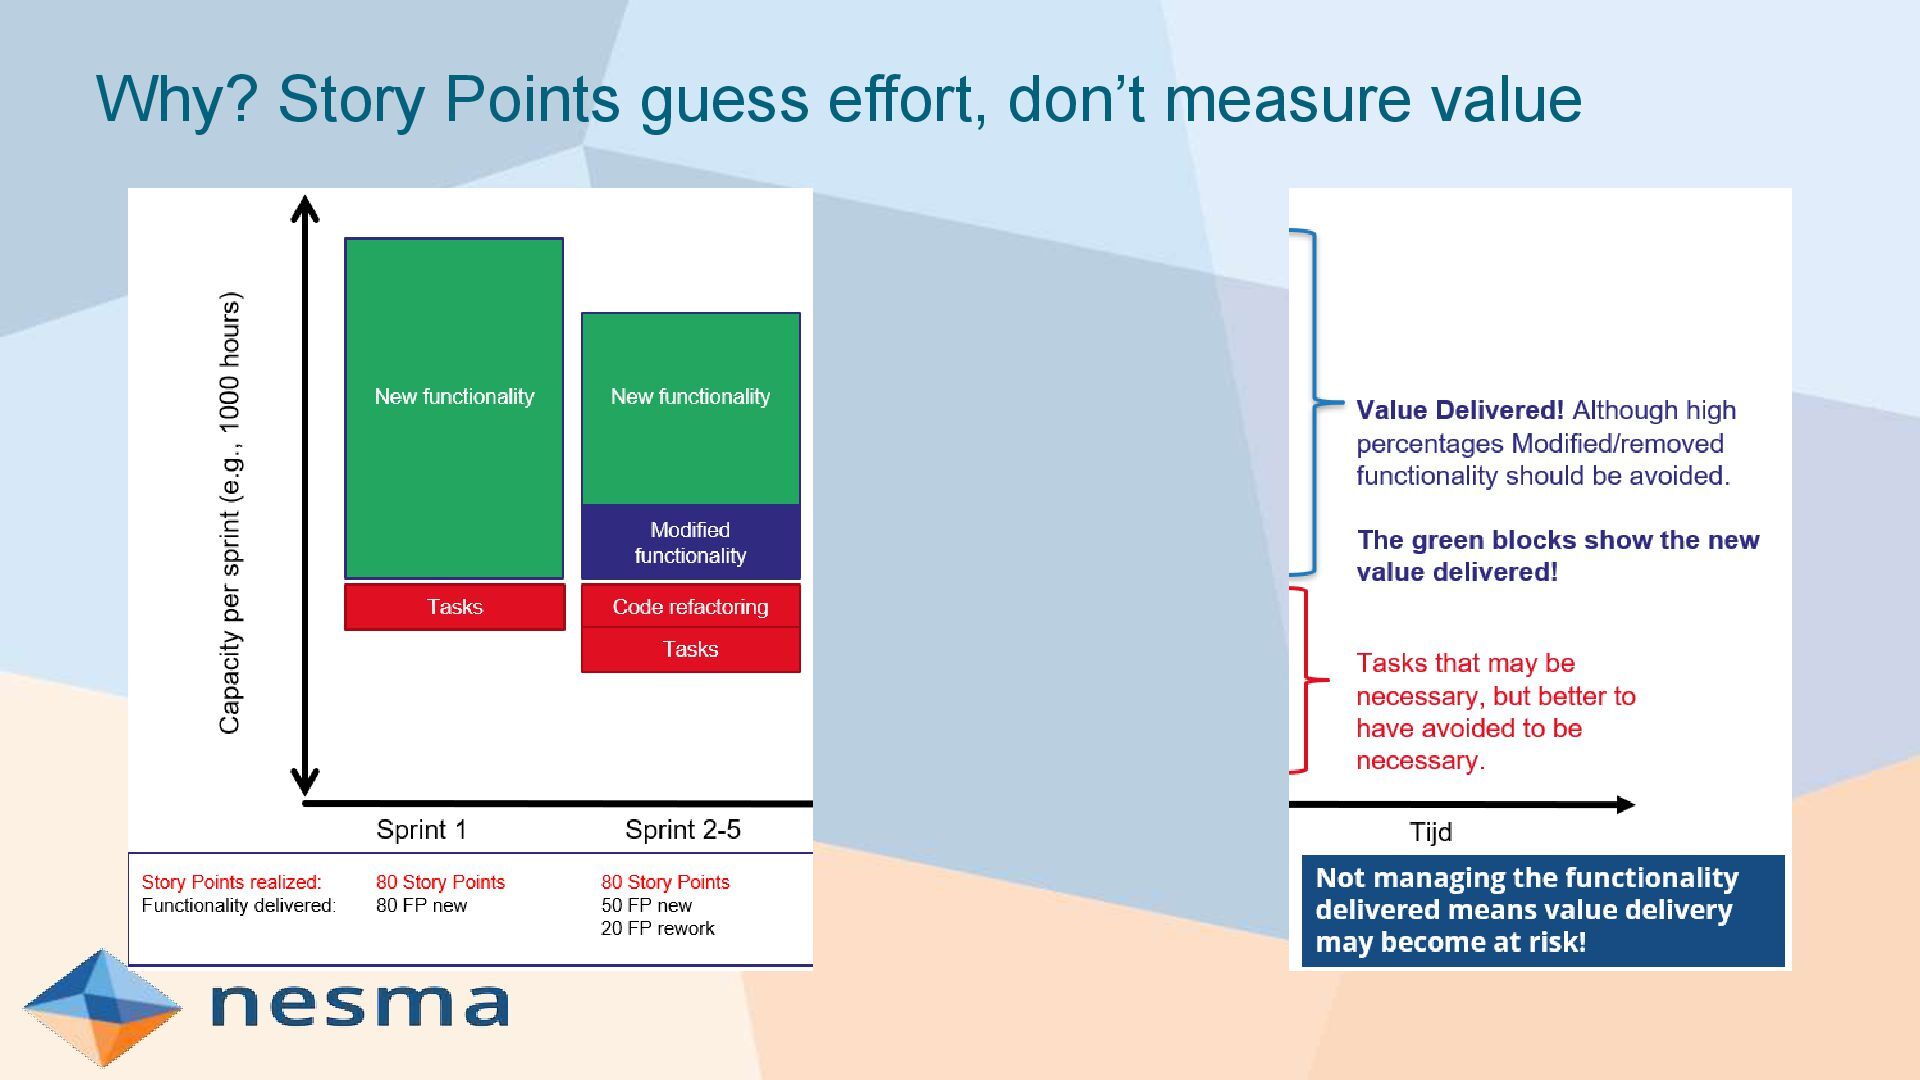
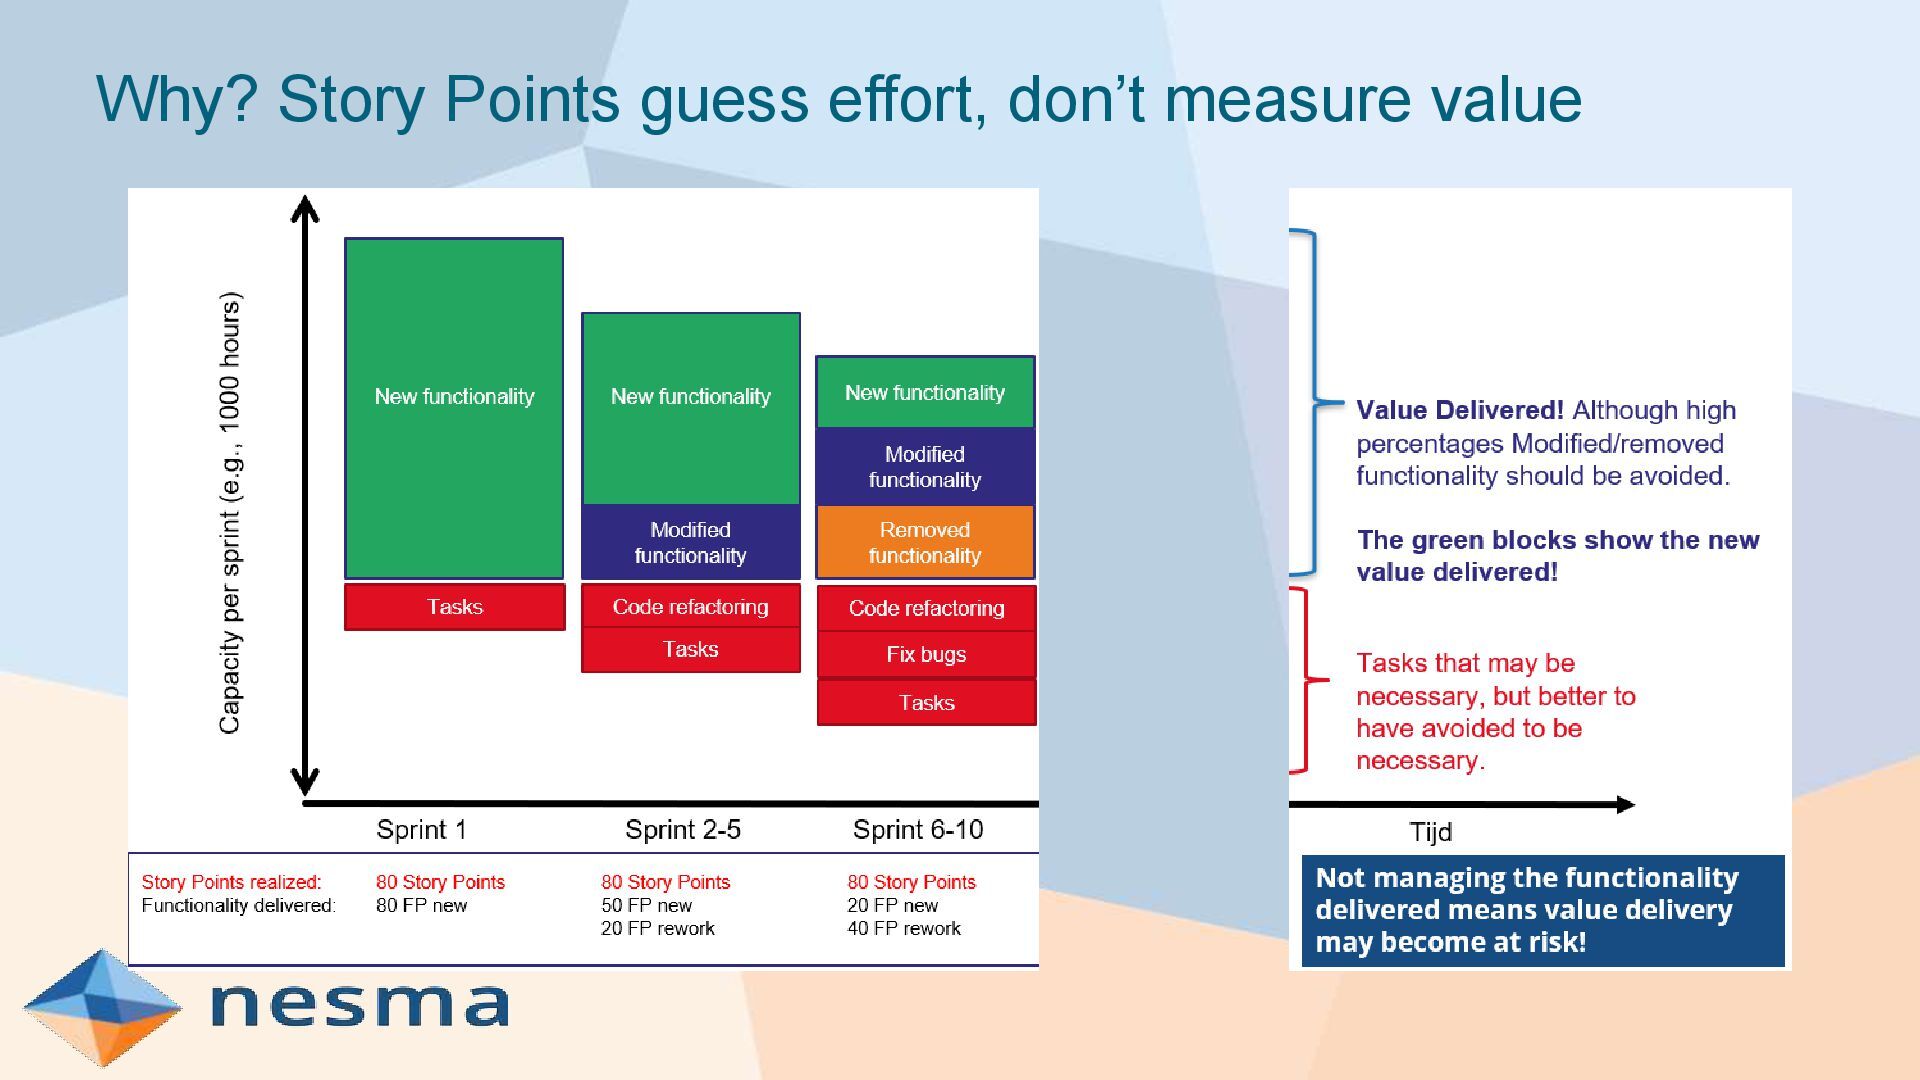
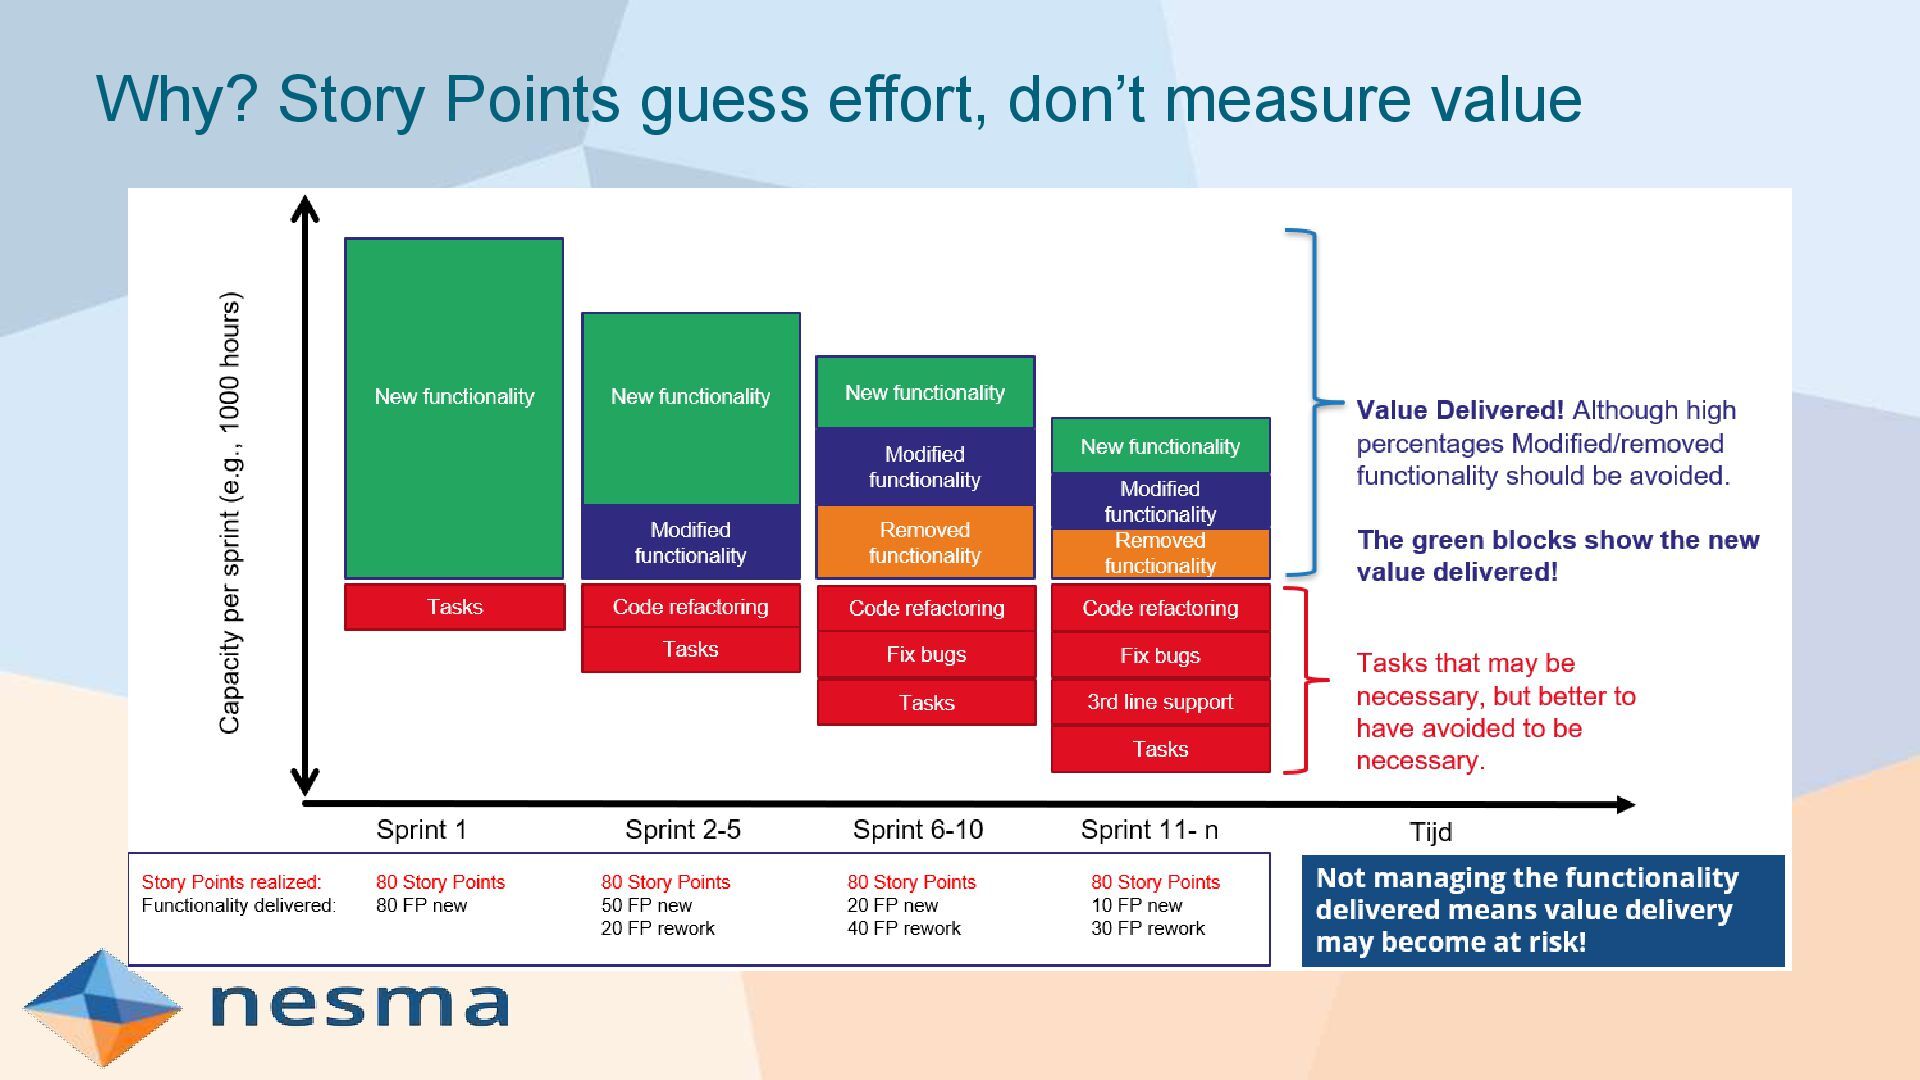
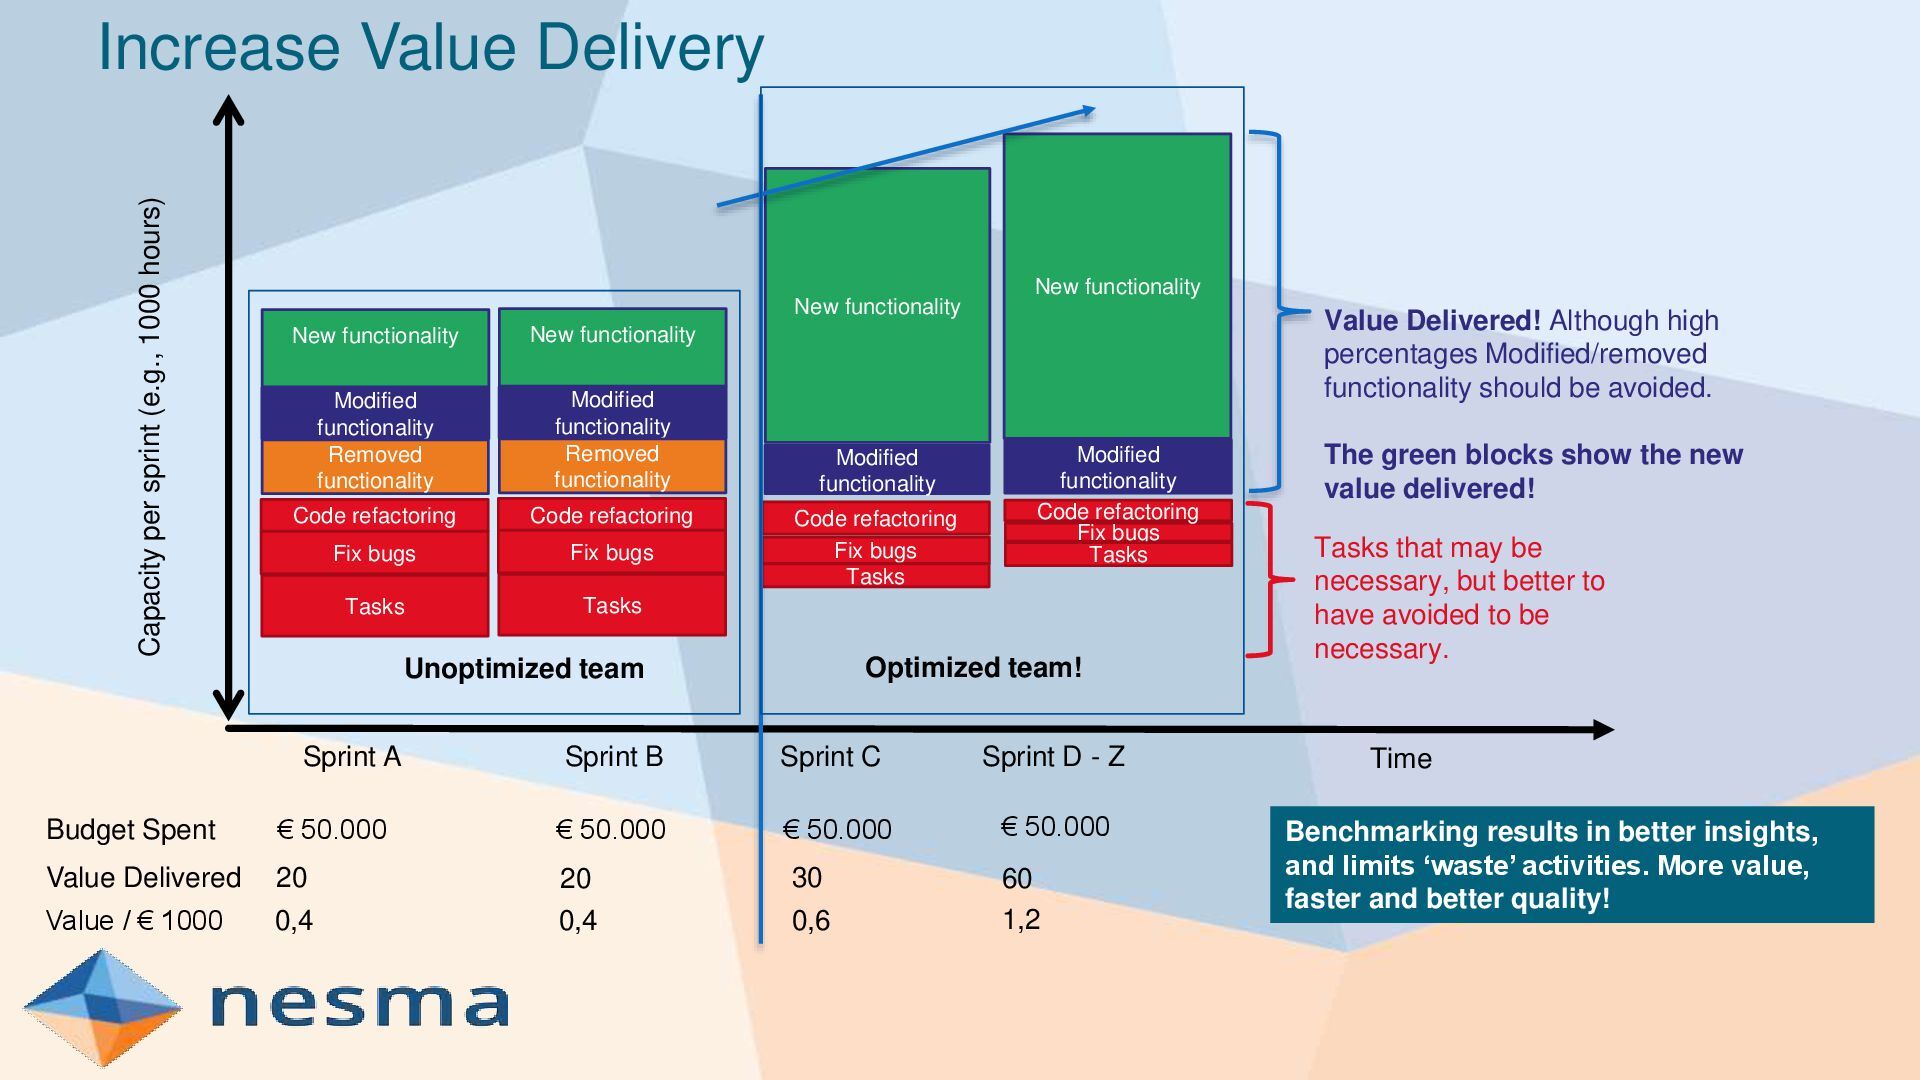
Sprint A Sprint B Sprint C Sprint D - Z Value Delivered! Although high percentages Modified/removed functionality should be avoided. The green blocks show the new value delivered! Tasks that may be necessary, but better to have avoided to be necessary. Fix bugs Code refactoring Tasks Modified functionality New functionality Modified functionality New functionality Benchmarking results in better insights, and limits ‘waste’ activities. More value, faster and better quality! Fix bugs Code refactoring Tasks Modified functionality Code refactoring Tasks New functionality Removed functionality Fix bugs Modified functionality Code refactoring Tasks New functionality Removed functionality Fix bugs Unoptimized team Budget Spent € 50.000 Value Delivered € 50.000 € 50.000 € 50.000 Optimized team! 20 20 30 60 Value / € 1000 0,4 0,4 0,6 1,2
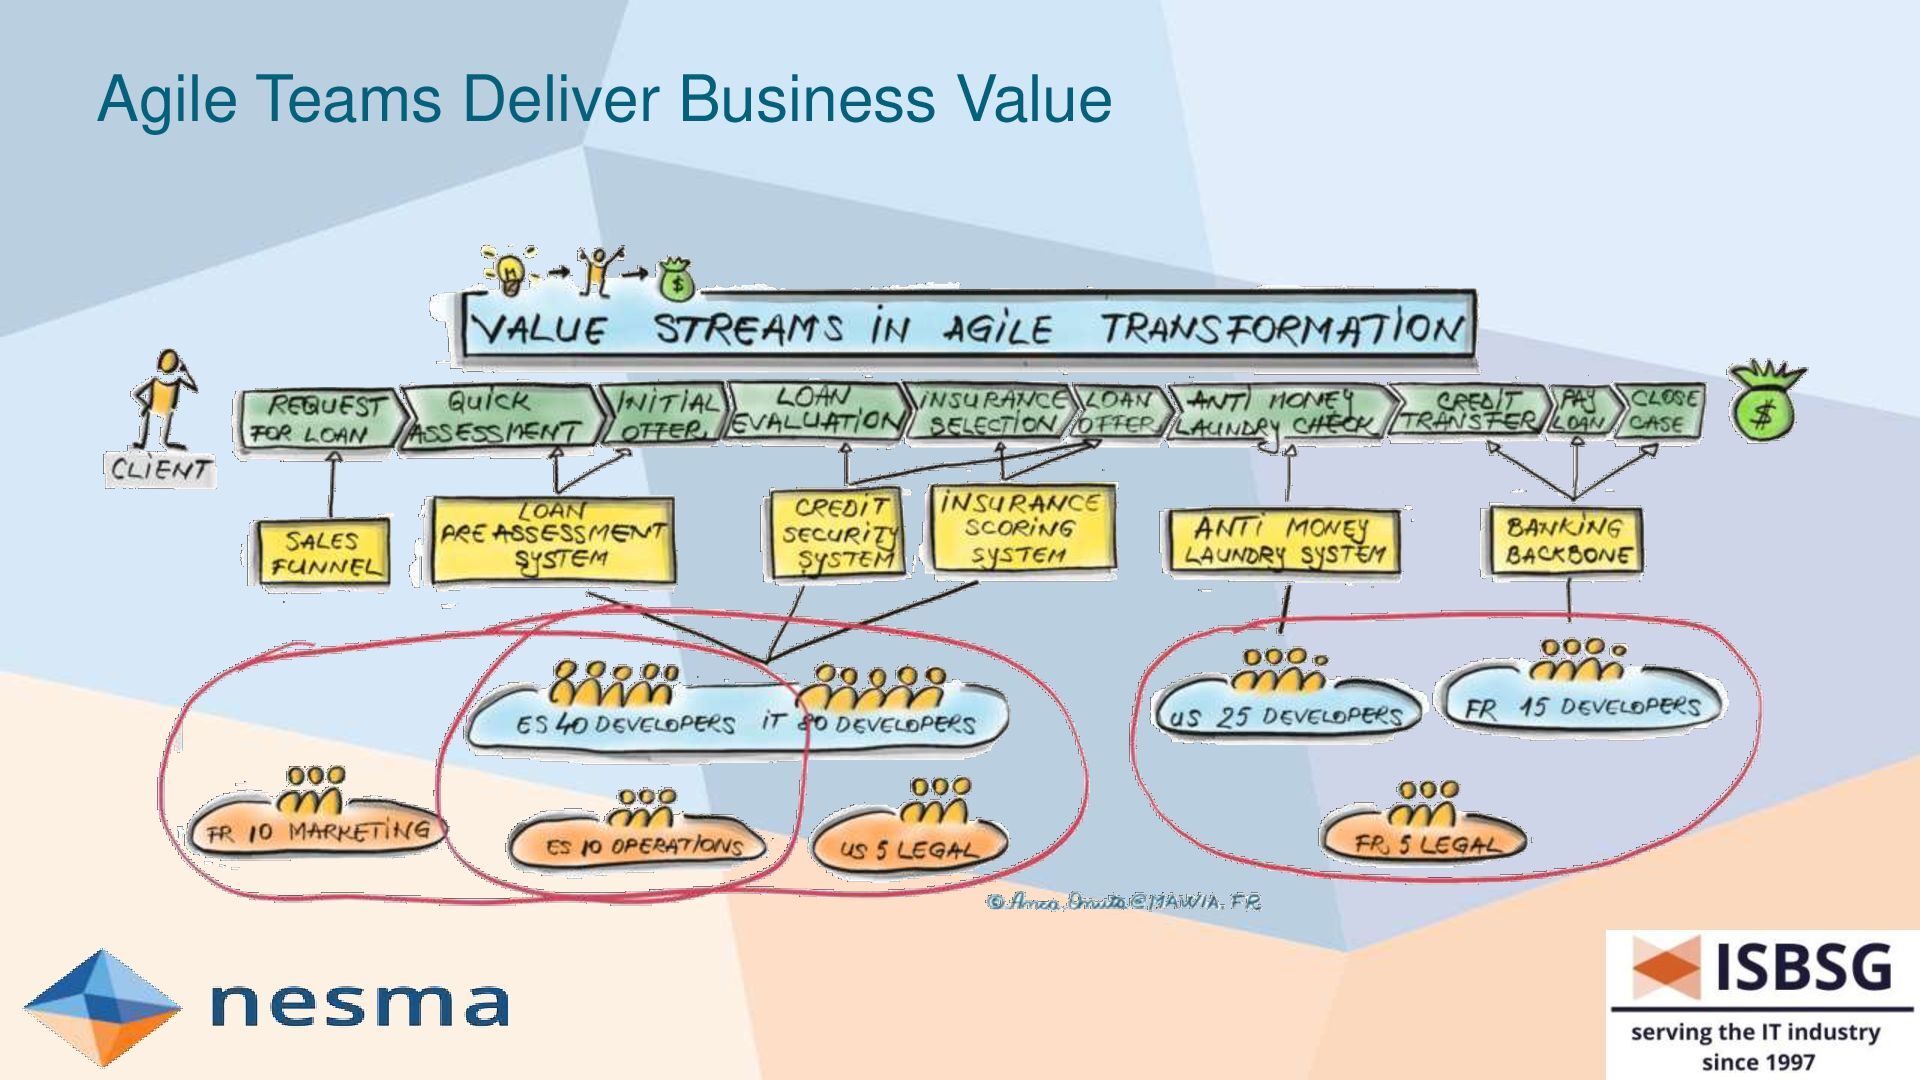
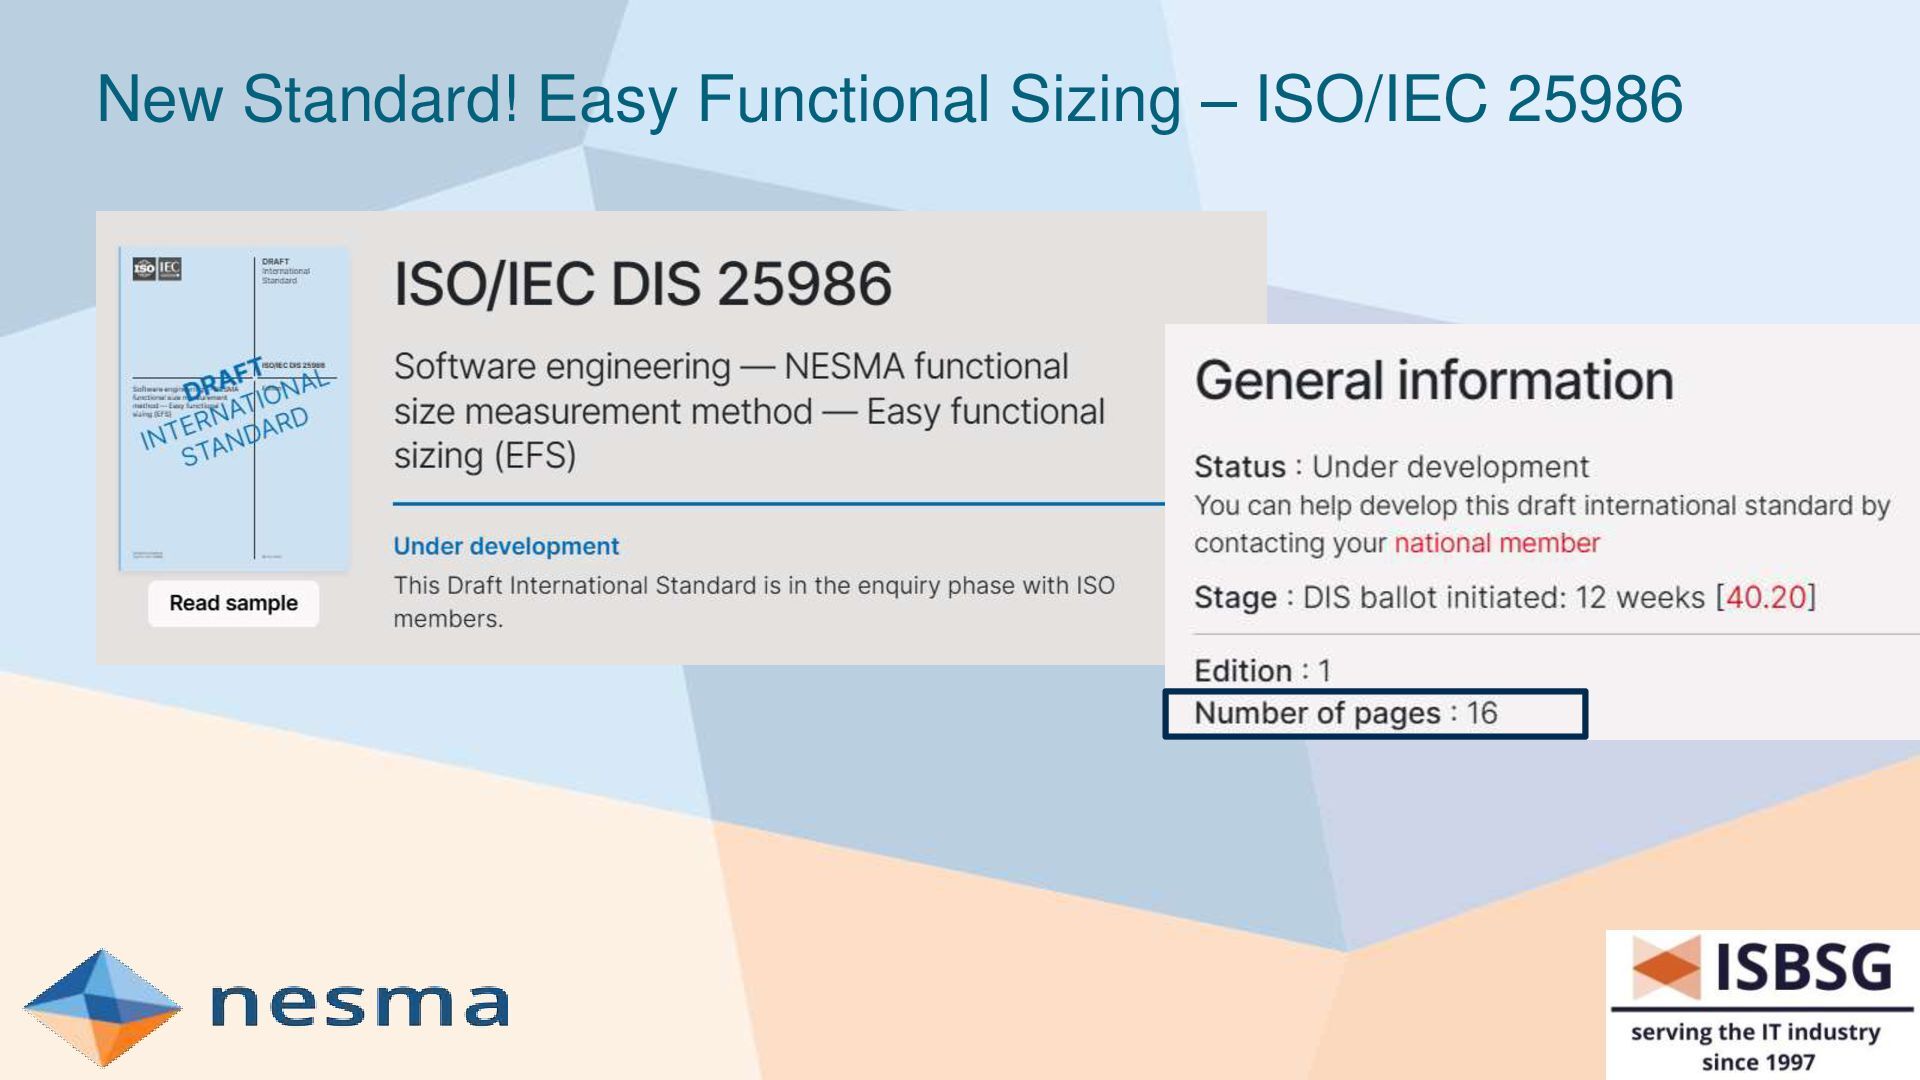
is more focus on delivery of business value. Many organizations contract external agile teams using T&M and ratecard contracts, where vendors are not incentivized. Management perceives a lack of insights and are unable to manage based on management information, as the agile teams don’t measure output in a standardized way. It’s not possible to measure business value, however Functional Size Measurement is an ISO/IEC standard that measures functionality, a good proxy for business value, in an objective, repeatable and standardized way. This allows the use of objective metrics for estimation, benchmarking, team measurement, contracting, etc. ISBSG offers historical data of over 13.100 completed projects, releases and sprints. The data can be used for many purposes, e.g. estimation, benchmarking, contracting, etc. New developments are the Nesma EFS standard and the Dutch (for now) NPR 5333 to measure and contract external agile teams in an output-based way. This way it becomes easier to contract external agile teams and to easily measure and benchmark team performance, allowing to compare teams and understanding low and high performing teams.
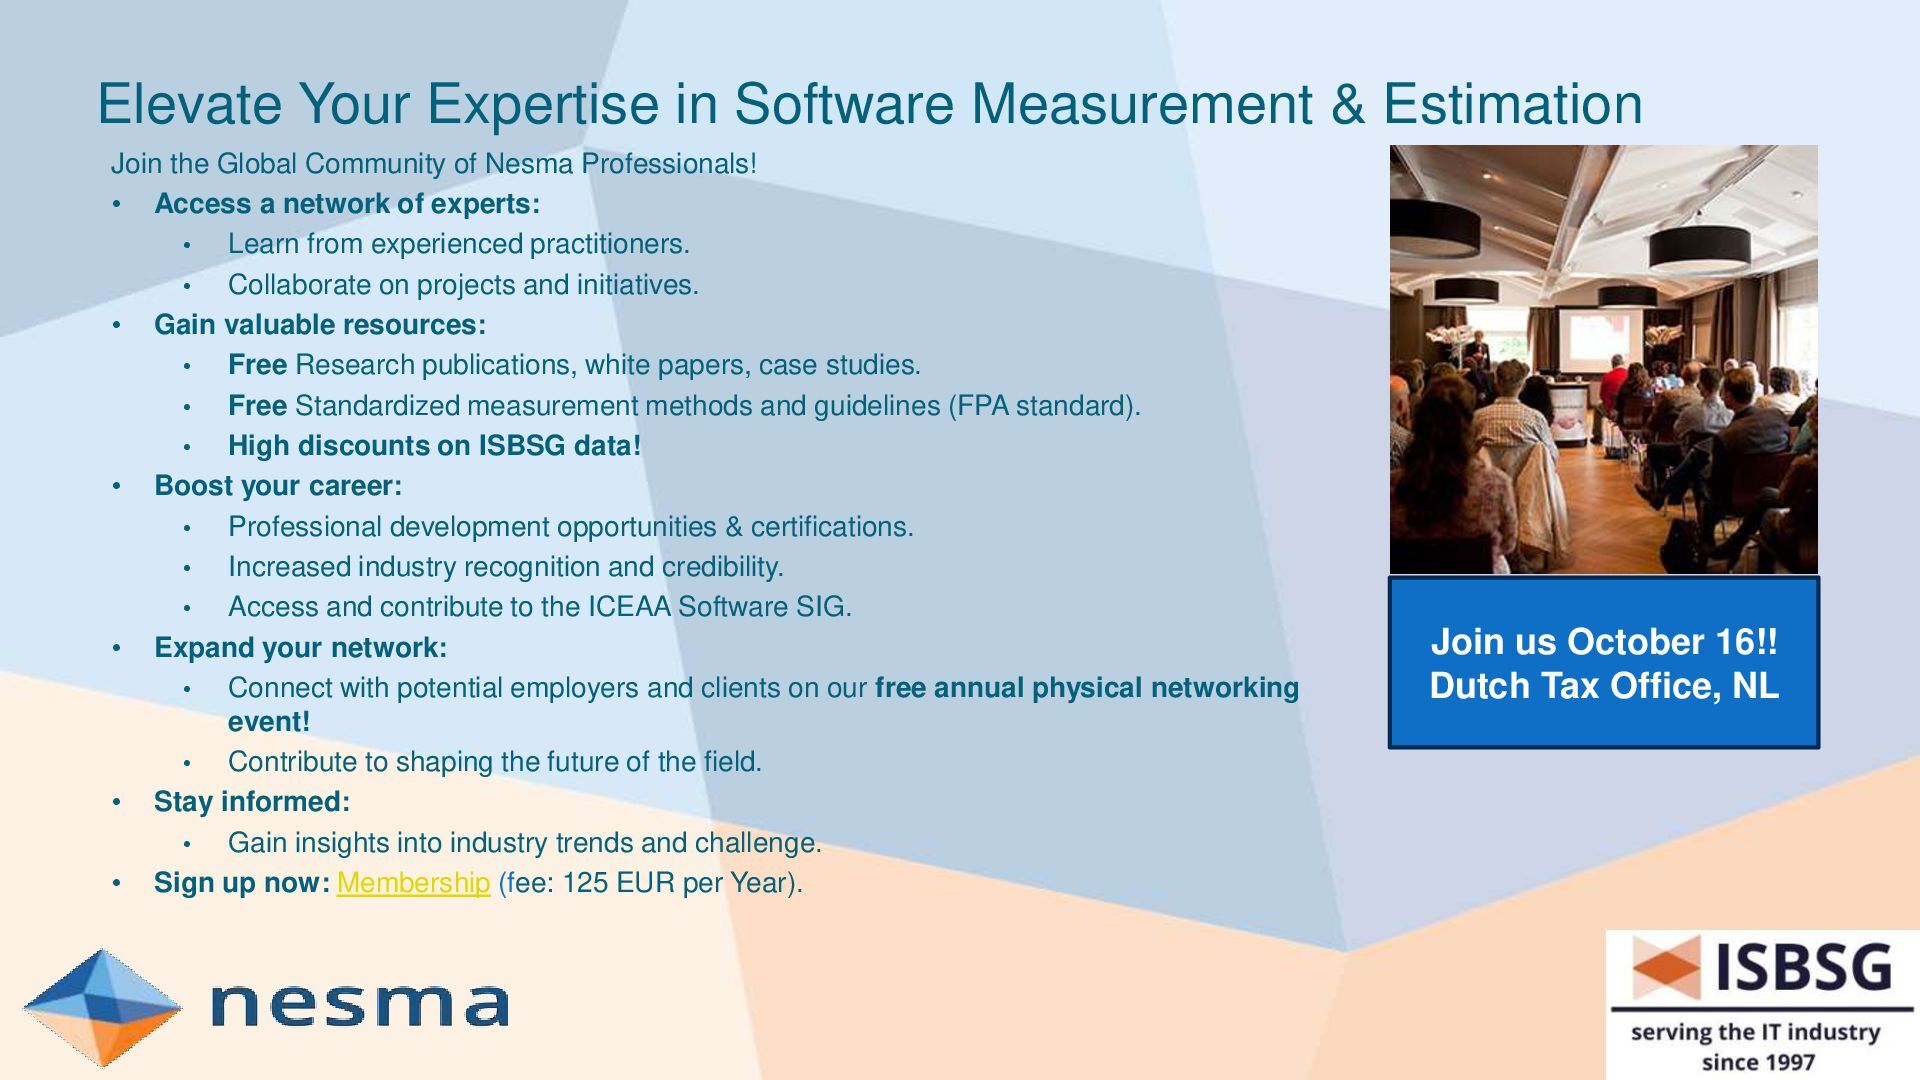
Global Community of Nesma Professionals! • Access a network of experts: • Learn from experienced practitioners. • Collaborate on projects and initiatives. • Gain valuable resources: • Free Research publications, white papers, case studies. • Free Standardized measurement methods and guidelines (FPA standard). • High discounts on ISBSG data! • Boost your career: • Professional development opportunities & certifications. • Increased industry recognition and credibility. • Access and contribute to the ICEAA Software SIG. • Expand your network: • Connect with potential employers and clients on our free annual physical networking event! • Contribute to shaping the future of the field. • Stay informed: • Gain insights into industry trends and challenge. • Sign up now: Membership (fee: 125 EUR per Year). Join us October 16!! Dutch Tax Office, NL
non-profit international software measurement organization, founded in 1989, focused on: Governing the Nesma standard for functional size measurement. Promoting measurement and metrics based on functional size, which is the best proxy for business value. Spreading knowledge about software measurement and software metrics. Act as a Body of Knowledge for the industry regarding the use of software metrics in all business areas. Remain independent, objective, and not-for-profit. Research the applicability of software metrics in all business areas. Connect relevant organizations in the industry that are expert in the areas where software measurement and metrics are important. Produce relevant guidelines, reports and other information products that are useful for the software industry. Produce a platform where experts can discuss issues, they experience with software measurement and metrics or where they can exchange ideas and/or knowledge. Nesma is Gold Partner of International Software Benchmarking Standards Group, partner in the International Cost Estimation and Analysis Association (ICEAA) Software Special Interest Group and partner with the China Software Process Improvement group.
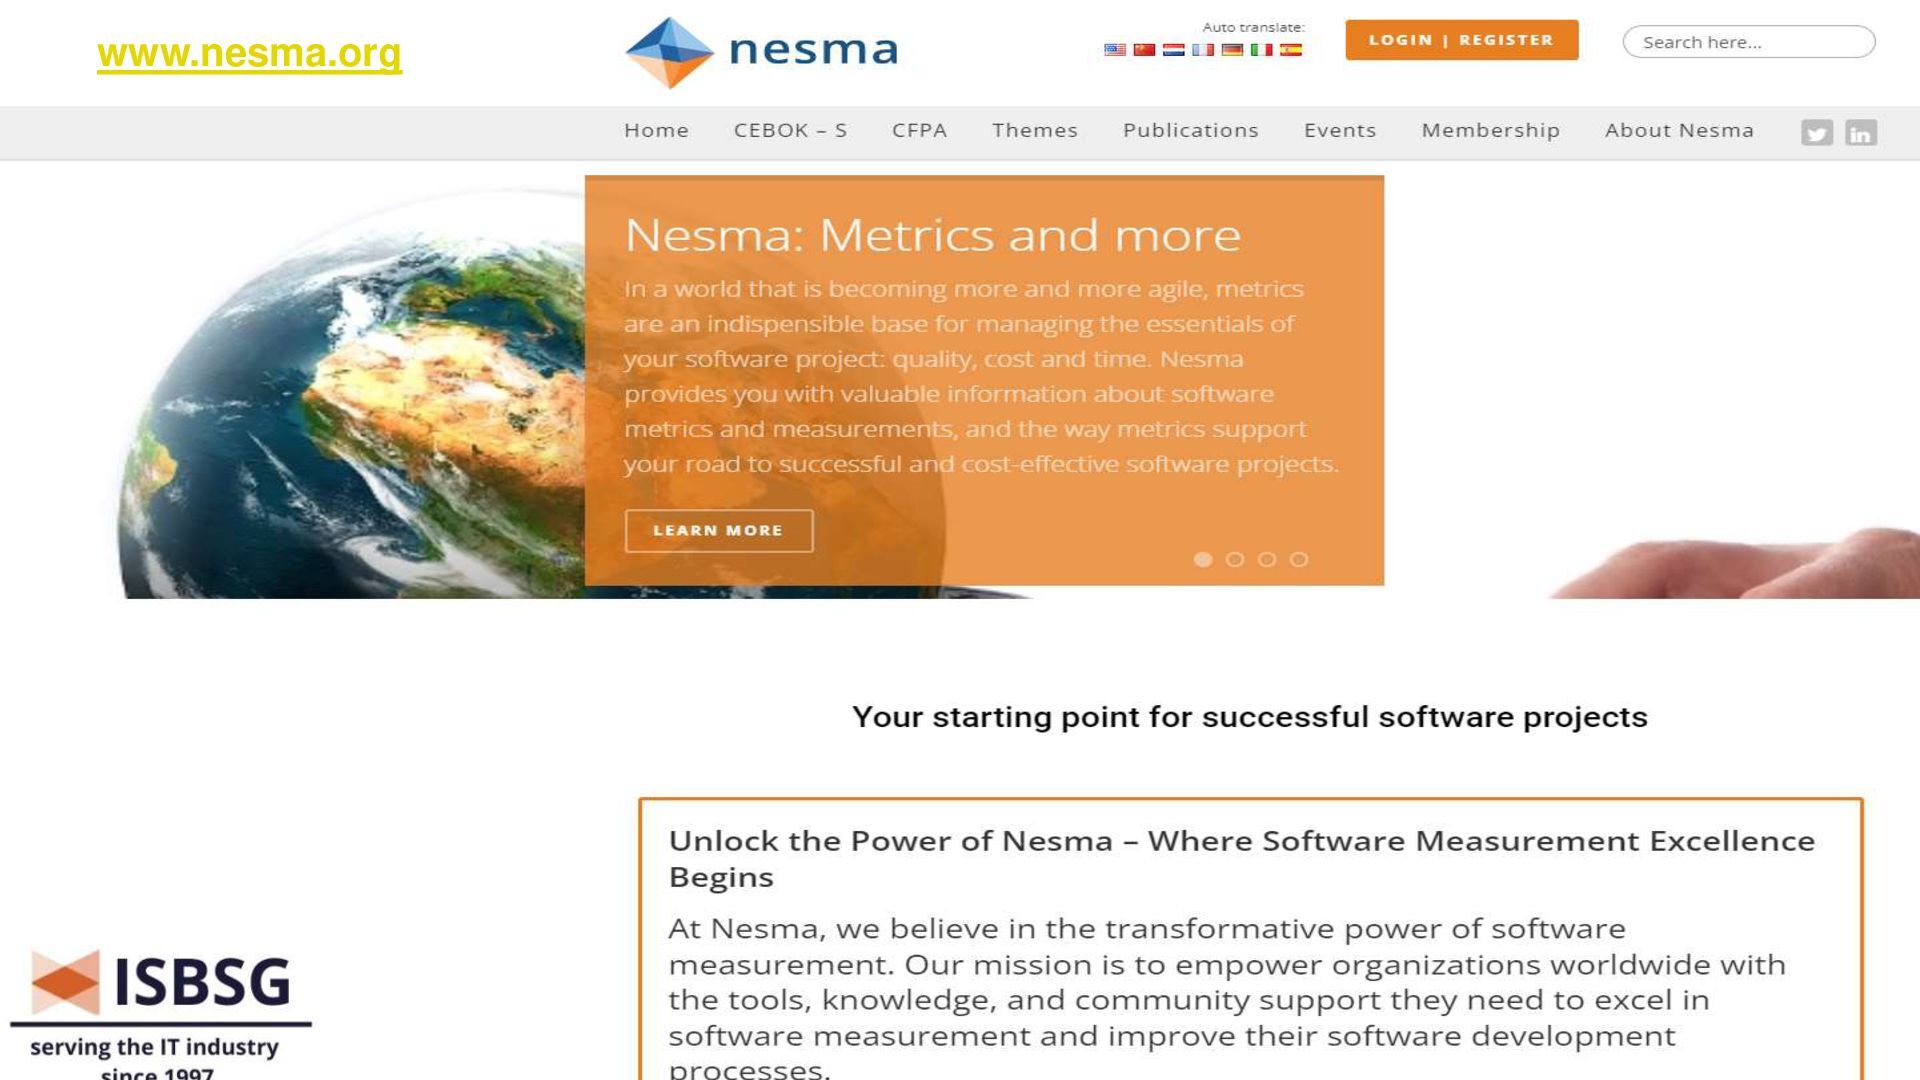
fee is only €125 https://nesma.org/members/register/ Connect with the Nesma community, including free downloads of all digital products + free access to a physical member meeting/network event! large discounts on ISBSG data! Nesma: http:// www.nesma.org [email protected]

 Your Podcast. Everywhere. Effortlessly.


 nesmaoffice
 cbtlibrary
 signer
 frievea
 kekekenta
 pawan_pharm
 2720japanoke
 mariooc
 akiraasano
 juanmartin2026
 bvr7352
 mraible
 nikkihalliwell
 twada
 minecr
 stephaniewalter
 letsgokoyo
 lara
 wayneb77
 rkendrick25
 marcoroth
 malarkey
 jnunemaker