Upgrade to Pro — share decks privately, control downloads, hide ads and more …

Uncovering and Optimizing Feedback Loops Together

Uncovering and Optimizing Feedback Loops Together

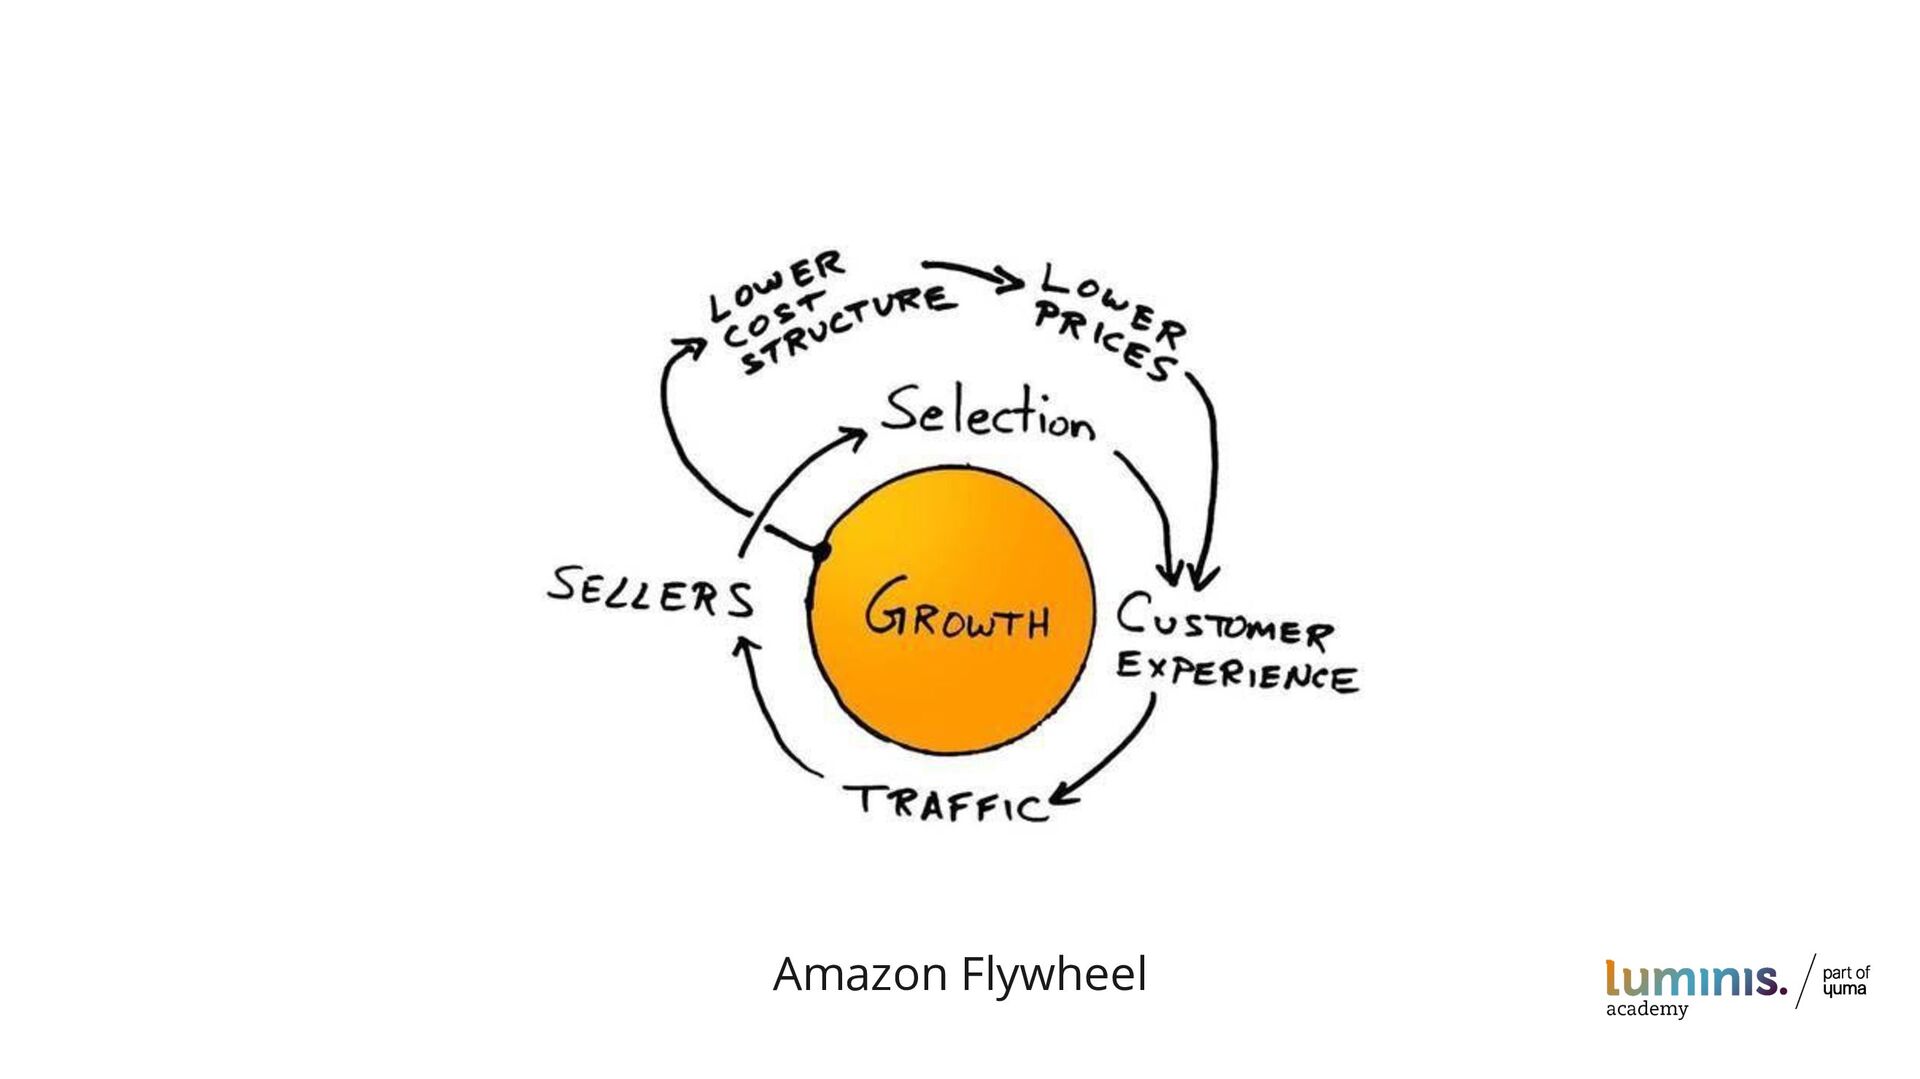
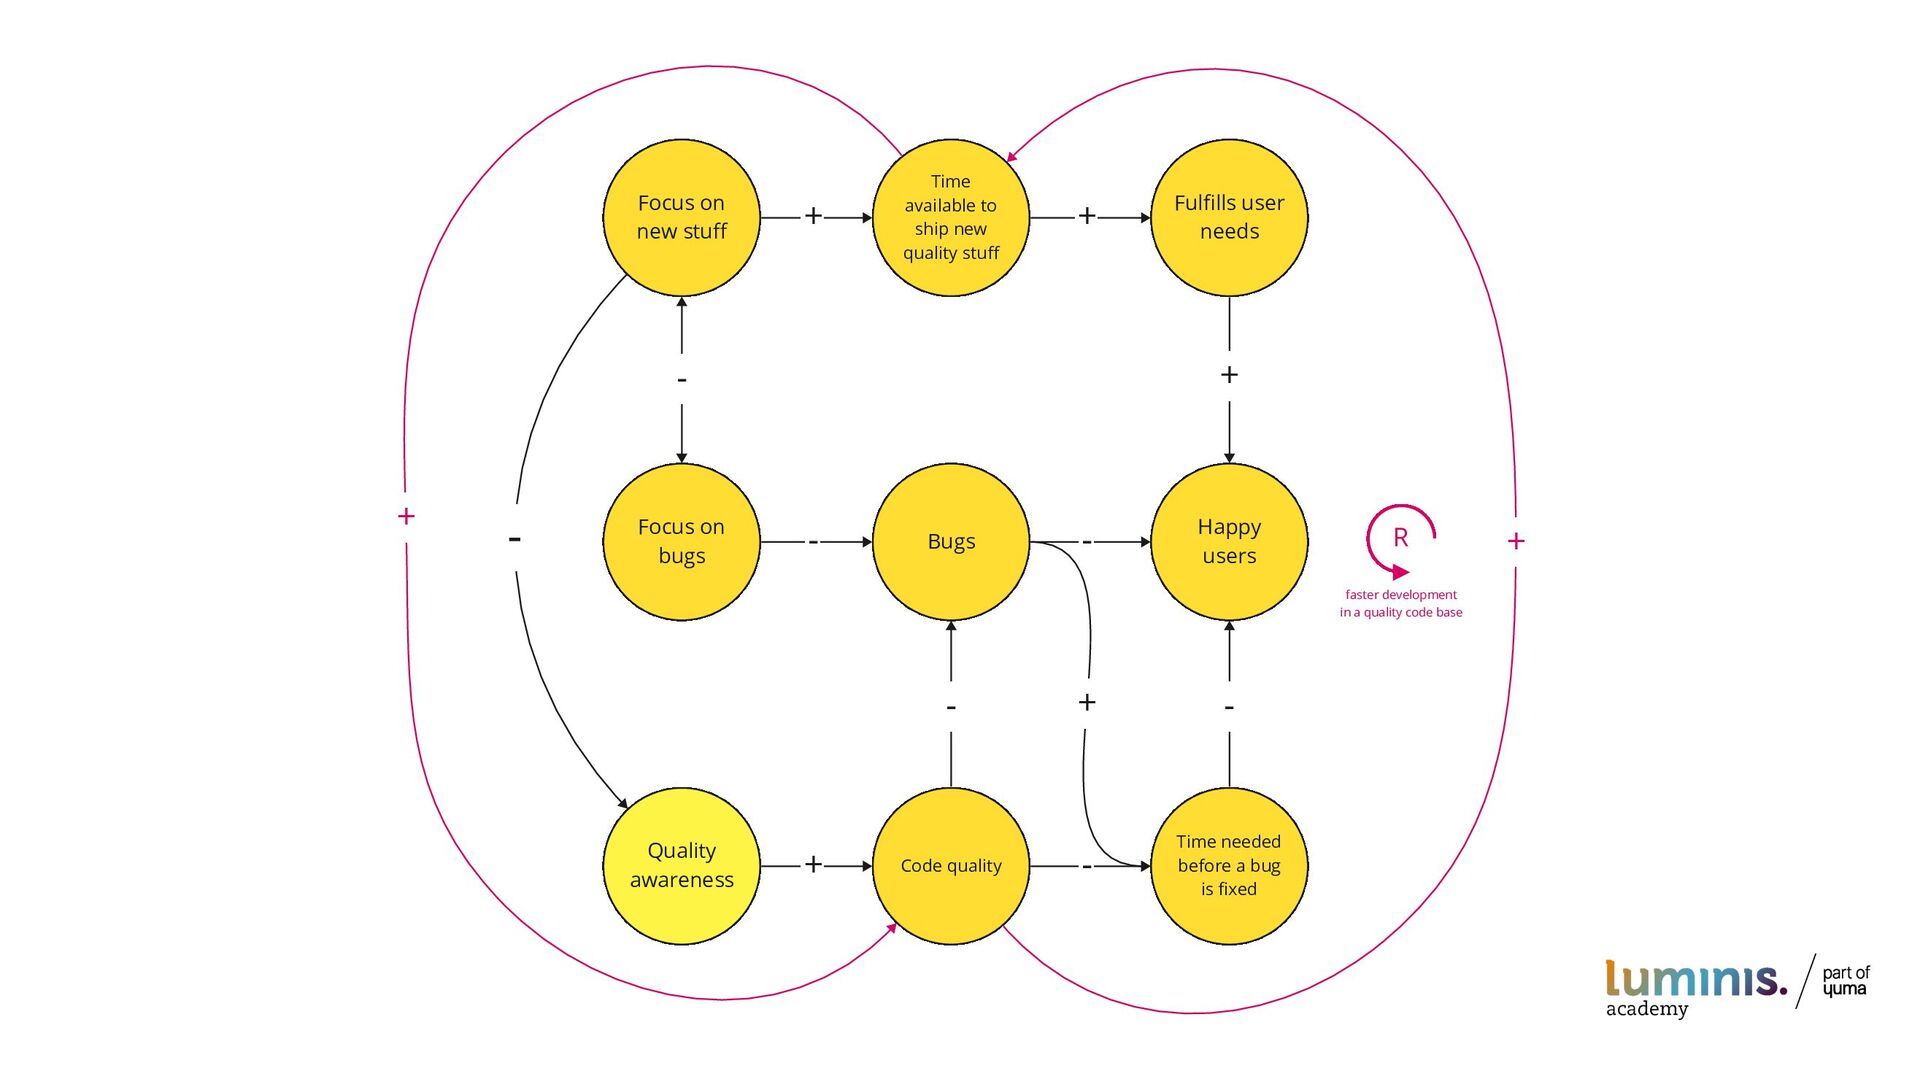
Feedback loops, you know they exist, and you know they are important. Without feedback loops you only have 1 state, but we all know that the whole is always in flux, and you need feedback to deal with that! In today's complex systems, understanding and optimizing feedback loops is crucial for effective decision-making and problem-solving. When it comes to feedback loops there is no perfect way to do it and you can never do enough. But doing nothing is a huge waste. The most import thing is to gather feedback, make it visible and act on it.

Join this session to dive into the theory and practice of identifying, analyzing, and enhancing feedback loops across your technical and social landscape. You will collaborate in small groups to dissect real-world cases, unraveling the feedback mechanisms at play. We will guide you through some theory and provide practical strategies for optimization.

By the end of this workshop, you will be more conscious about possible feedback loops that apply to your context. Next to that, you will gain some tools and heuristics to recognize feedback loops around you and optimize them.

Prerequisites

This workshop is aimed at professionals in the digital space, involved in the development of products or services. No programming experience is required.

Nico Krijnen

June 04, 2024
Tweet

More Decks by Nico Krijnen

Other Decks in Business

Transcript

  1. Guitar Feedback Found Sound: Guitar Feedback Noise | ASMR YouTube

    ncase.me LOOPY! a tool for thinking in systems
  2. Costs Variable or Factor in the system: can become more

    and less. a b Causal relation with a positive polarity: when a increases, b also increases, when a decreases, b also decreases. Causal relation with a negative polarity: when a increases, b decreases, when a decreases, b increases. Causal relation with a delay: when a increases, b also increases, but only after a while. a b a b || + - + Births Population Deaths || || + + + - R B R Reinforcing loop: a closed loop of causal relations that makes its variables keep increasing or decreasing. No or even number of negative relations. CO2 in atmosphere Permafrost Global warming - + - B Balancing loop: a closed loop of causal relations that makes its variables keep stable. Odd number of negative relations. Demand Desirability Price - + +
  3. Desirability Growth (customers) Consumer price Step 1: Can you draw

    cause and effect? Do you see a loop? If so, what kind of loop?
  4. Costs per customer + Step 2: How does this growth

    affect the costs? Add this variable; draw cause and effect; find loops.
  5. B R2 R1 description description description Step 3: How would

    you describe the feedback loops? Clarify where the loops are: color lines for each loop.
  6. Investment Profit + Step 4: How does this growth relate

    to the business? Add these; draw cause and effect; find loops.
  7. ... ... Revenue + Step 5: What else is happening?

    Expand the system; draw cause and effect; find loops.
  8. Language: agree on terminology and meaning. Objective: agree on what

    the system should help to achieve. Assumptions: agree on what assumptions you make in defining relations. Layout: rearrange the model when it grows to keep it readable. Consumer price Desirability - + Costs per customer Profit + - + + R3 Total costs + + + - - + R1 B R2 growth enables price reduction that causes more growth growth enables cost reduction that causes more growth growth requires more resources that limits growth Economy of scale Growth (customers) Investment Revenue growth enables reinvesting profits that causes more growth
  9. Instructions With your group, come up with possible interventions to

    weaken, break or balance the reinforcing loop that leads to more bugs. Adapt your drawing. Create multiple if you came up with more than one intervention. Happy users Bugs Time needed before a bug is fixed - - Time available to ship new quality stuff Fulfills user needs + + + Code quality + - + - R faster development in a quality code base - R fixing bugs takes time which causes buggy features +
  10. Happy users Bugs Time needed before a bug is fixed

    - - Time available to ship new quality stuff Fulfills user needs + + + Code quality + - + Focus on bugs - Focus on new stuff - + - Quality awareness + - R faster development in a quality code base
  11. Happy users Bugs Time needed before a bug is fixed

    - - Time available to ship new quality stuff Fulfills user needs + + + Code quality + - + Focus on bugs - Focus on new stuff - + - Quality awareness + - + R faster development in a quality code base
  12. Why and when whould you create a diagram like this?

    When you draw this, the causal relations you draw are ASSUMPTIONS! Language can be tricky Language can be manipulative Holistic view on reality: in the diagram you look at how one thing influences another. In the real world the system is much bigger and many more factors will be in play and will cause effects. Happy users Bugs Time needed before a bug is fixed - - Time available to ship new quality stuff Fulfills user needs + + + Code quality + - + Focus on bugs - Focus on new stuff - + - Quality awareness + - + R faster development in a quality code base
  13. Valuable conversational tool for complex systems If you need more

    proof... you know where to focus your experiments and measurements to validate these causal relations. If you don't find any loops; that is perfectly fine. Sometimes it's just causal relations and it helps to be aware of them.