collaboration of seven universities and over 50 partners from infrastructure policy and practice. • ITRC is helping governments, utility providers, designers, investors and insurers by developing new ways to evaluate the performance and impact of long-term plans and policy for infrastructure service provision in an uncertain future. • Supported by an EPSRC Programme Grant.
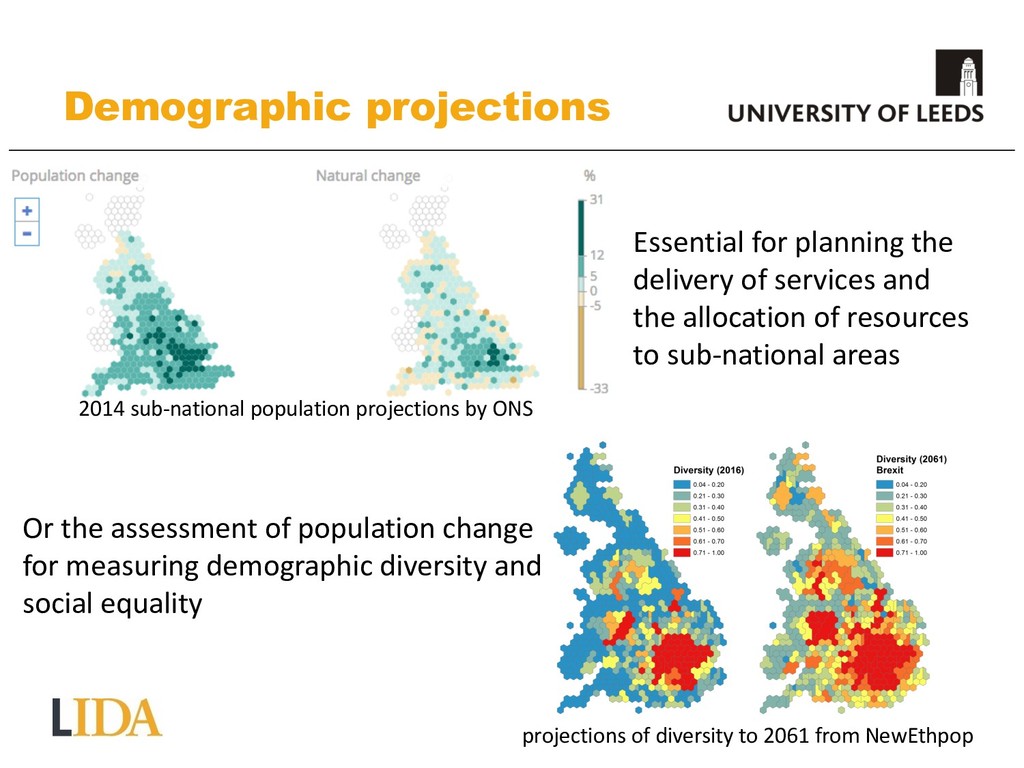
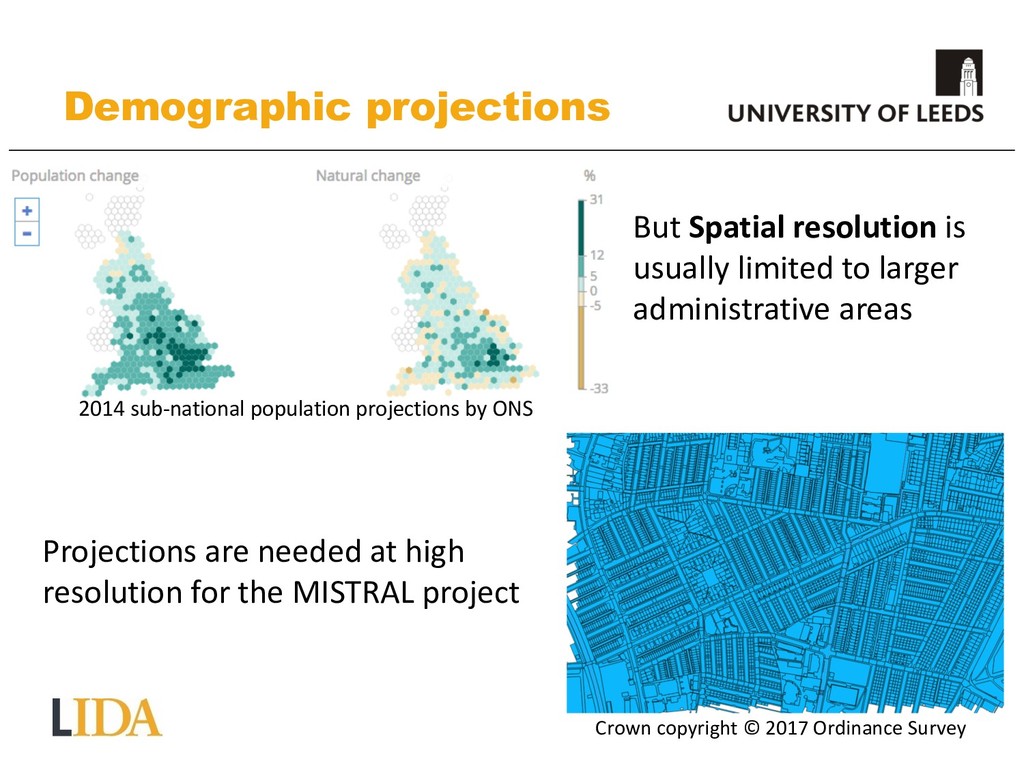
of resources to sub-national areas 2014 sub-national population projections by ONS projections of diversity to 2061 from NewEthpop Or the assessment of population change for measuring demographic diversity and social equality Demographic projections
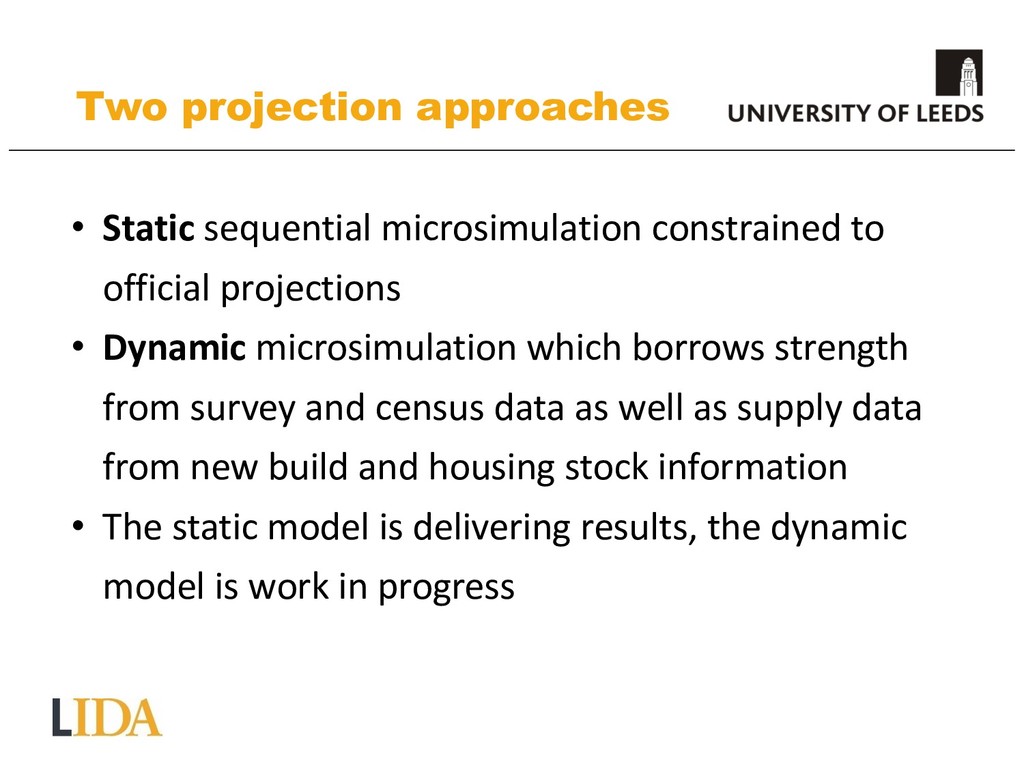
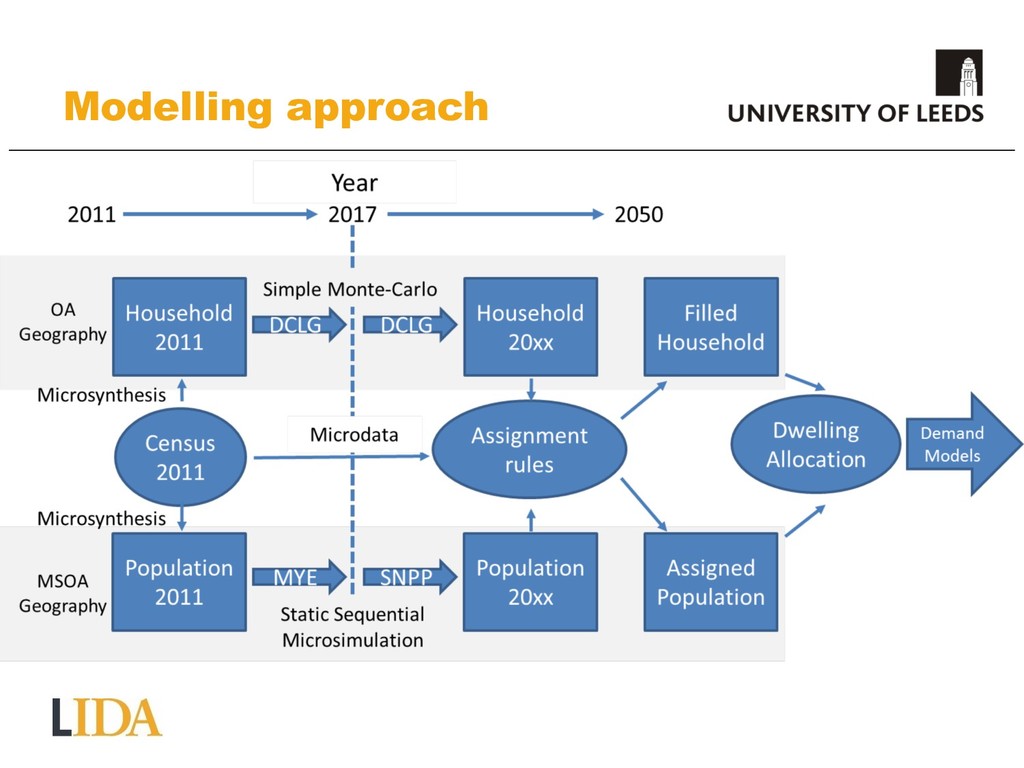
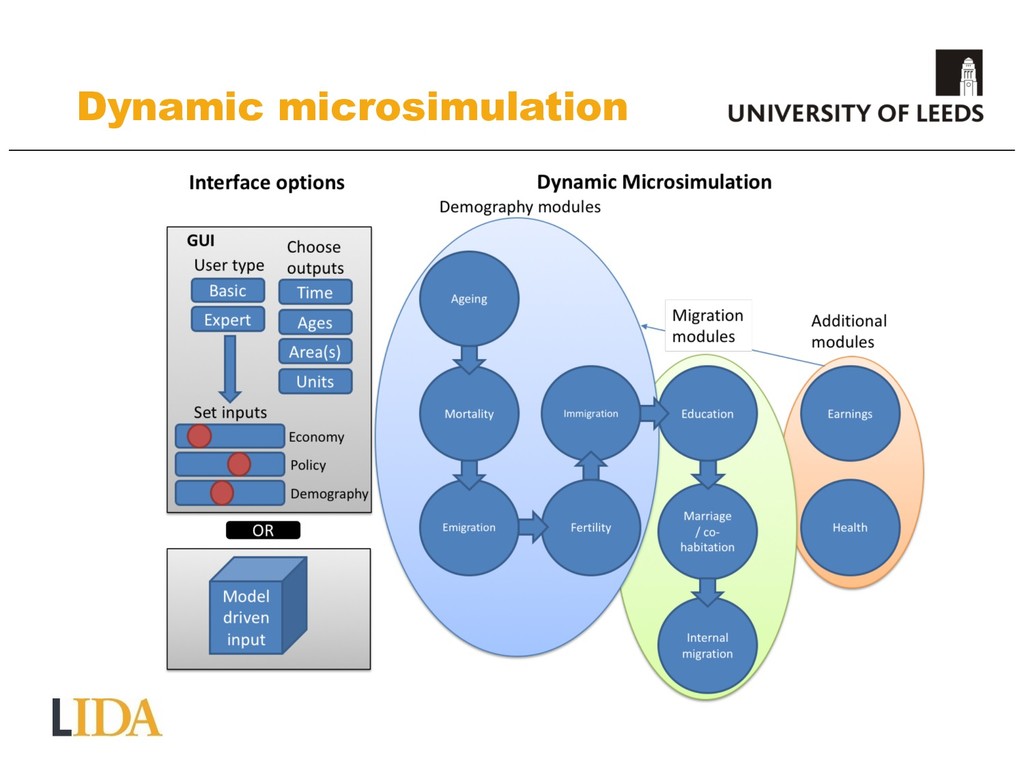
projections • Dynamic microsimulation which borrows strength from survey and census data as well as supply data from new build and housing stock information • The static model is delivering results, the dynamic model is work in progress
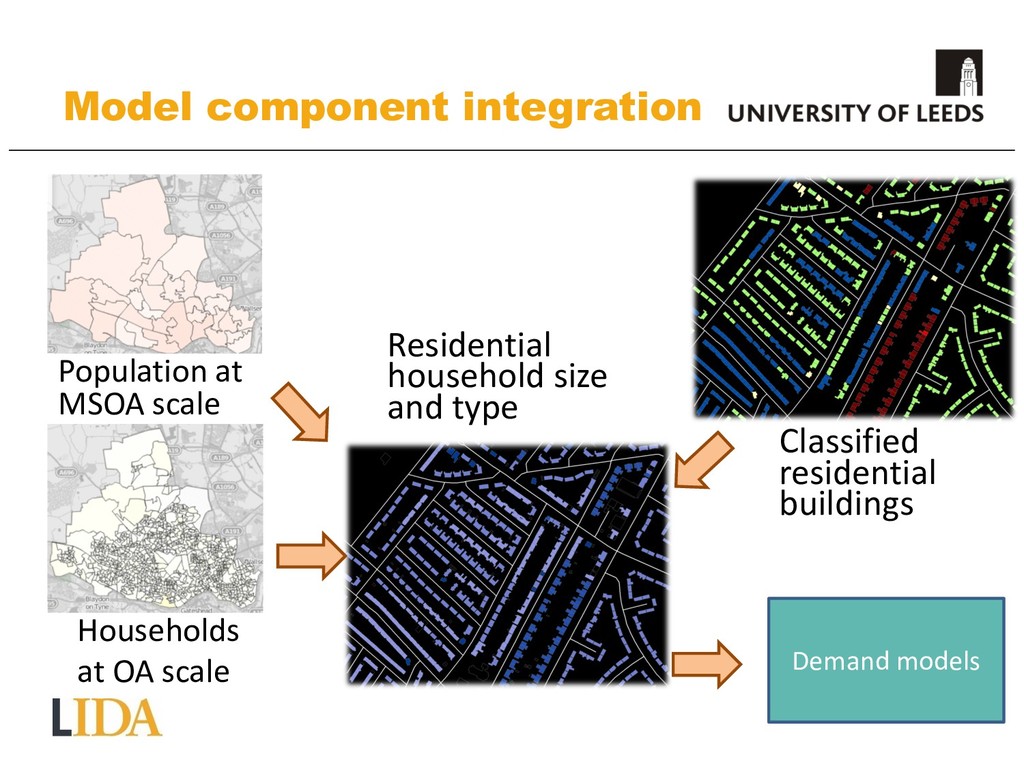
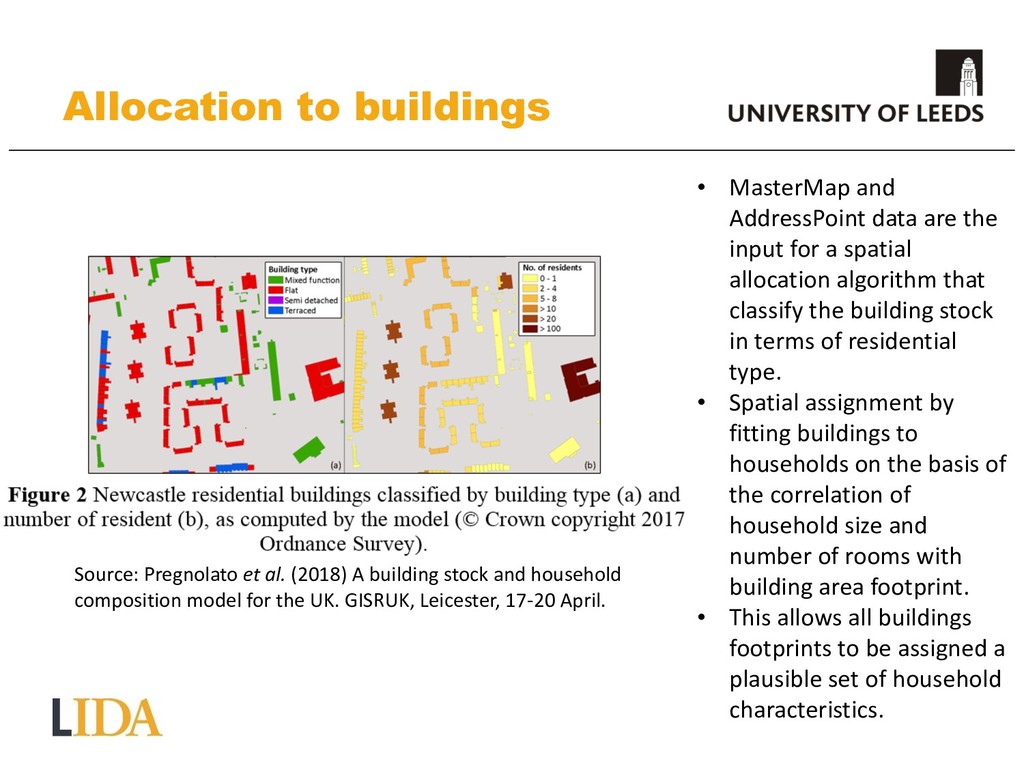
composition model for the UK. GISRUK, Leicester, 17-20 April. Allocation to buildings • MasterMap and AddressPoint data are the input for a spatial allocation algorithm that classify the building stock in terms of residential type. • Spatial assignment by fitting buildings to households on the basis of the correlation of household size and number of rooms with building area footprint. • This allows all buildings footprints to be assigned a plausible set of household characteristics.
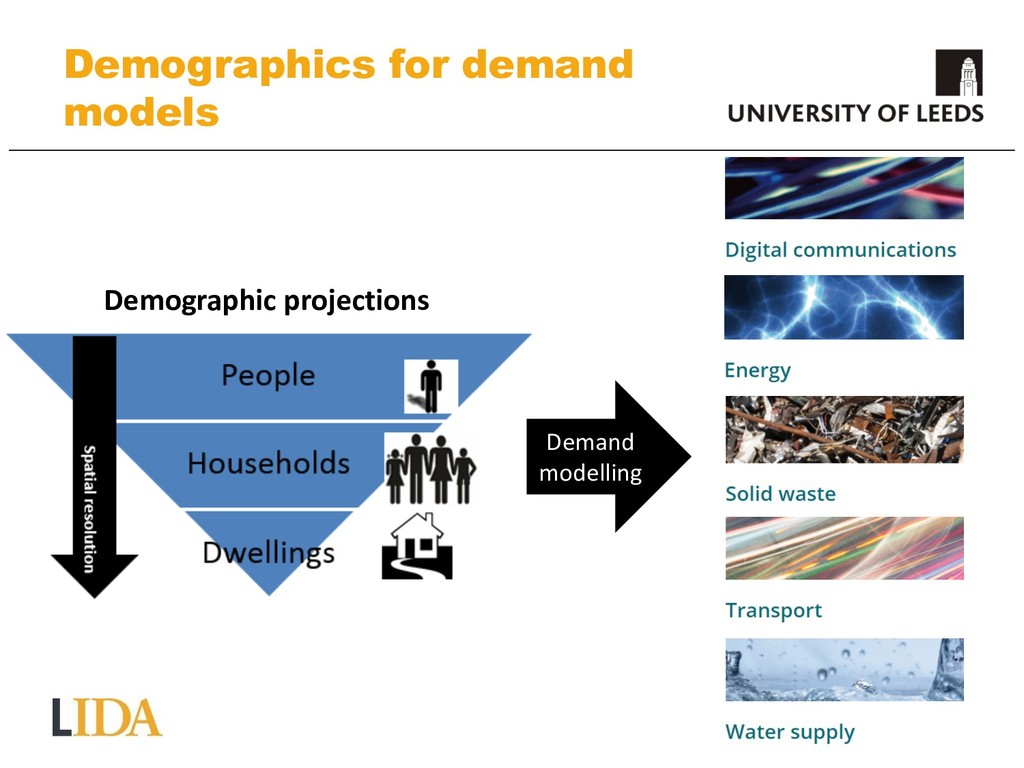
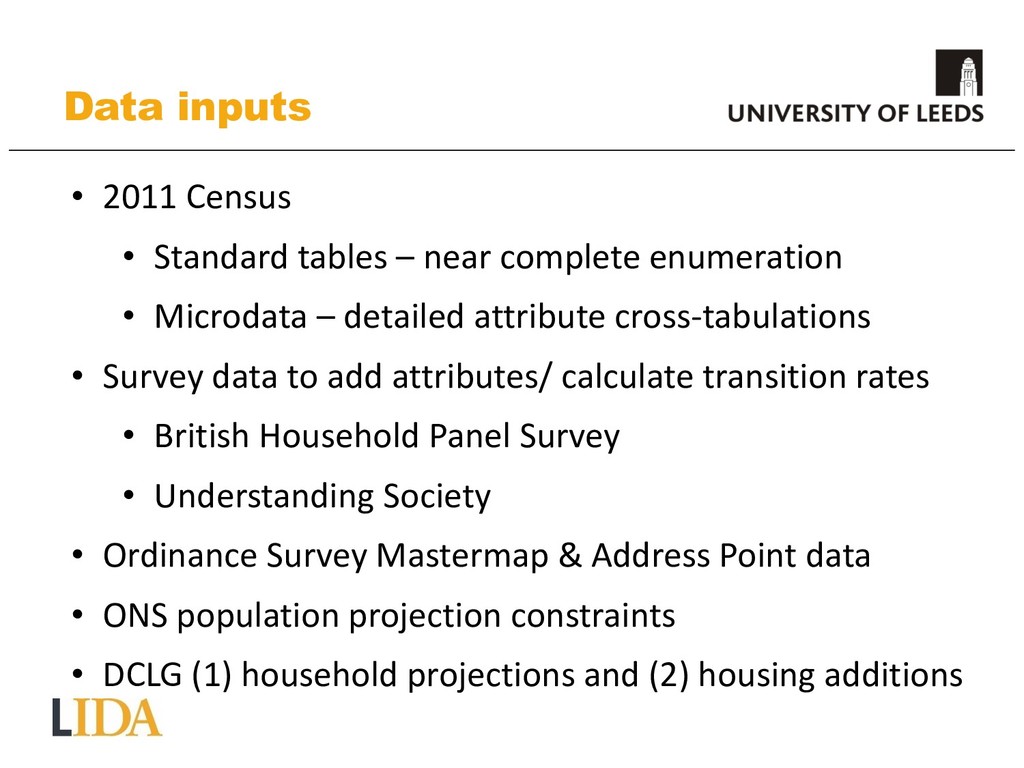
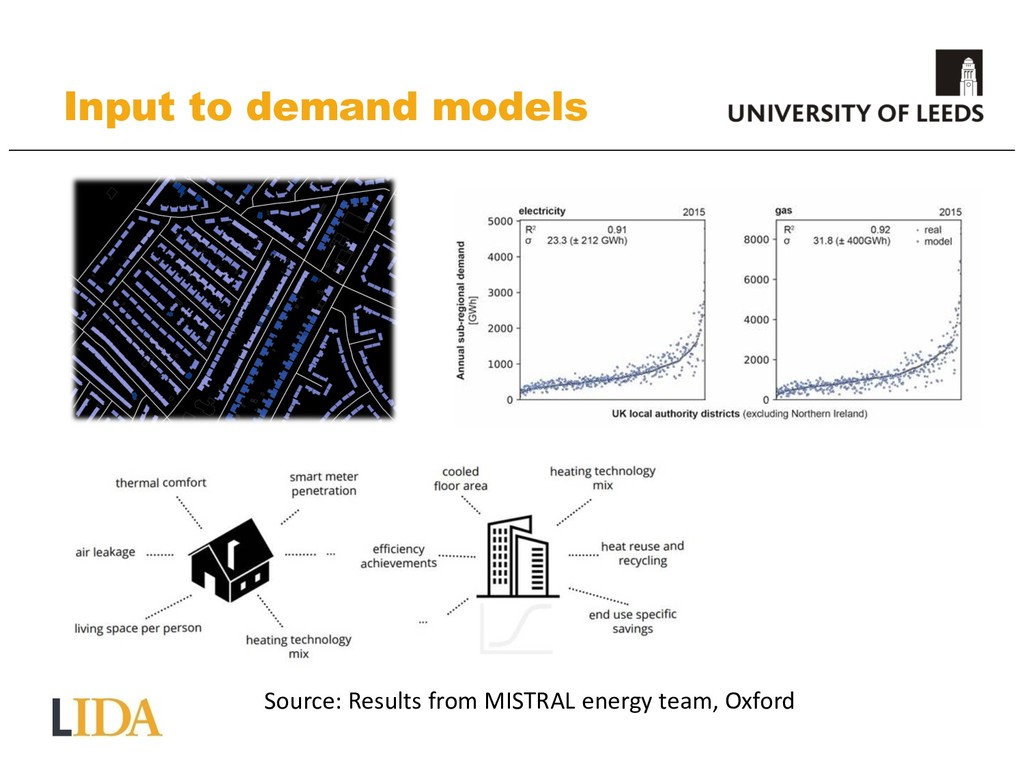
needed for effective modelling of demand across a range of sectors • Most projection models operate at aggregate scales • Microsimulation offers a useful tool to undertake modelling at fine spatial scale • And the potential to incorporate a range of variables
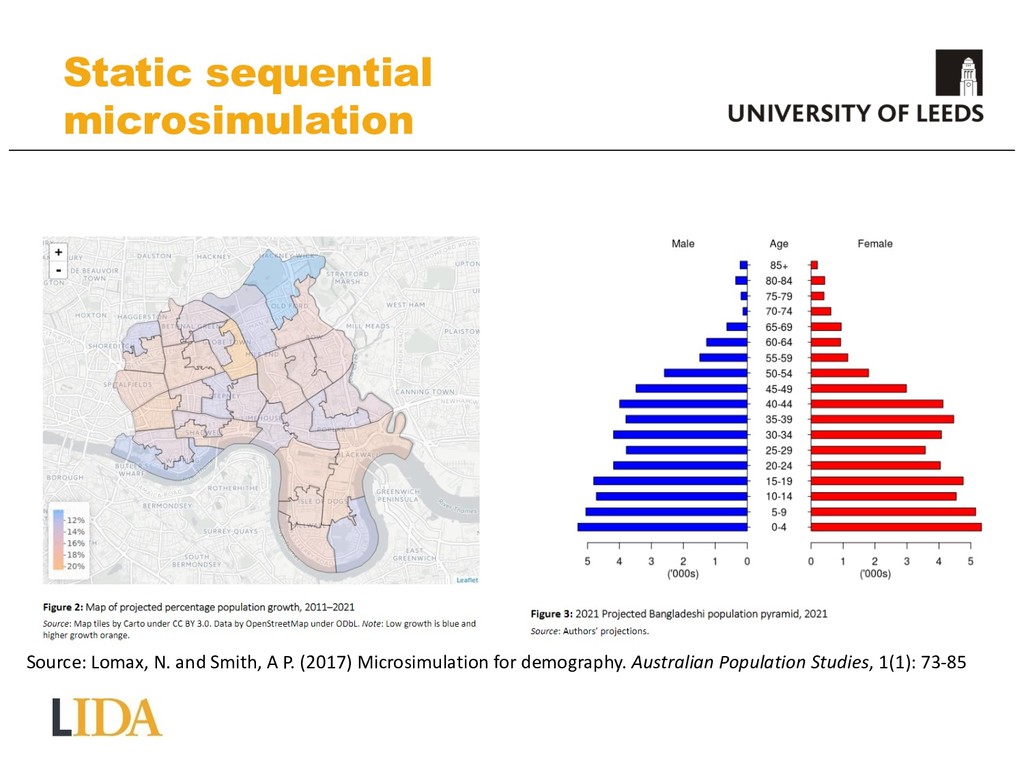
• Static sequential is easier to implement but misses much of the dynamic processes which go on as population changes • The fully dynamic model is potentially the best performing but very hard to implement. This is currently work in progress.