$30 off During Our Annual Pro Sale. View Details »

Examining scenarios of ethnic composition in the United Kingdom

Nik Lomax
August 06, 2018

Examining scenarios of ethnic composition in the United Kingdom

I gave this presentation at the International Geographical Union meeting in Quebec

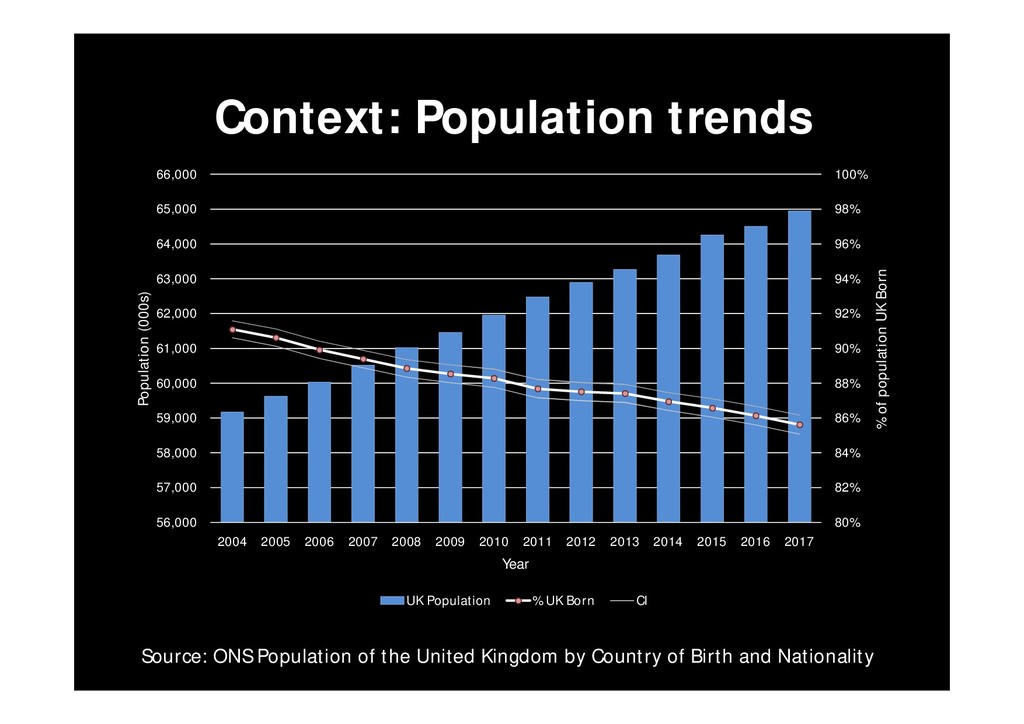
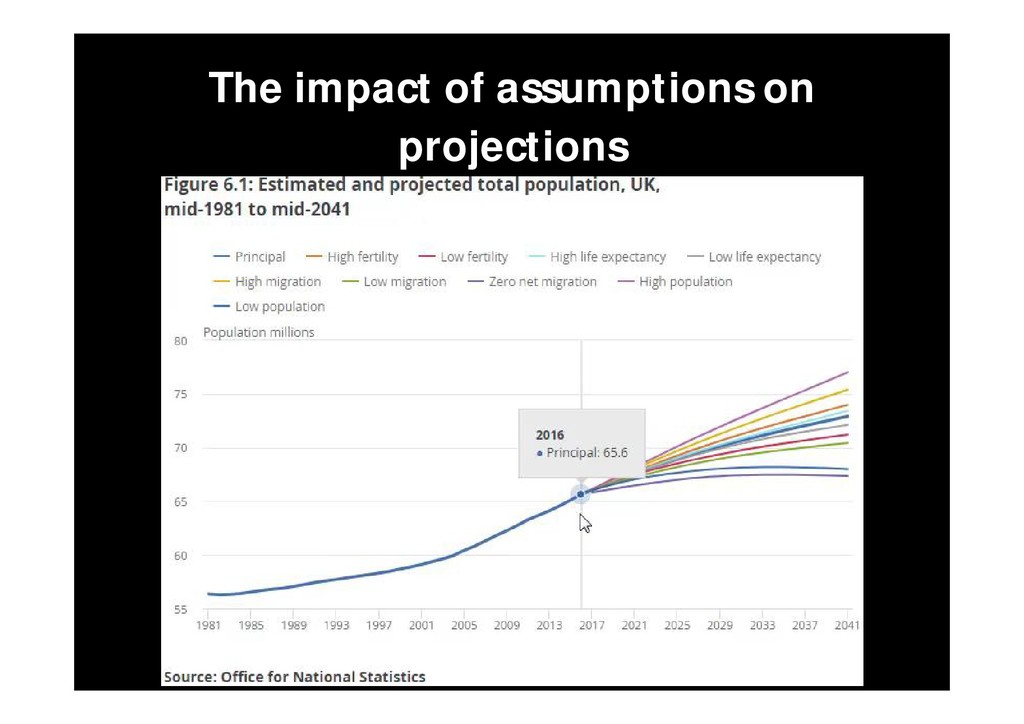
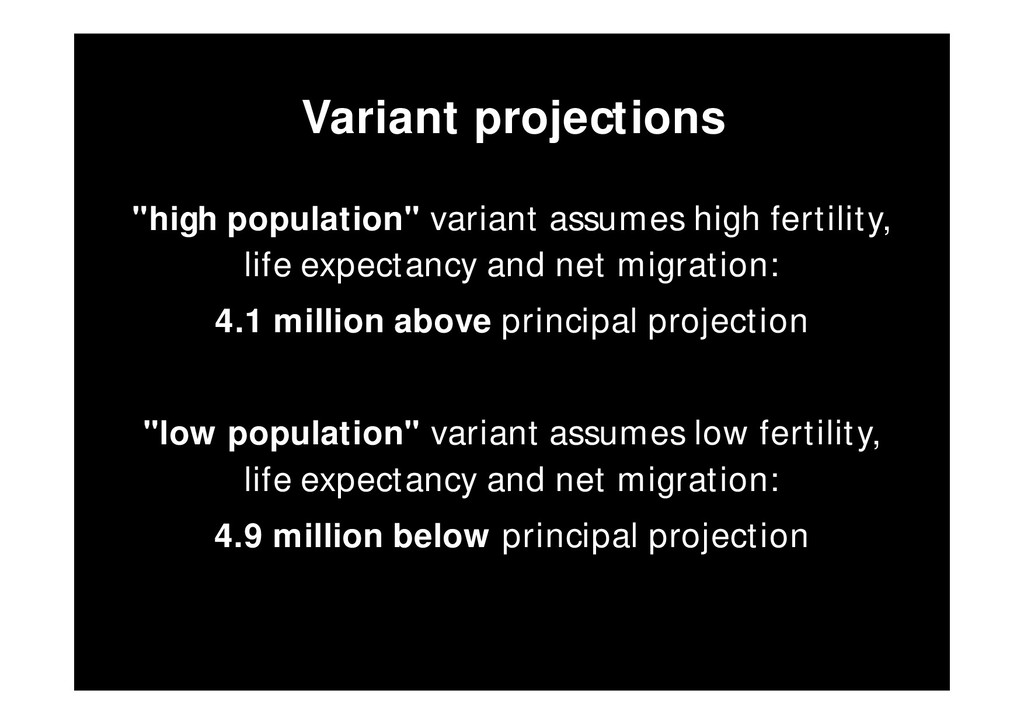
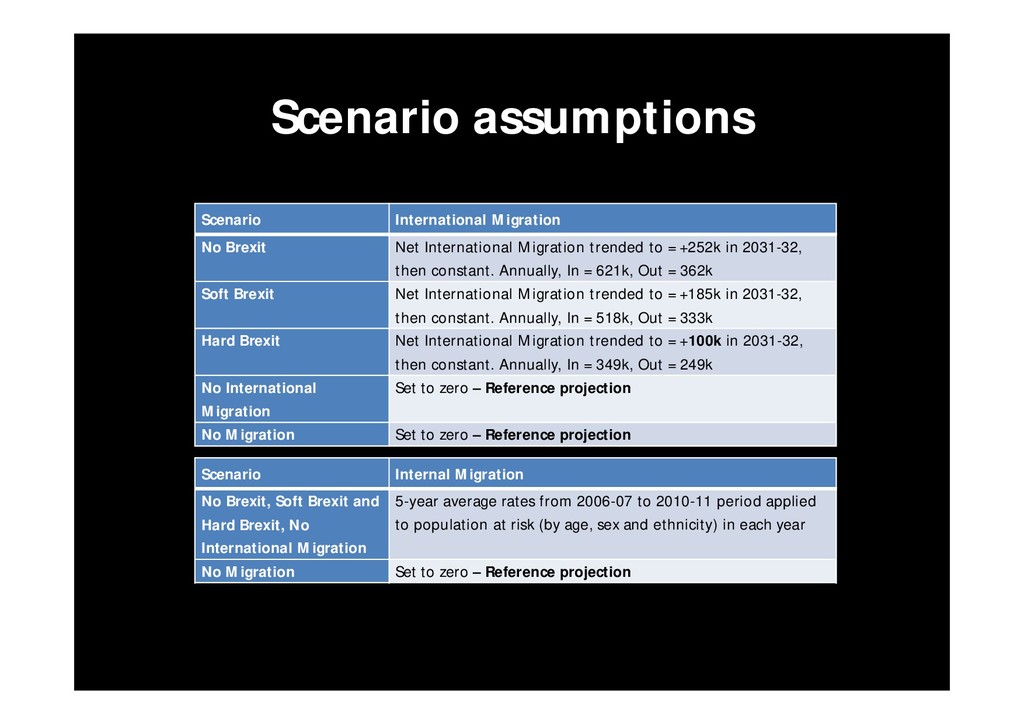
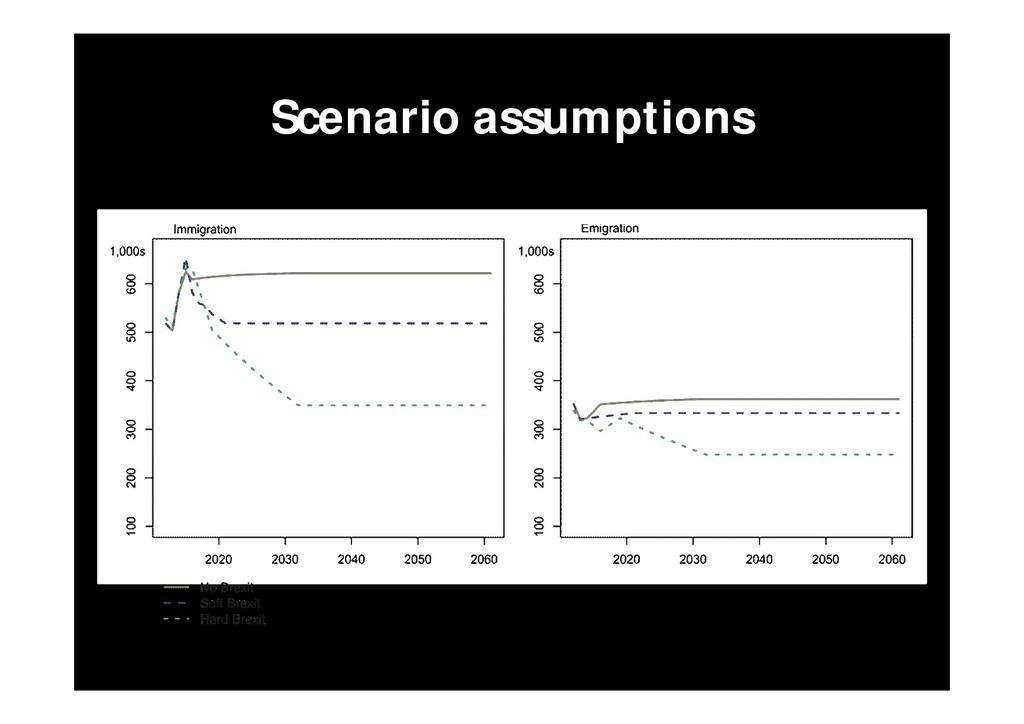
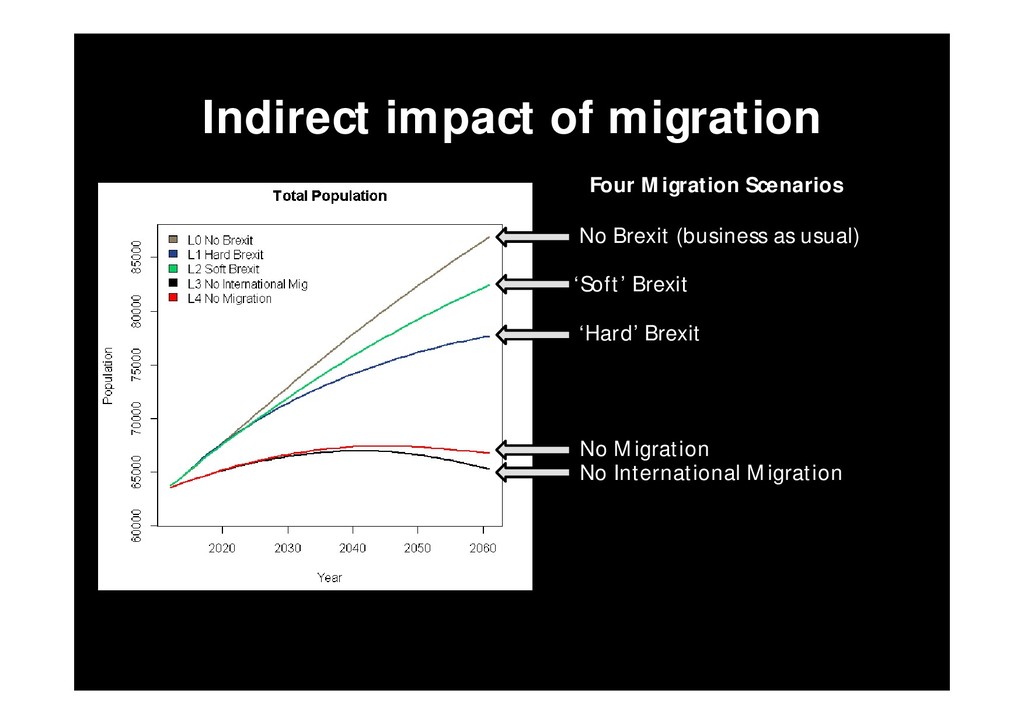
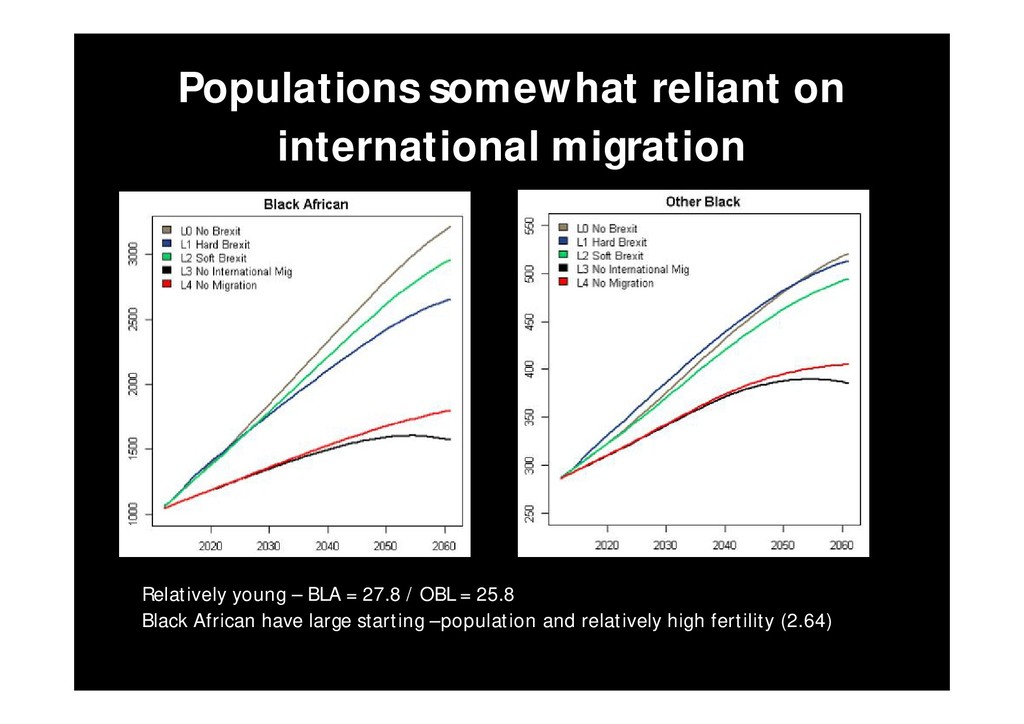
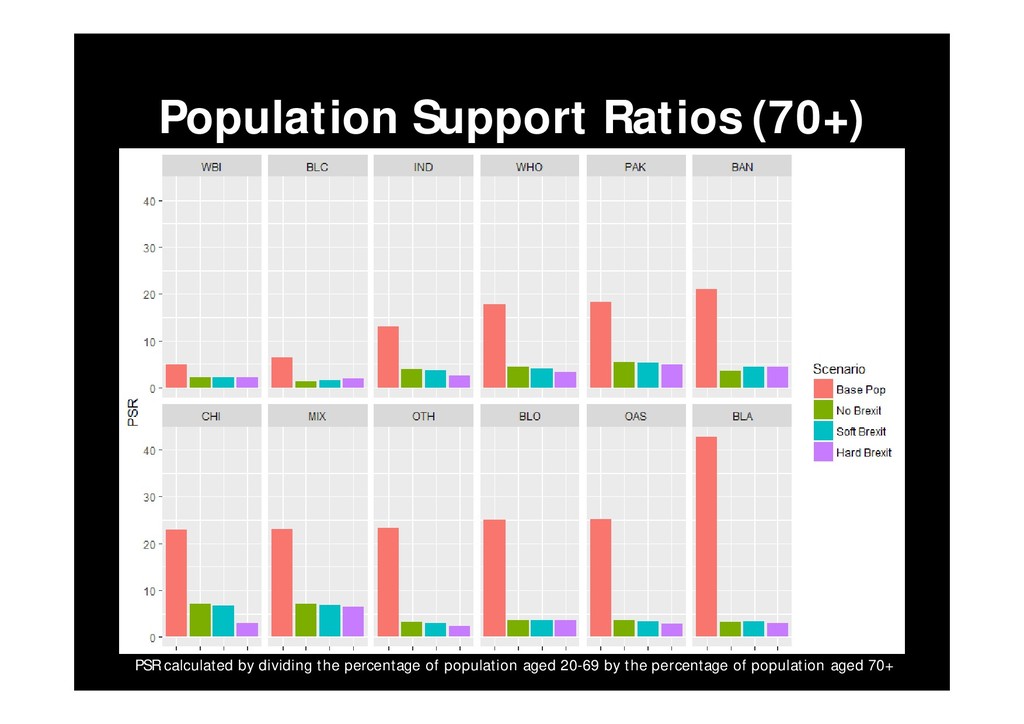
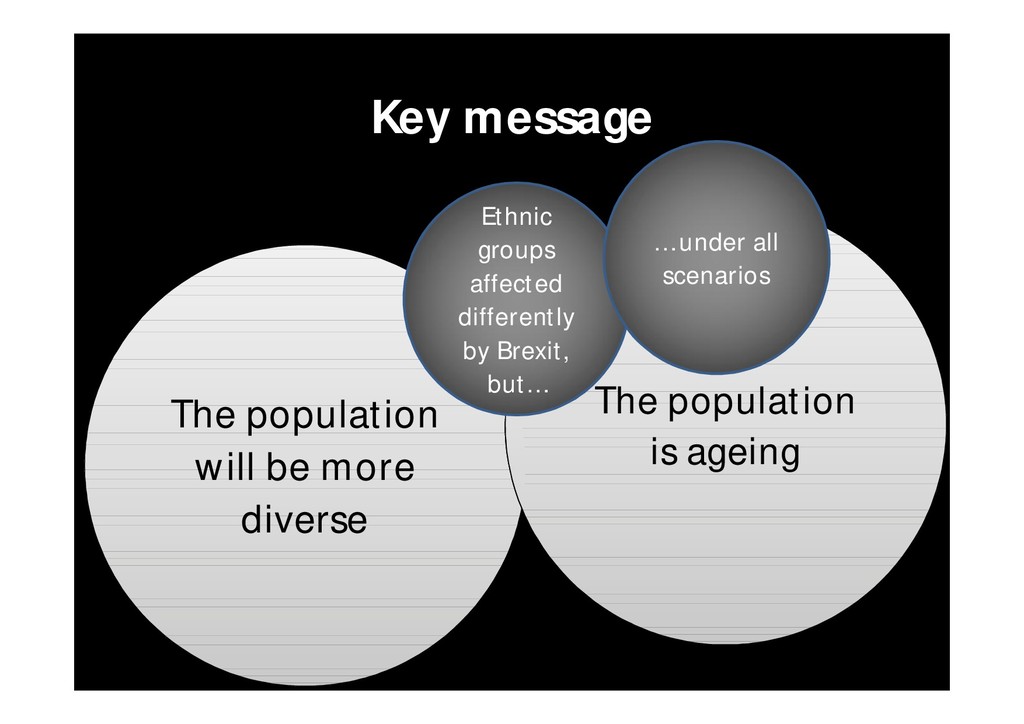
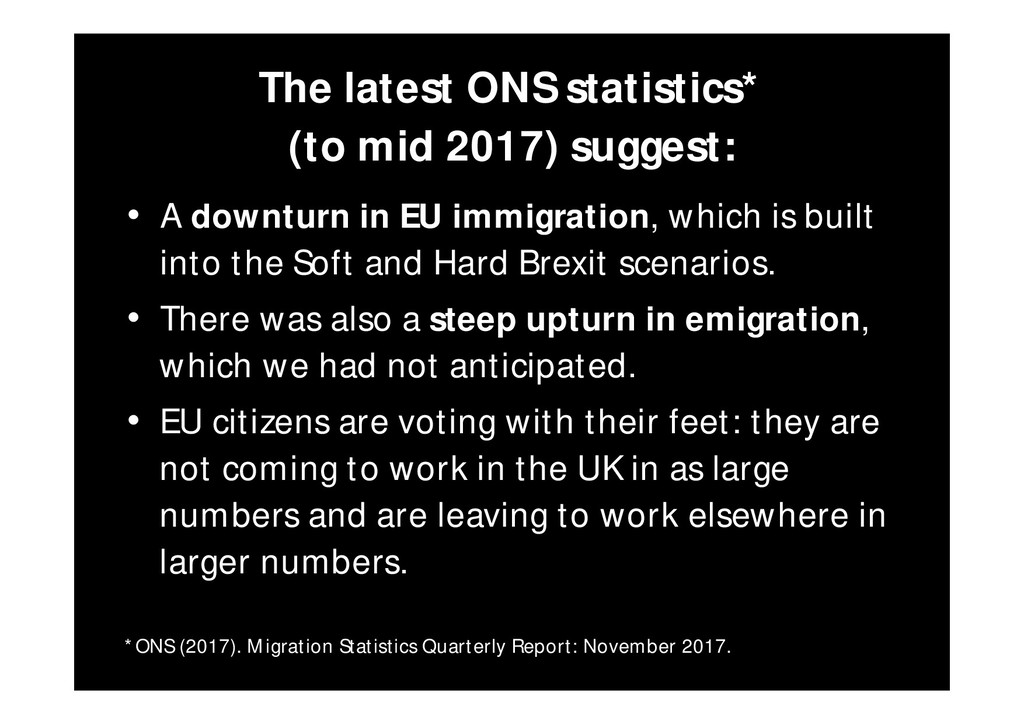
The United Kingdom faces demographic uncertainty, as negotiations for leaving the European Union (Brexit) proceed. This paper focuses on the sub-national changes in the ethnic composition of the UK’s population. Brexit has implications for international migration into and out of the UK, dependent on future immigration policy and on how attractive the UK will be as a labour market. At the same time, the UK population is experiencing ethnic diversification, consequent on past immigration. The transition to a more ethnically diverse population is set to continue but the pace of change will depend on the outcome of Brexit. To explore the UK’s future ethnic diversity, we run five population projection scenarios, disaggregated by locality, age, sex and ethnic group. Three international migration scenarios, varying by the extent of the break with the EU, are implemented together with two reference projections assuming zero international migration and zero migration (including internal migration). Ethnic groups are differently affected by these migration scenarios, depending on the contribution of international migration to population growth and the extent of demographic momentum. Under every scenario, the UK’s population is projected to continue to grow, age and diversify.

Nik Lomax

August 06, 2018
Tweet

More Decks by Nik Lomax

Other Decks in Research

Transcript

  1. 2018 IGU Regional Conference | Quebec
    Examining scenarios of
    ethnic composition in the
    United Kingdom
    Nik Lomax
    School of Geography
    FACULTY OF ENVIRONMENT
    [email protected]

    View Slide

  2. Context: Population trends
    59
    63
    Source: ONS Population of the United Kingdom by Country of Birth and Nationality
    80%
    82%
    84%
    86%
    88%
    90%
    92%
    94%
    96%
    98%
    100%
    56,000
    57,000
    58,000
    59,000
    60,000
    61,000
    62,000
    63,000
    64,000
    65,000
    66,000
    2004 2005 2006 2007 2008 2009 2010 2011 2012 2013 2014 2015 2016 2017
    % of population UK Born
    Population (000s)
    Year
    UK Population % UK Born CI

    View Slide

  3. The impact of assumptions on
    projections

    View Slide

  4. Variant projections
    "high population" variant assumes high fertility,
    life expectancy and net migration:
    4.1 million above principal projection
    "low population" variant assumes low fertility,
    life expectancy and net migration:
    4.9 million below principal projection

    View Slide

  5. Evaluation, Revision and Extension of Ethnic
    Population Projections - ETHPOP
    Our overall aim is to understand and to forecast
    the ethnic composition, size and distribution of
    the United Kingdom’s population
    www.ethpop.org
    The research was supported by ESRC award ES/L013878/1 for the project
    Evaluation, Revision and Extension of Ethnic Population Projections – NewETHPOP

    View Slide

  6. Why Ethnicity?
    • It is well established that demographic rates vary
    substantially by ethnic group: see Coleman
    (2006), Coleman (2010) Rees (2012).
    • Variation in service provision needs, e.g.
    – health care (Parliamentary office of Science and
    Technology 2007)
    – social care (Rees et al. 2009)
    – education (Penn, 2000)
    • Very important for monitoring ethnic advantage /
    disadvantage & segregation.

    View Slide

  7. Why Ethnicity?
    An ethnically disaggregated projection should
    perform better than one which is only
    disaggregated by age and sex because
    additional ethnic heterogeneity is taken in to
    account within the model.

    View Slide

  8. What impact do
    international and internal
    migration have on the size,
    composition and distribution
    of the UK population by
    ethnicity?
    Method: Run a
    projection model
    which
    experiments with
    migration
    components
    Aim: To prepare us
    for what will be a
    new and different
    demographic
    future
    Key Question

    View Slide

  9. How? A population projection model
    Pro
    Cohort
    component
    model
    Bi-regional
    Single year
    of age
    2 genders
    12
    ethnicities
    389 local
    authority
    areas
    2011 base
    50 year
    horizon
    Ethnic
    mixing

    View Slide

  10. Fertility and Mortality
    0
    20
    40
    60
    80
    100
    120
    140
    160
    <20 20-24 25-29 30-34 35-39 40+
    ASFR, 2001
    White Black-Caribbean Black-African Indian
    Pakistani Bangladeshi Chinese Other

    View Slide

  11. Internal migration
    0
    20
    40
    60
    80
    100
    120
    140
    160
    180
    200
    0to4 5to9 10to14 15to19 20to24 25to29 30to34 35to39 40to44 45to49 50to54 55to59 60to64 65to69 70to74 75+
    BAN
    BLA
    BLC
    CHI
    IND
    MIX
    OAS
    OBL
    OTH
    PAK
    WBI
    WHO
    Rate per 1,000
    Estimated from 2011 Census tables UKMIG003, MU01AUK_LA_All and MMo1_BUK_All

    View Slide

  12. International migration
    Direct impact
    Indirect
    impact

    View Slide

  13. Scenario assumptions
    Scenario International Migration
    No Brexit Net International Migration trended to = +252k in 2031-32,
    then constant. Annually, In = 621k, Out = 362k
    Soft Brexit Net International Migration trended to = +185k in 2031-32,
    then constant. Annually, In = 518k, Out = 333k
    Hard Brexit Net International Migration trended to = +100k in 2031-32,
    then constant. Annually, In = 349k, Out = 249k
    No International
    Migration
    Set to zero – Reference projection
    No Migration Set to zero – Reference projection
    Scenario Internal Migration
    No Brexit, Soft Brexit and
    Hard Brexit, No
    International Migration
    5-year average rates from 2006-07 to 2010-11 period applied
    to population at risk (by age, sex and ethnicity) in each year
    No Migration Set to zero – Reference projection

    View Slide

  14. Scenario assumptions

    View Slide

  15. Direct Impact of Migration
    Ethnicity No Brexit Soft Brexit Hard Brexit
    Immig. Emig. Balance Immig. Emig. Balance Immig. Emig. Balance
    White British & Irish 6,979 8,633 -1,655 5,924 8,009 -2,085 4,615 5,482 -867
    Other White 11,242 4,052 7,189 9,617 3,764 5,853 7,857 3,701 4,156
    Mixed 884 480 404 761 446 315 599 381 218
    Indian 2,584 835 1,749 2,211 776 1,435 1,397 755 642
    Pakistani 1,188 554 635 1,026 515 511 689 399 290
    Bangladeshi 293 256 37 253 238 16 245 168 76
    Chinese 2,281 855 1,425 1,943 794 1,149 868 402 465
    Other Asian 2,054 870 1,185 1,762 808 954 1,275 668 607
    Black African 1,508 461 1,046 1,290 428 862 1,295 692 603
    Black Caribbean 196 333 -138 169 311 -142 211 177 34
    Other Black 181 129 52 156 120 36 173 113 60
    Other 1,364 463 900 1,163 429 734 849 433 416
    All 30,754 17,922 12,831 26,277 16,638 9,639 20,072 13,370 6,702
    The cumulative immigration, emigration and balance for the period 2011 to 2060

    View Slide

  16. Indirect impact of migration
    No Brexit (business as usual)
    ‘Soft’ Brexit
    No Migration
    Four Migration Scenarios
    ‘Hard’ Brexit
    No International Migration

    View Slide

  17. Populations very reliant on
    international migration
    • Generally largest net
    migration groups
    • Indian – older population
    (34.1)
    • Chinese and Other have
    low fertility (1.26 / 1.77)

    View Slide

  18. Populations somewhat reliant on
    international migration
    Relatively young – BLA = 27.8 / OBL = 25.8
    Black African have large starting –population and relatively high fertility (2.64)

    View Slide

  19. Populations which continue to grow
    These groups have the demographic momentum to keep growing
    Very young populations: Pakistani = 27; Bangladeshi = 25.5; Mixed = 21.8 (youngest)
    Pakistani and Bangladeshi have very high fertility: TFR=3.2 and 3.47

    View Slide

  20. Populations which are declining
    anyway
    These are the oldest groups who continue to age (WBI = 41.4; BLC = 38.7)
    They have relatively low fertility (WBI = 1.83; BLC = 1.75)
    They have net out-migration (except BLC under Hard Brexit)

    View Slide

  21. Composition and diversity
    Ethnicity 2061 Population Scenario (%)
    2011
    Population
    (%)
    No Brexit Soft Brexit Hard Brexit
    No
    International
    Migration
    No Migration
    White British & Irish 82.4 57.9 59.6 64.5 75.6 75.2
    Other White 4.5 12.9 11.8 10.0 4.0 3.9
    Mixed 2.0 4.9 4.9 4.8 4.3 4.4
    Indian 2.4 5.2 5.0 3.8 2.7 2.9
    Pakistani 1.9 5.1 5.1 4.9 4.6 4.6
    Bangladeshi 0.7 1.5 1.6 1.8 1.8 1.8
    Chinese 0.7 2.6 2.4 1.4 0.6 0.6
    Other Asian 1.4 3.1 3.0 2.5 1.6 1.7
    Black African 1.7 3.7 3.7 3.5 2.5 2.7
    Black Caribbean 0.9 0.5 0.6 0.8 0.9 0.9
    Other Black 0.4 0.6 0.6 0.7 0.6 0.6
    Other 0.9 1.8 1.7 1.4 0.8 0.8
    Total 100.0 100.0 100.0 100.0 100.0 100.0
    Total Pop. 63,743 86,902 82,883 78,087 65,659 66,742
    Diversity 0.32 0.64 0.62 0.57 0.42 0.43
    Index of Diversity = 1 - Se
    re
    2 where re
    = proportion of the population in ethnic group e

    View Slide

  22. Sub-national changes (Soft Brexit)
    Index of Diversity = 1 - Se
    re
    2 where re
    = proportion of the population in ethnic group e

    View Slide

  23. Population Support Ratios (70+)
    PSR calculated by dividing the percentage of population aged 20-69 by the percentage of population aged 70+

    View Slide

  24. Key message
    Ethnic
    groups
    affected
    differently
    by Brexit,
    but…

    View Slide

  25. Key message
    The population
    will be more
    diverse
    The population
    is ageing
    Ethnic
    groups
    affected
    differently
    by Brexit,
    but…
    … under all
    scenarios

    View Slide

  26. The latest ONS statistics*
    (to mid 2017) suggest:
    • A downturn in EU immigration, which is built
    into the Soft and Hard Brexit scenarios.
    • There was also a steep upturn in emigration,
    which we had not anticipated.
    • EU citizens are voting with their feet: they are
    not coming to work in the UK in as large
    numbers and are leaving to work elsewhere in
    larger numbers.
    *ONS (2017). Migration Statistics Quarterly Report: November 2017.

    View Slide

  27. 2018 IGU Regional Conference | Quebec
    Examining scenarios of
    ethnic composition in the
    United Kingdom
    Nik Lomax
    School of Geography
    FACULTY OF ENVIRONMENT
    [email protected]

    View Slide