Upgrade to Pro — share decks privately, control downloads, hide ads and more …

Utilising Synthetic Microdata to assess the spatial distribution of the inclusive economy

Nik Lomax
November 04, 2022

Utilising Synthetic Microdata to assess the spatial distribution of the inclusive economy

Presented at the British Society for Population Studies annual conference, Winchester on the 5th September 2022.

Abstract
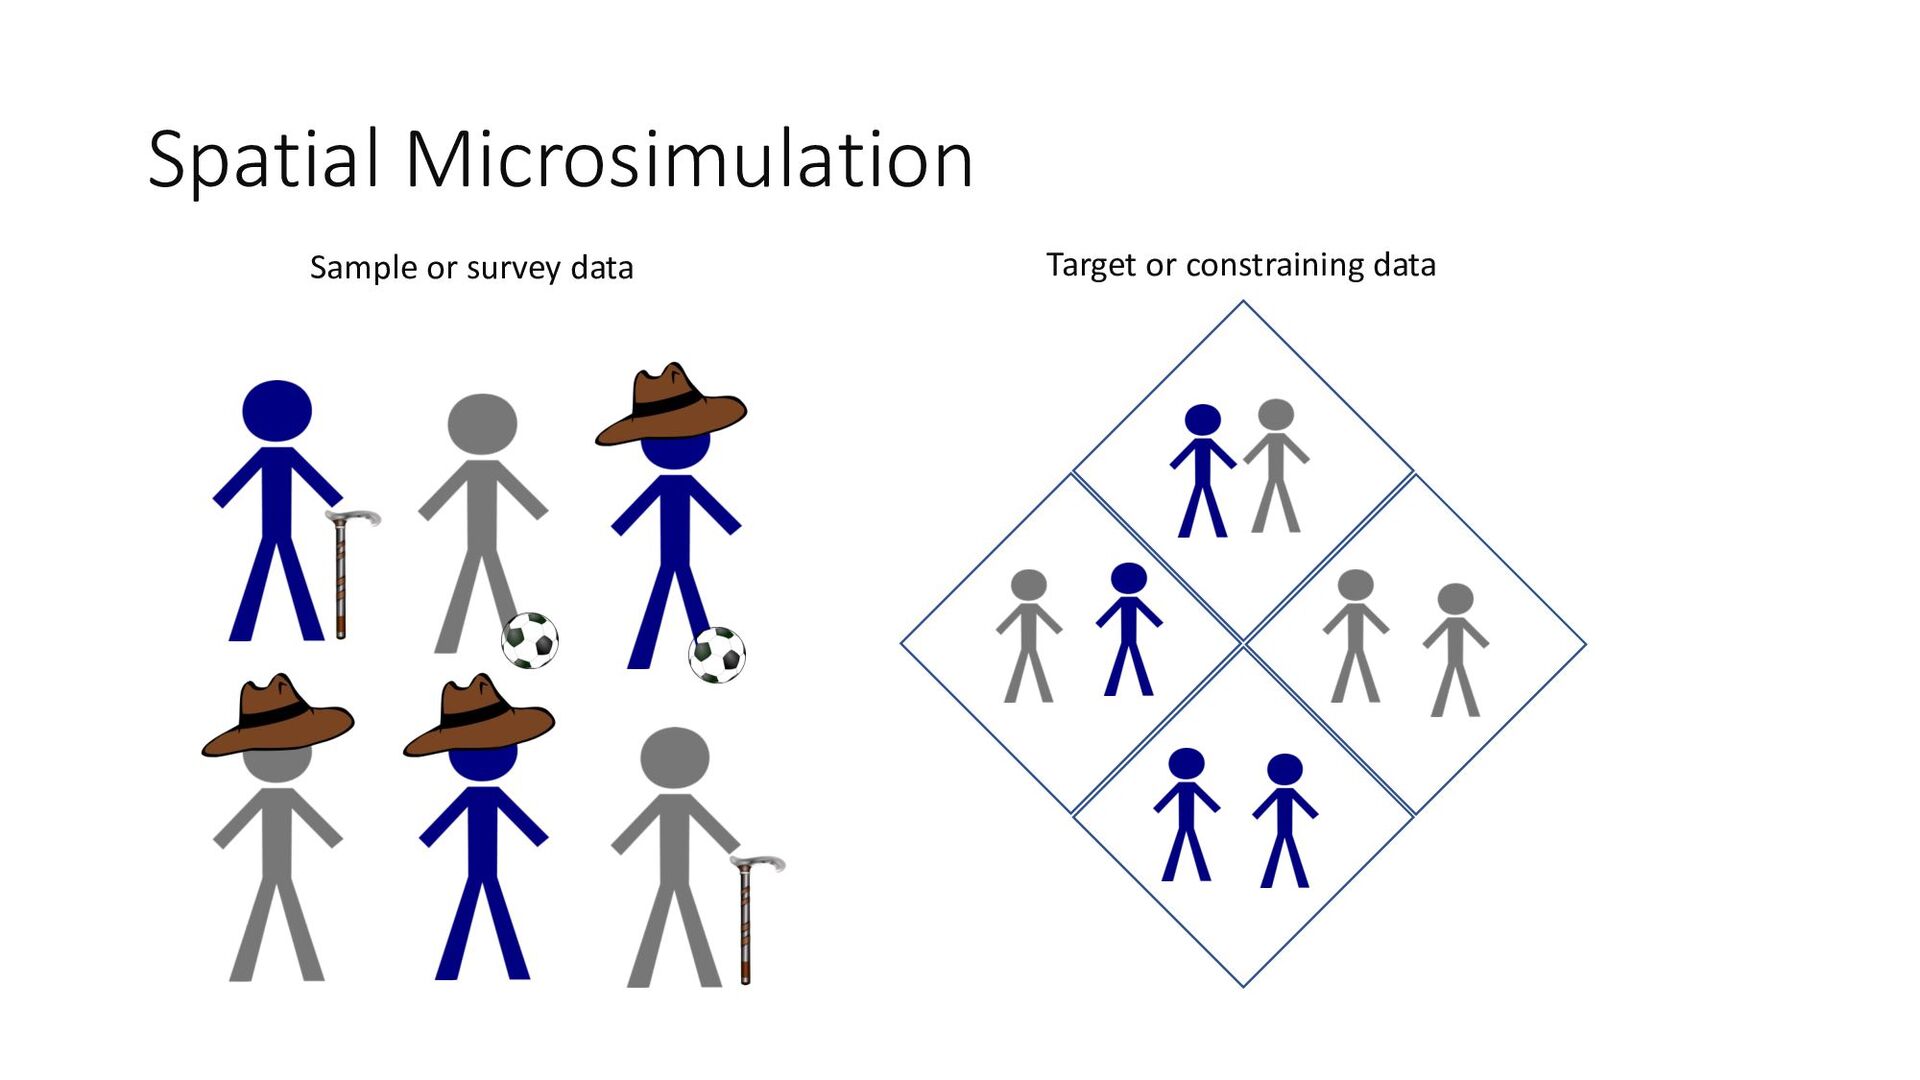
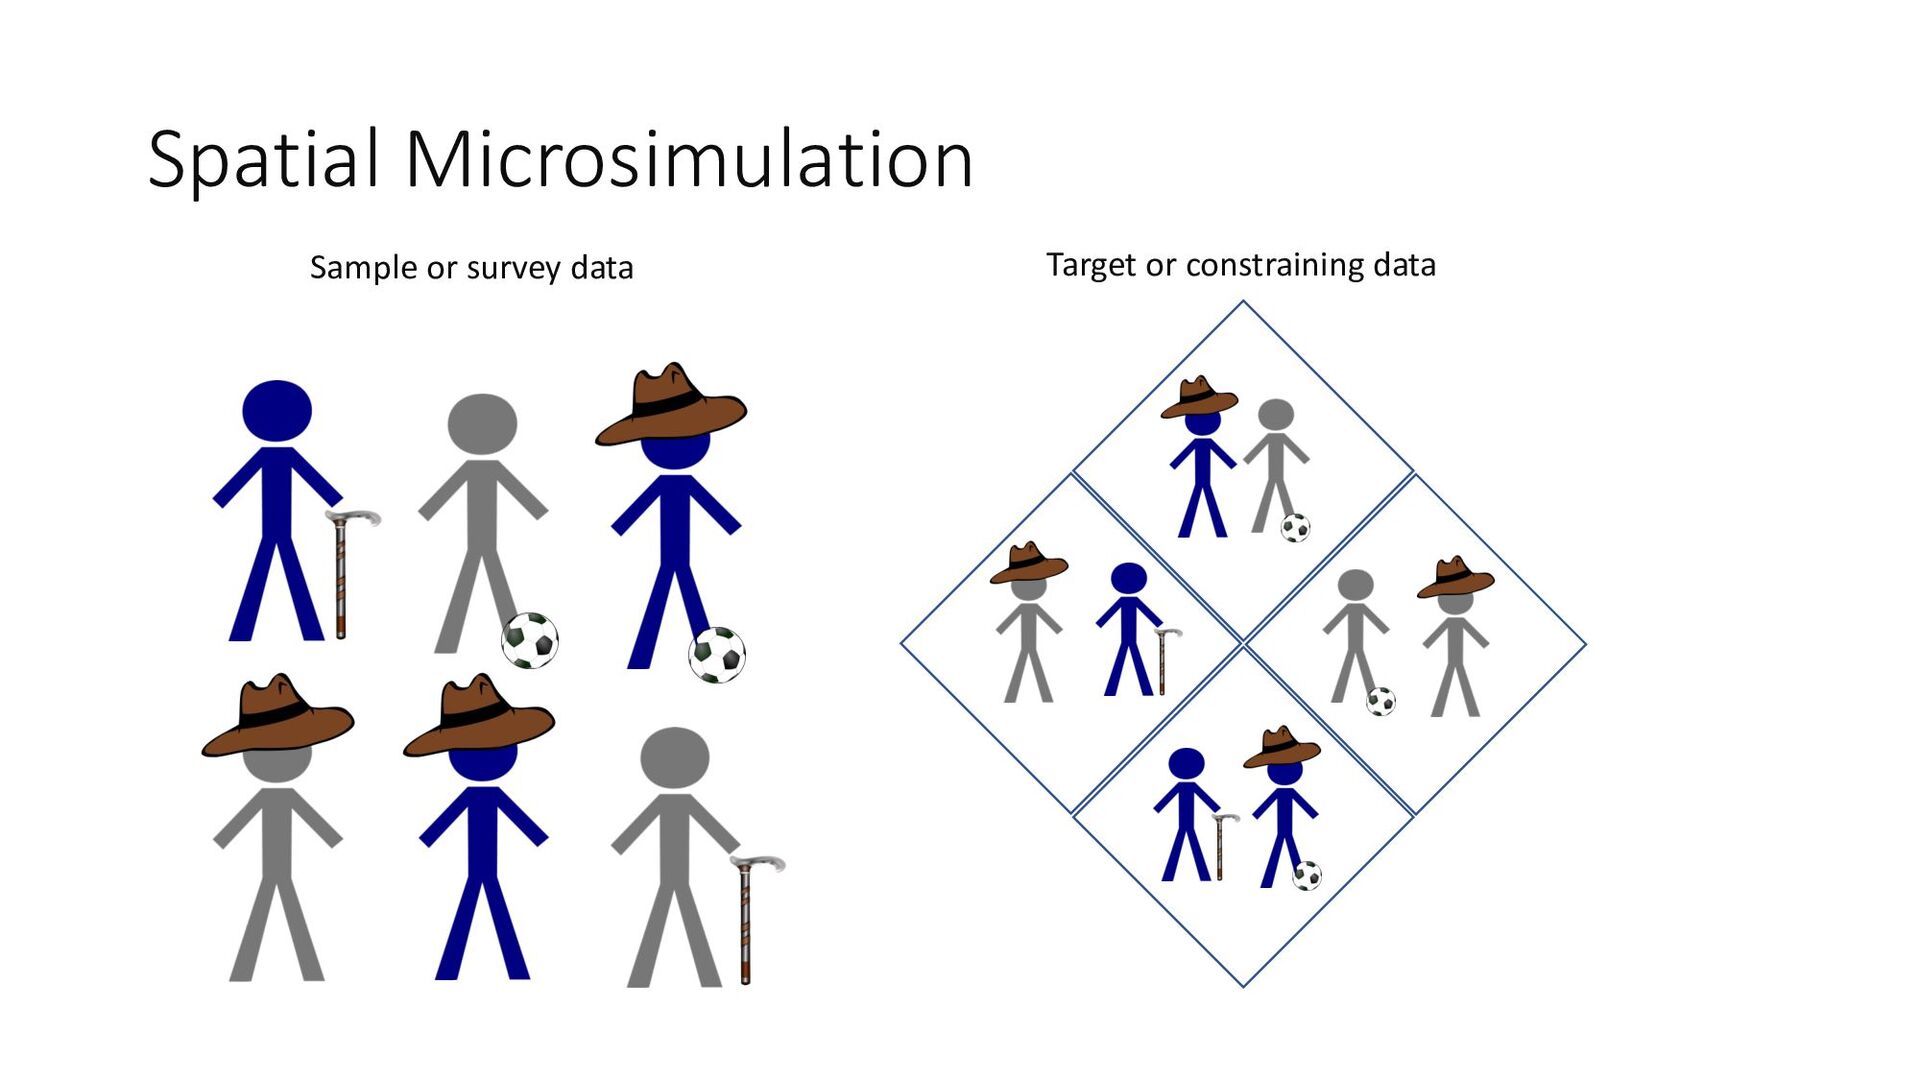
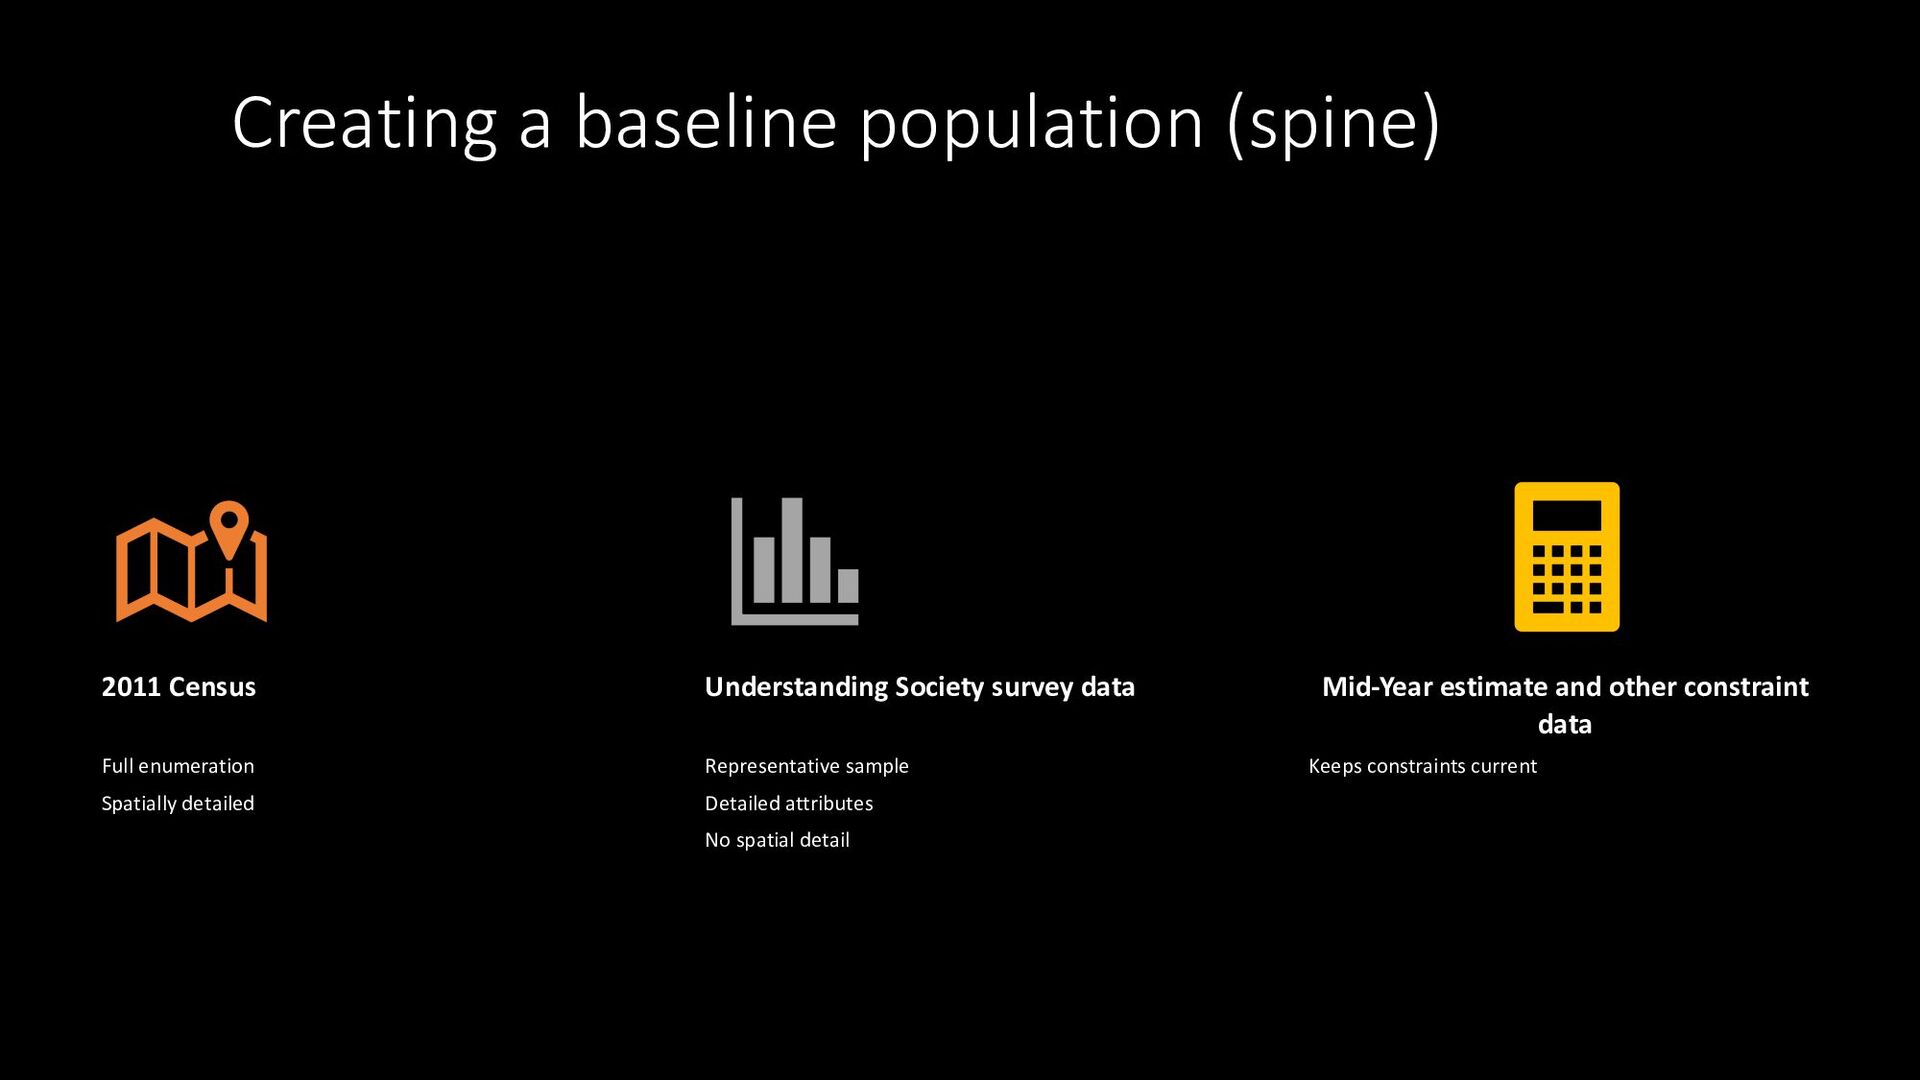
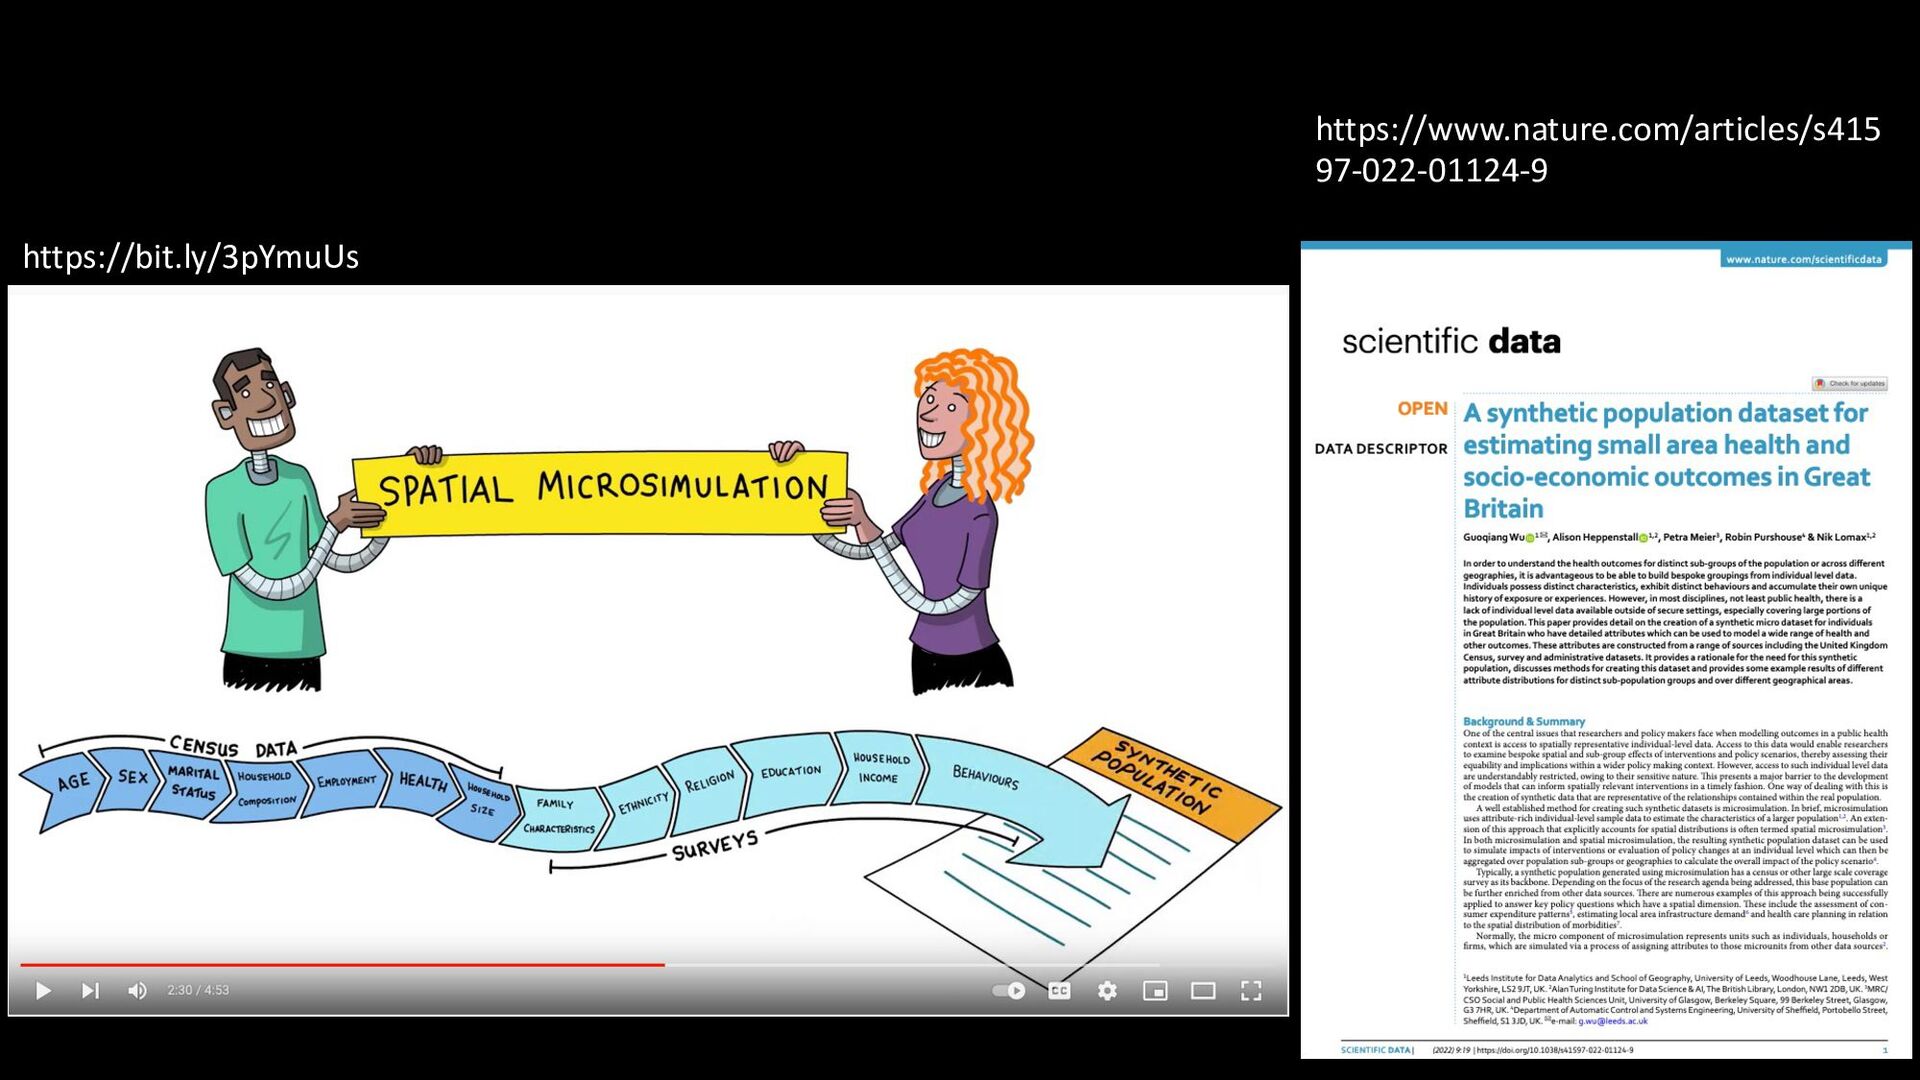
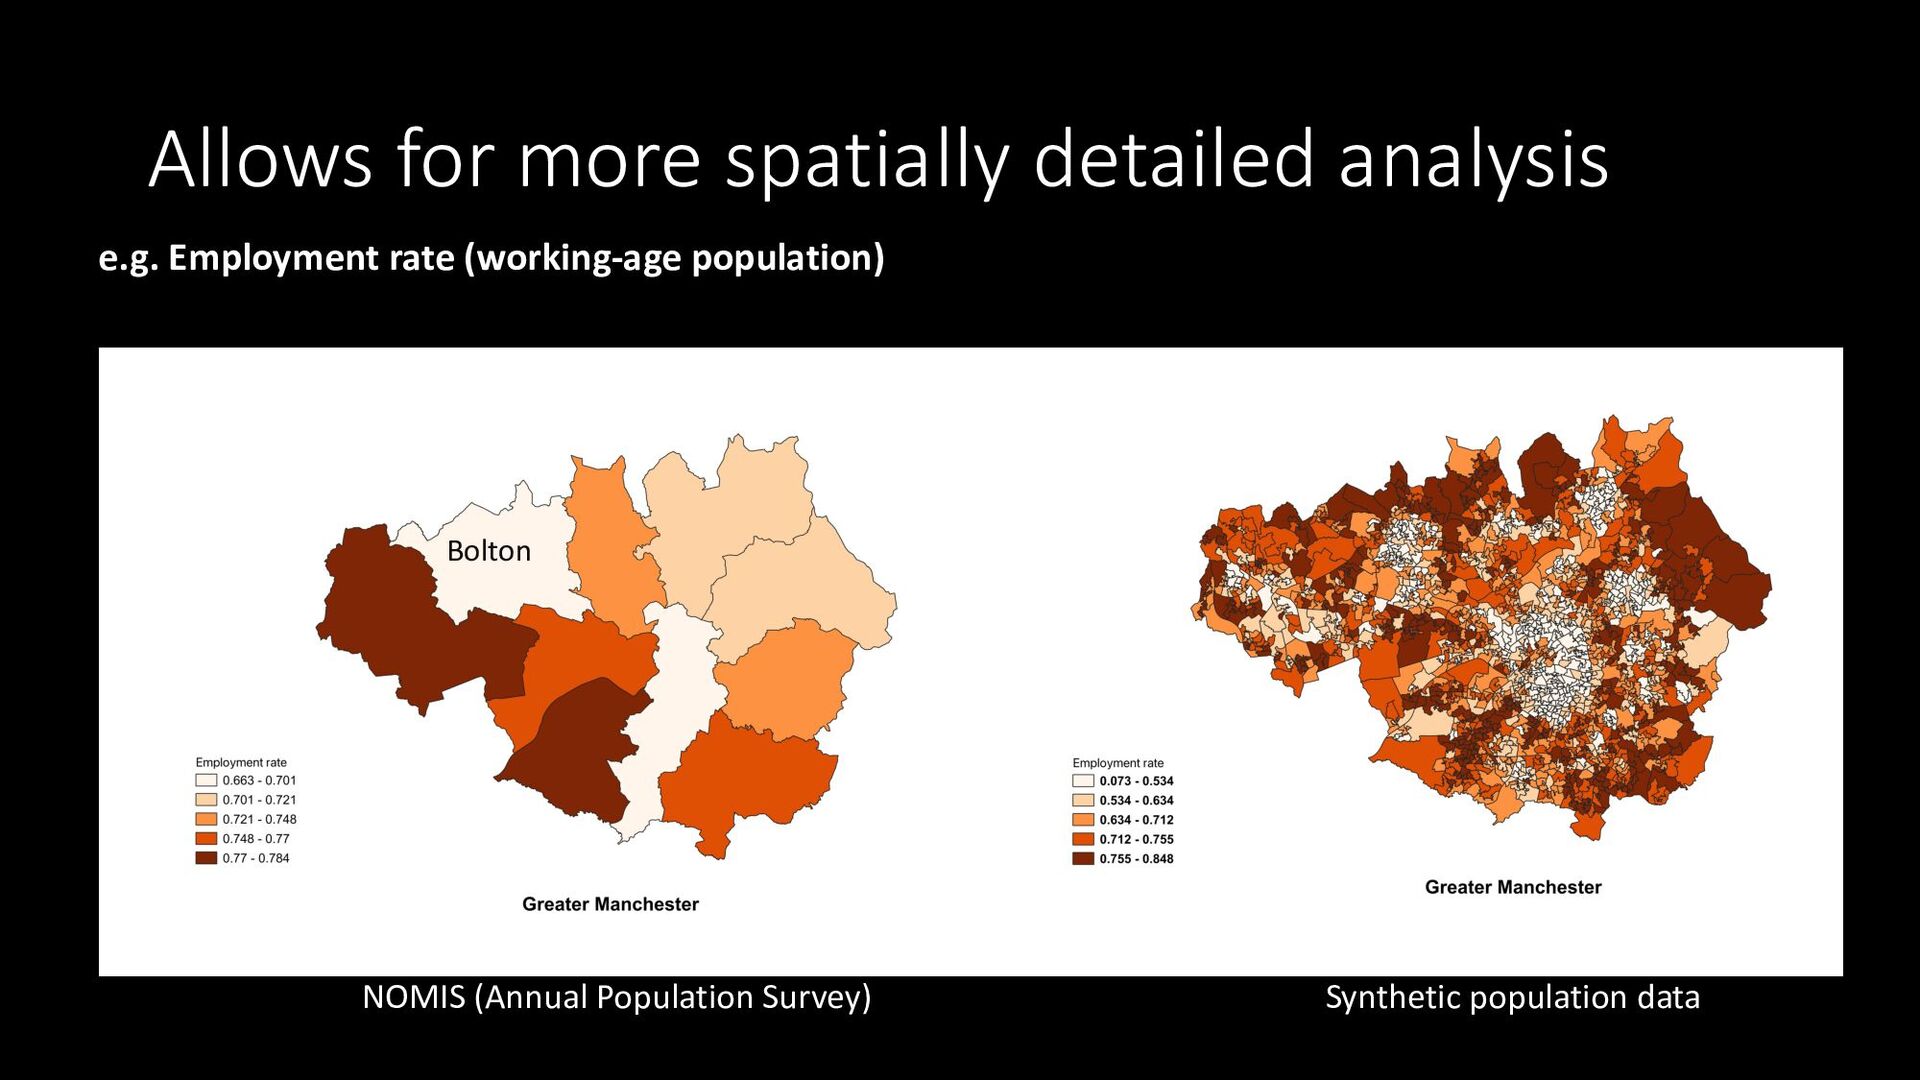
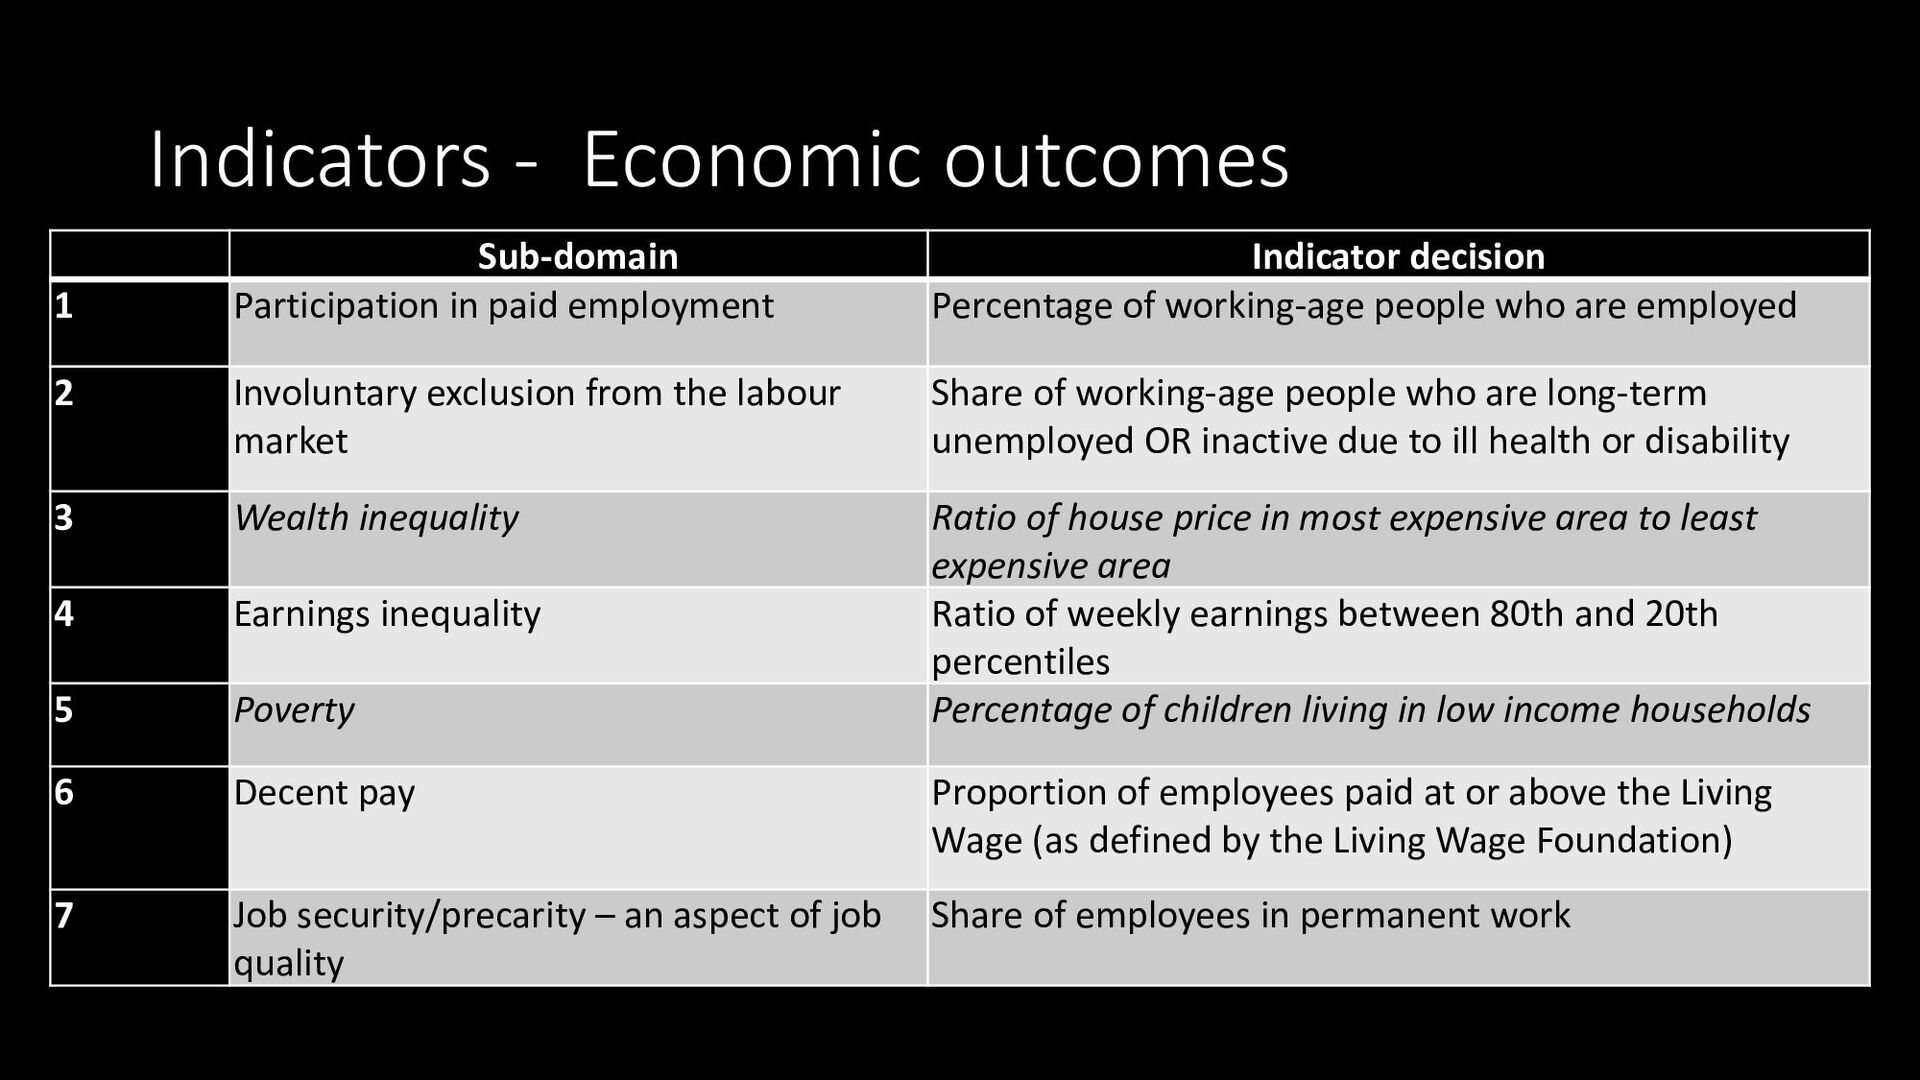
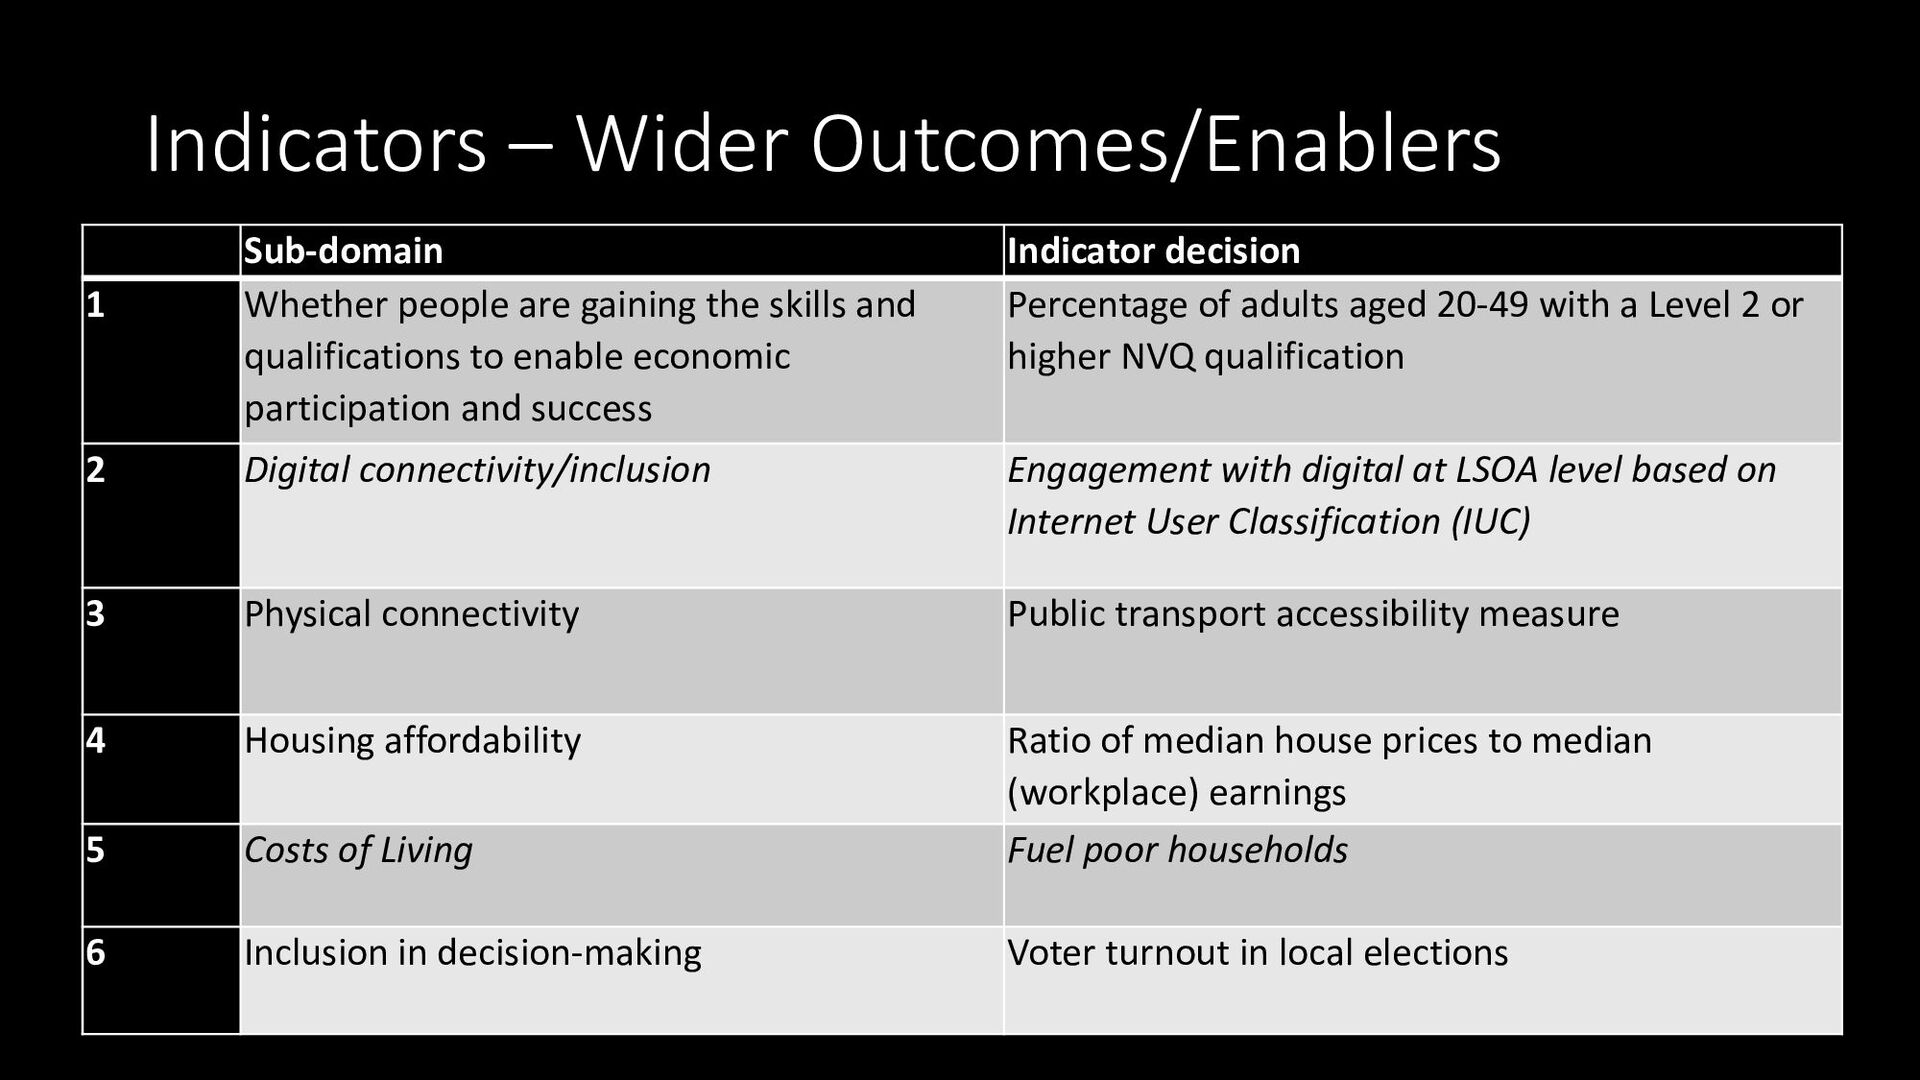
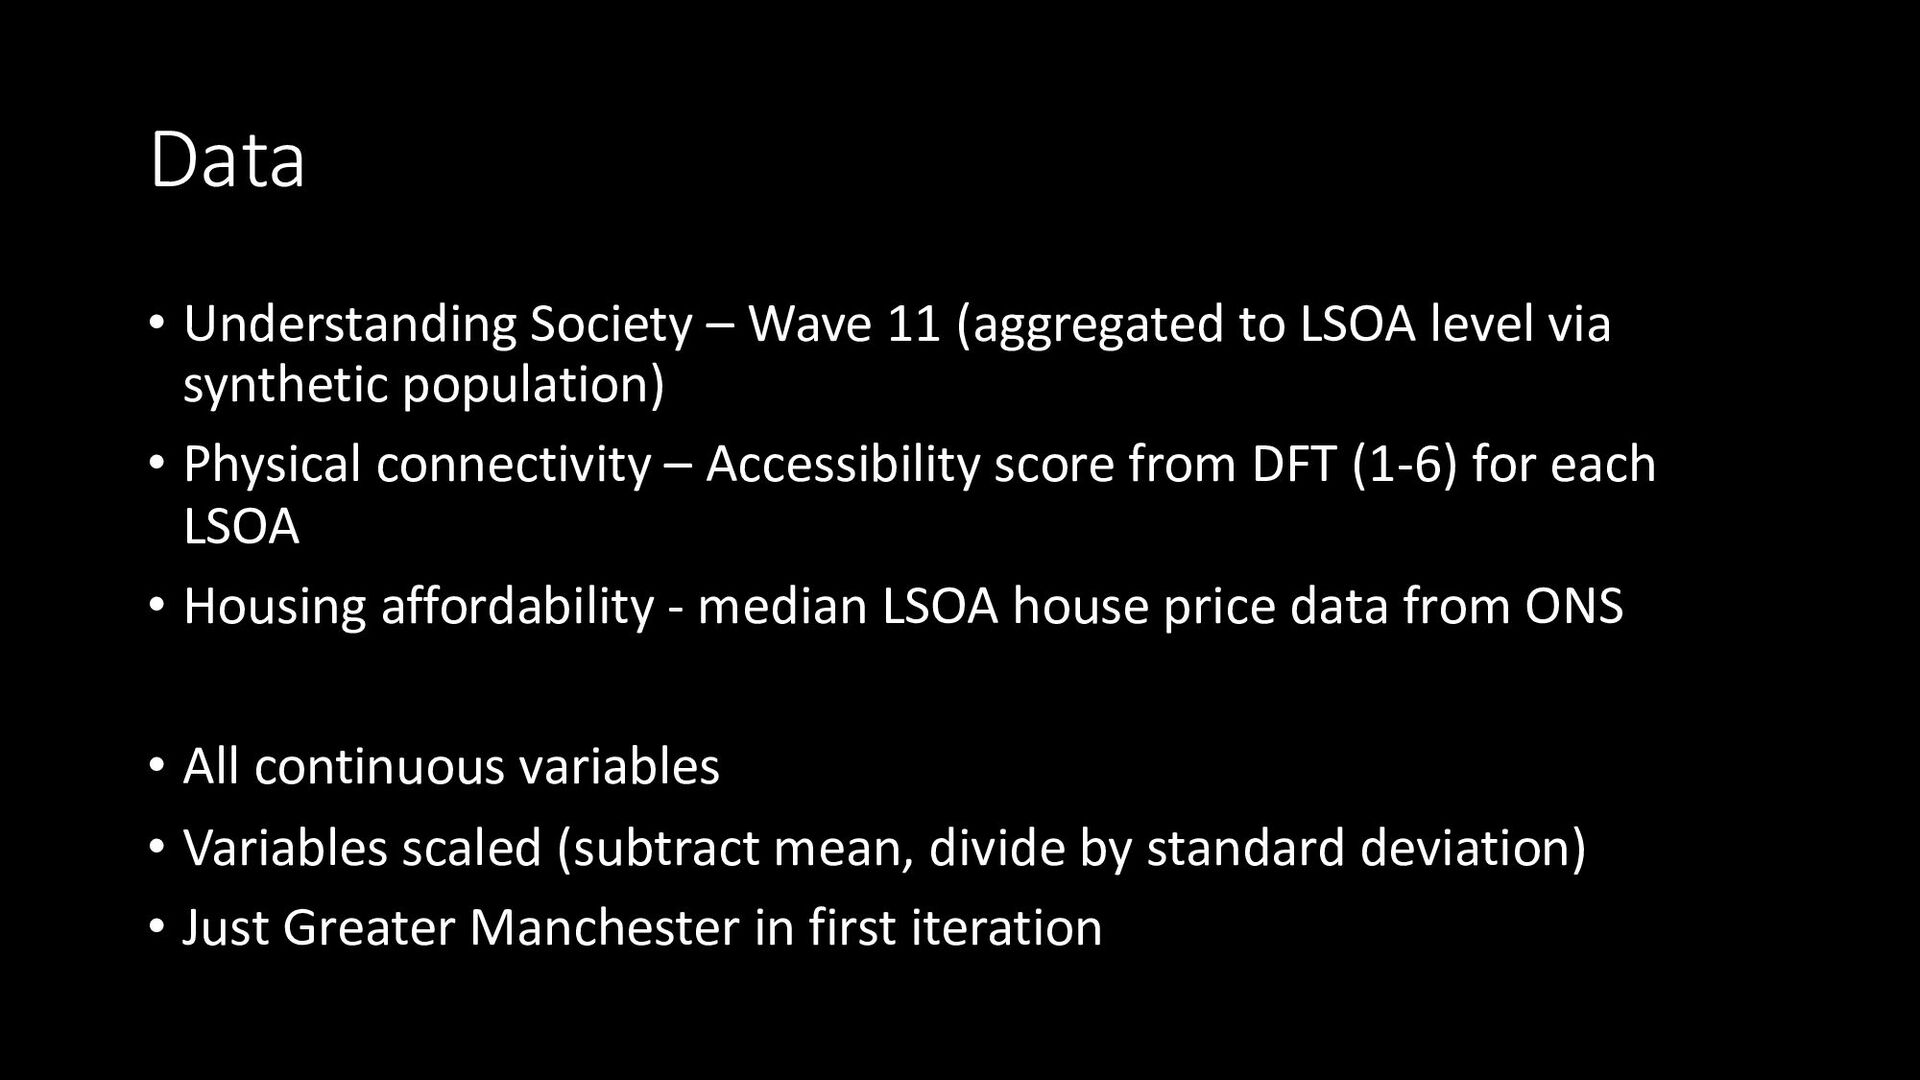
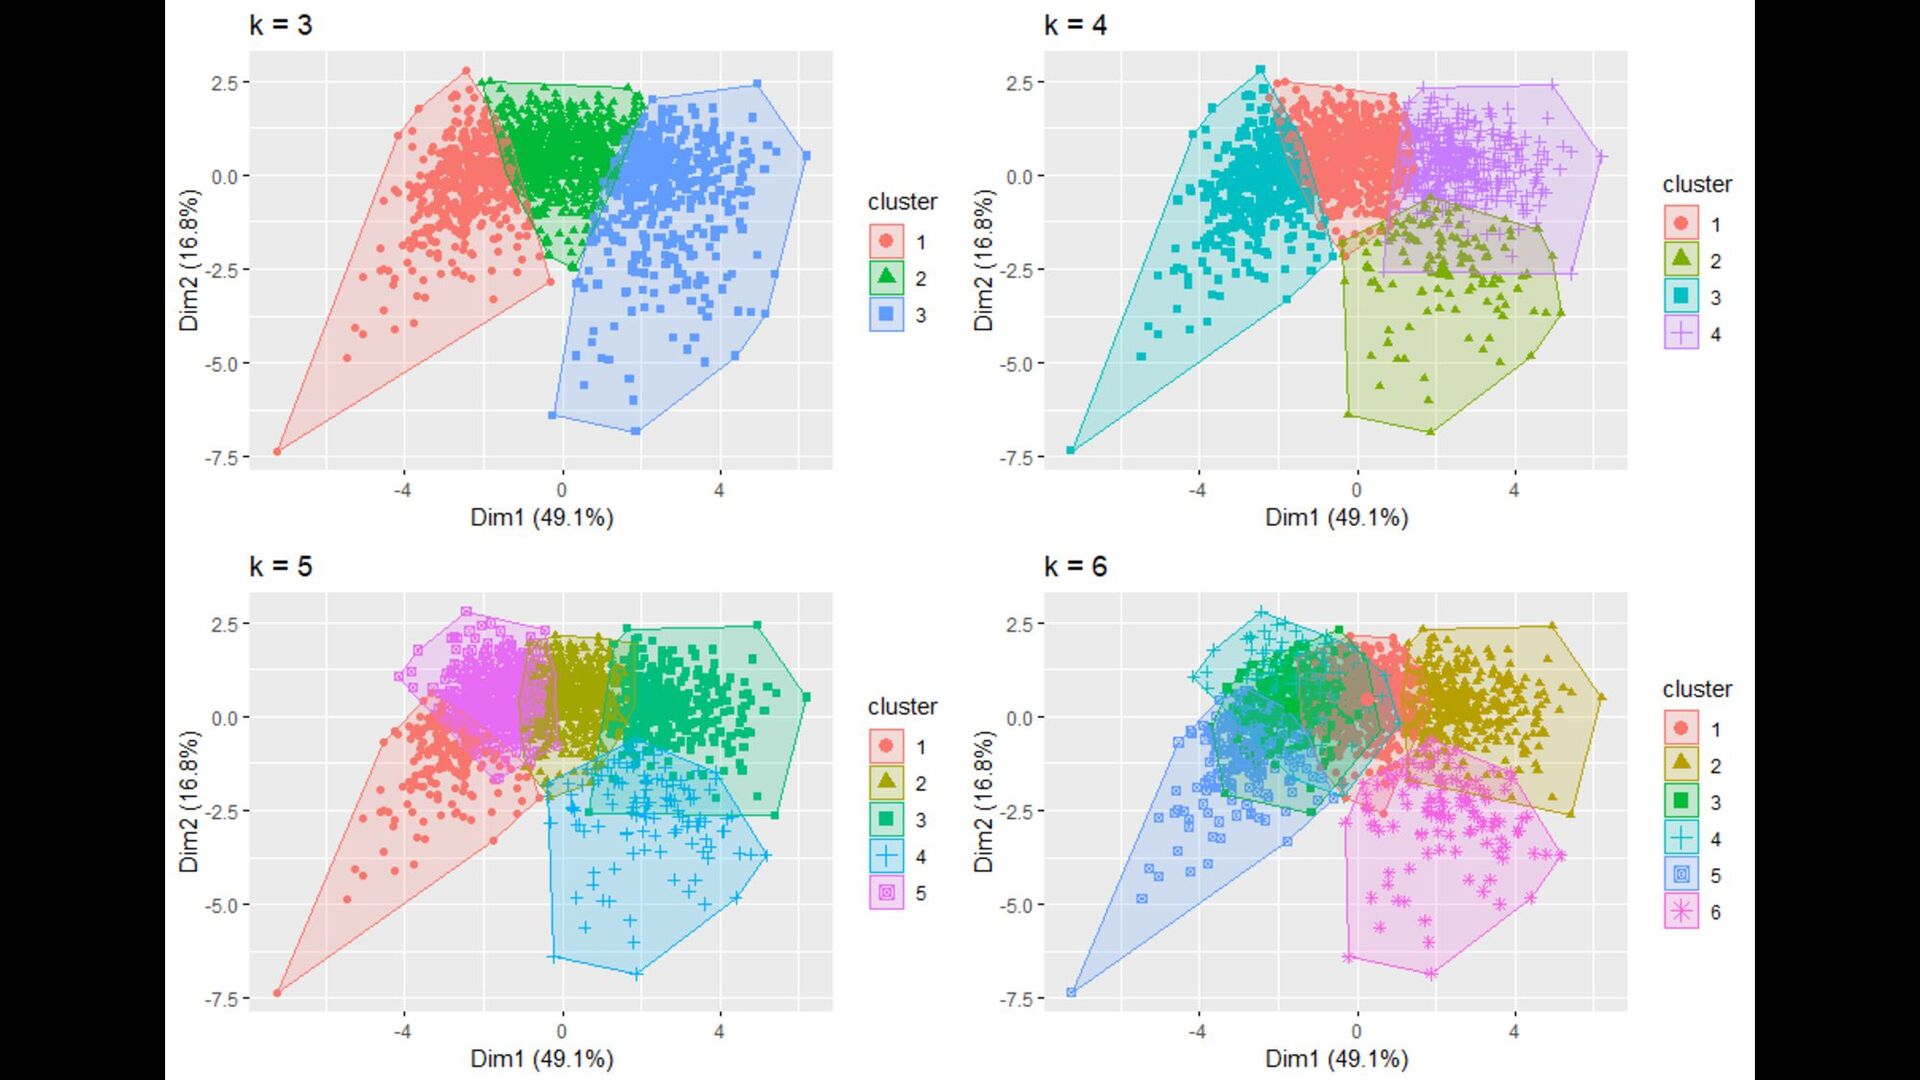
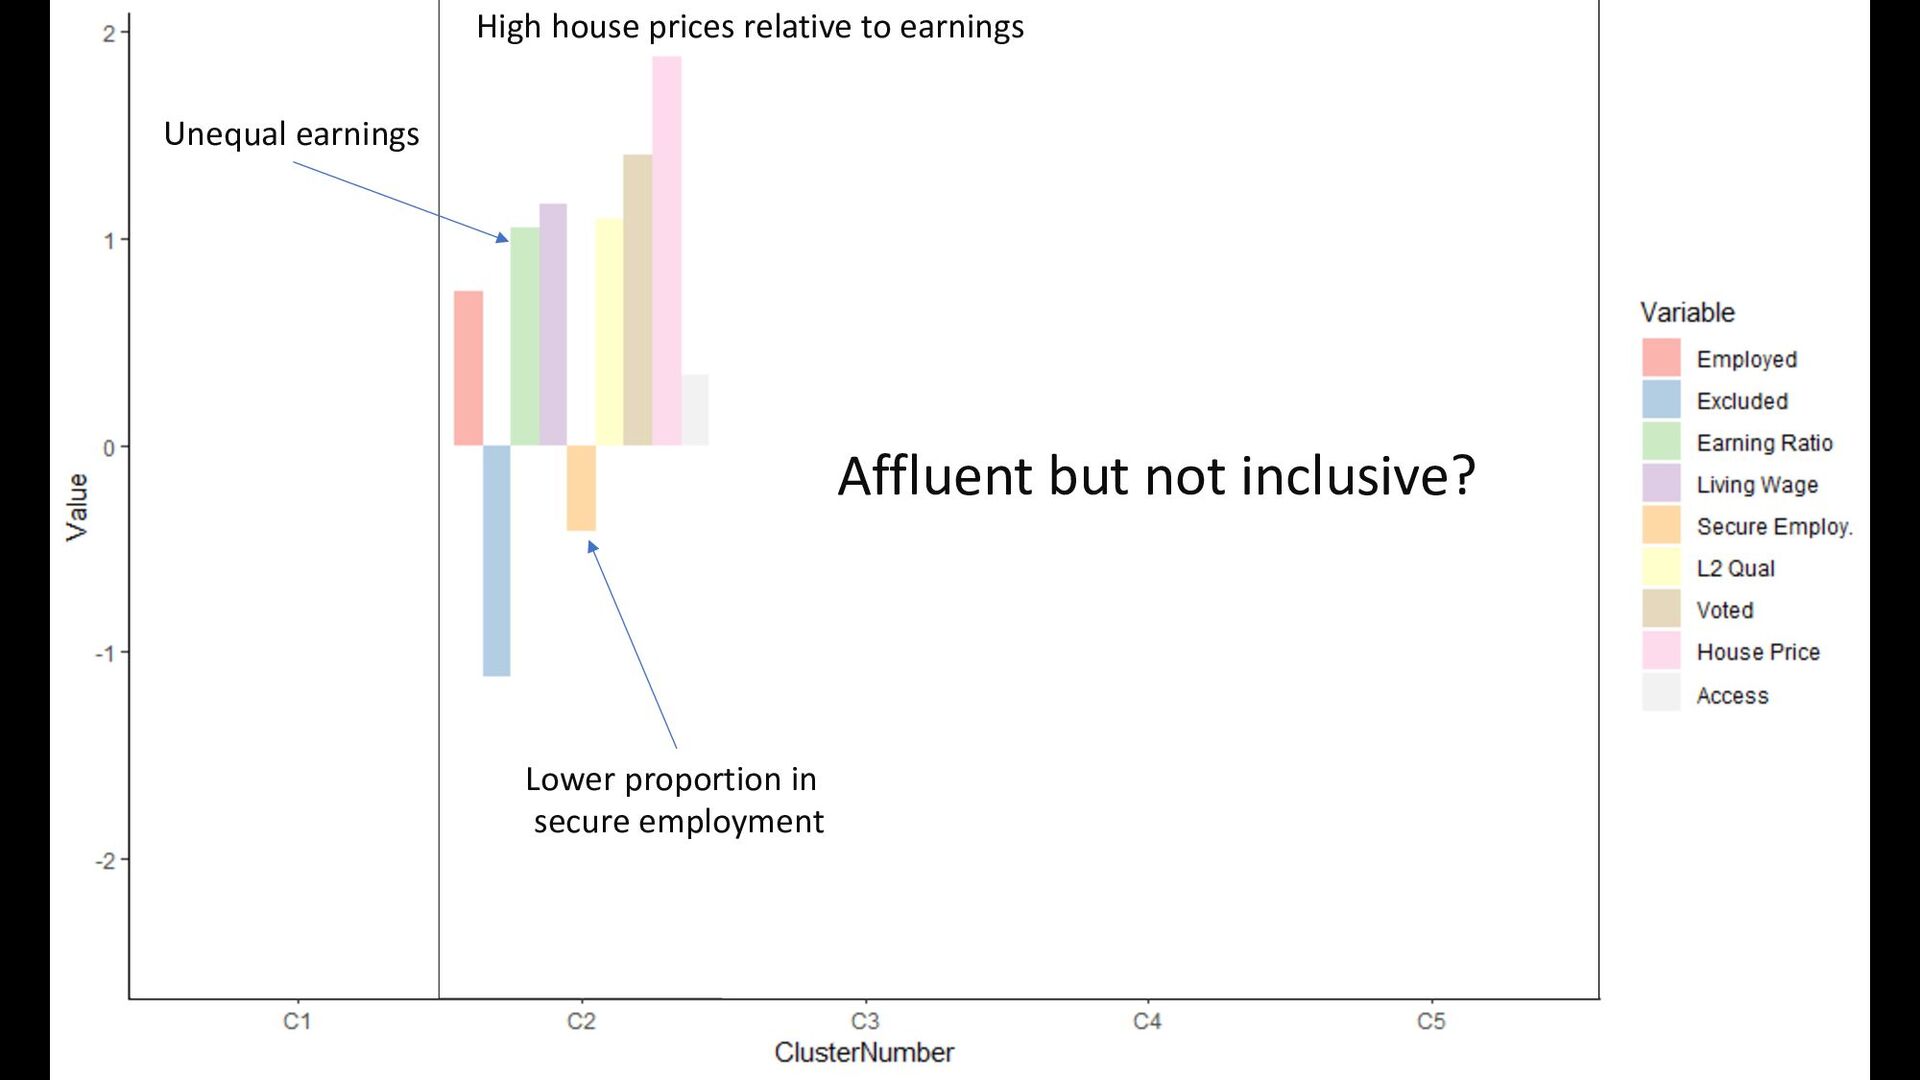
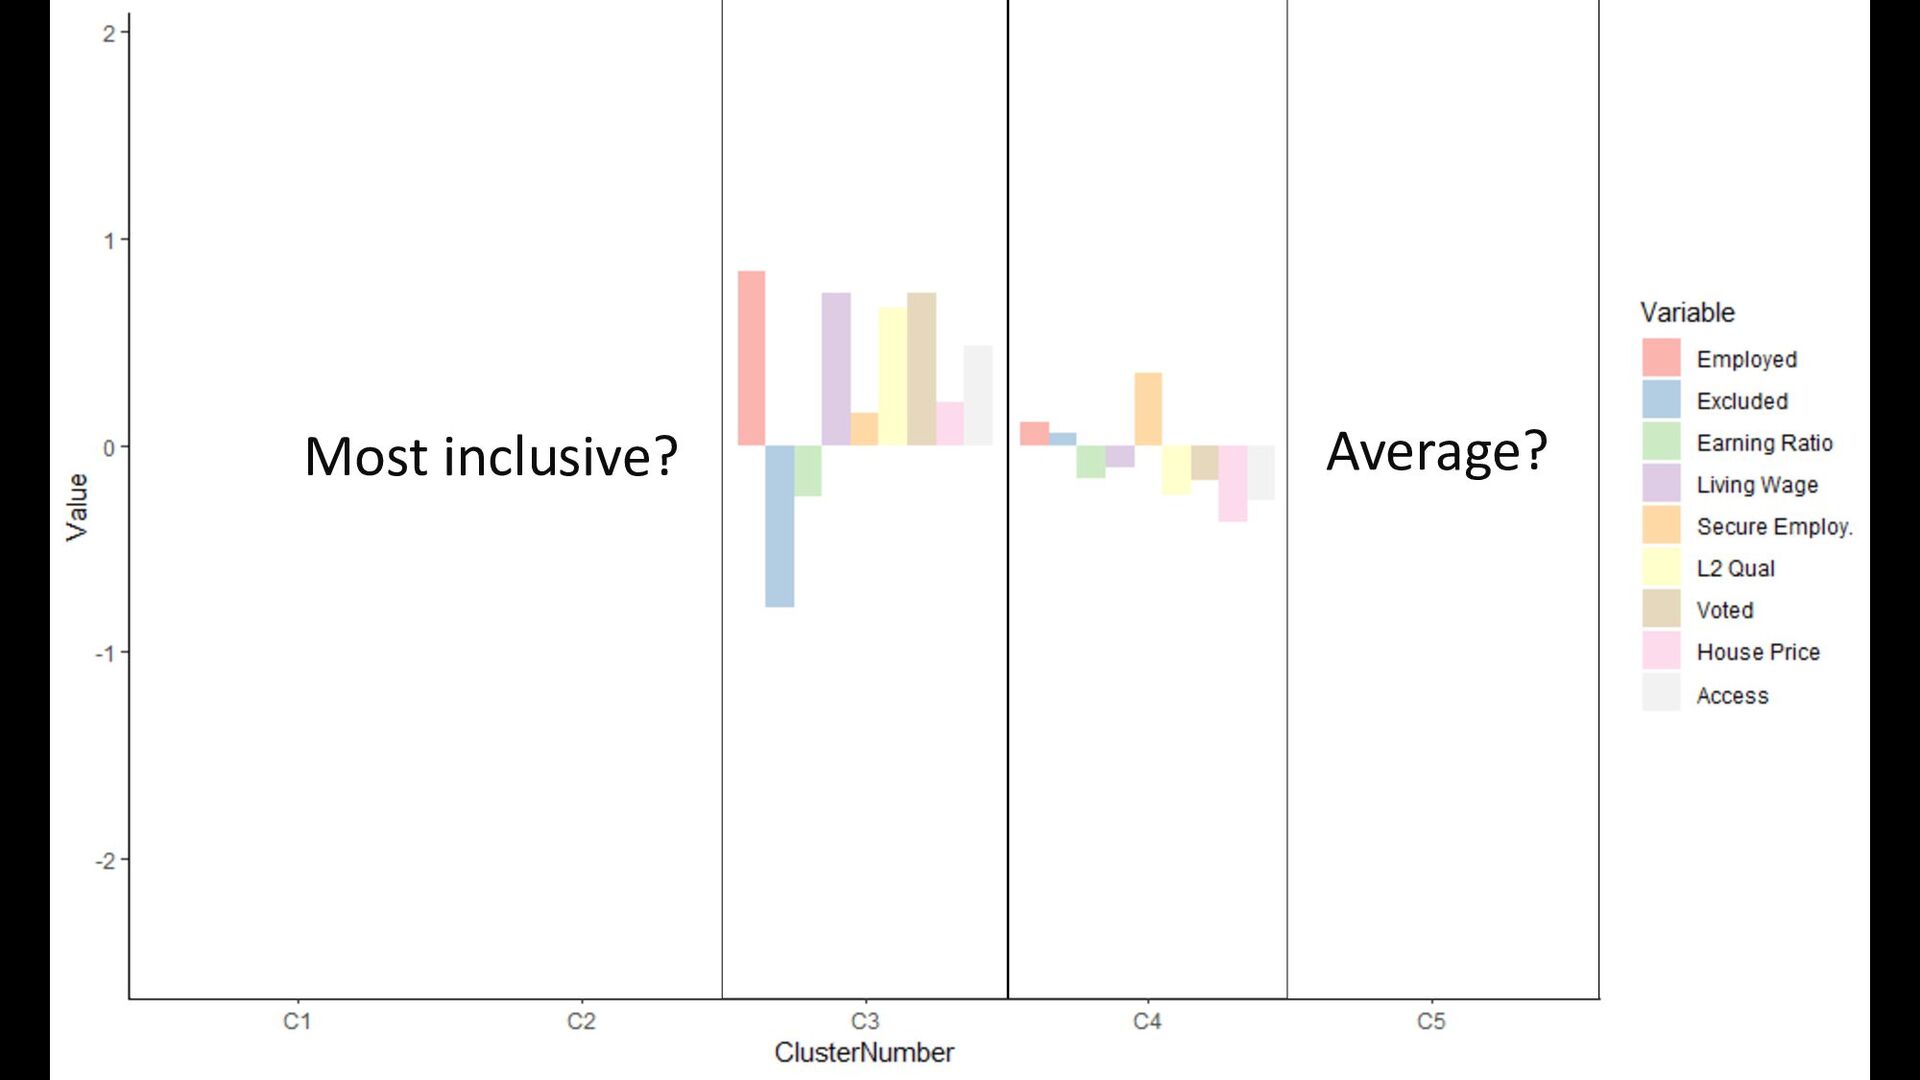
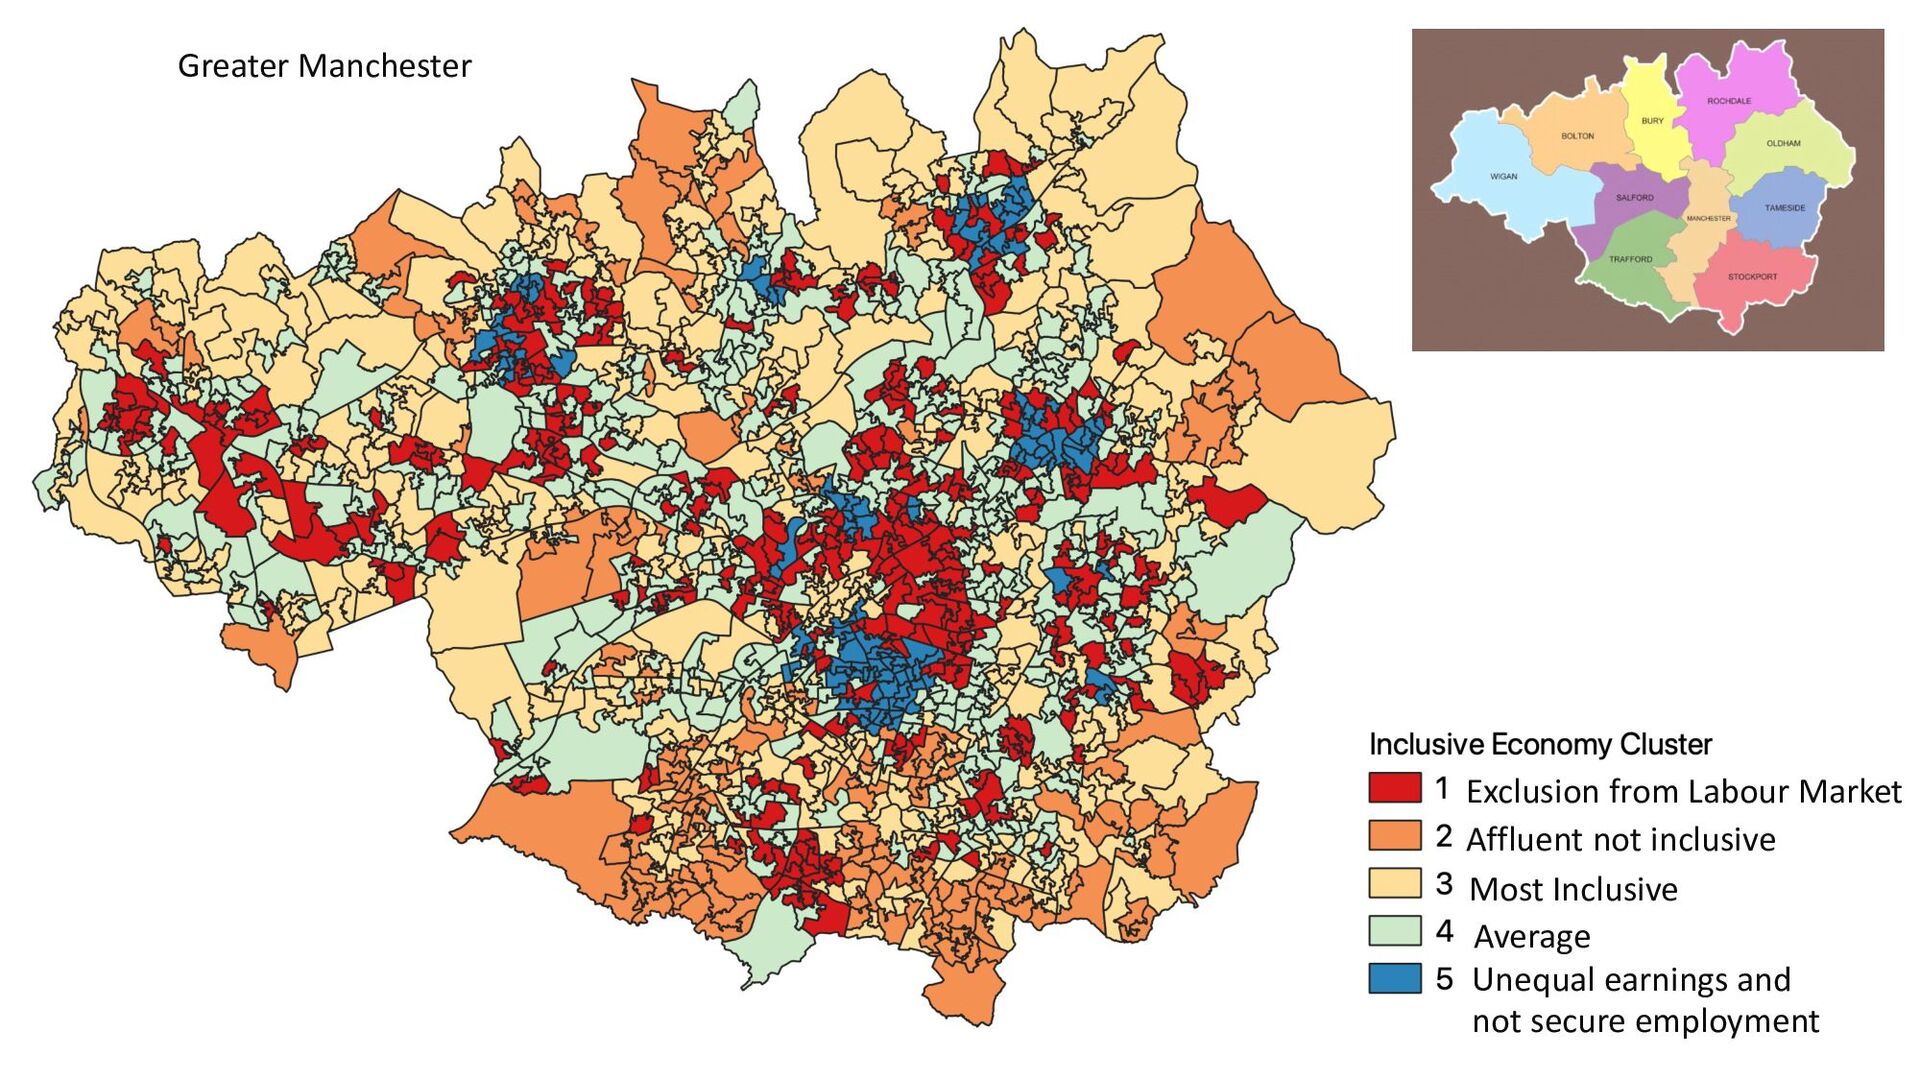
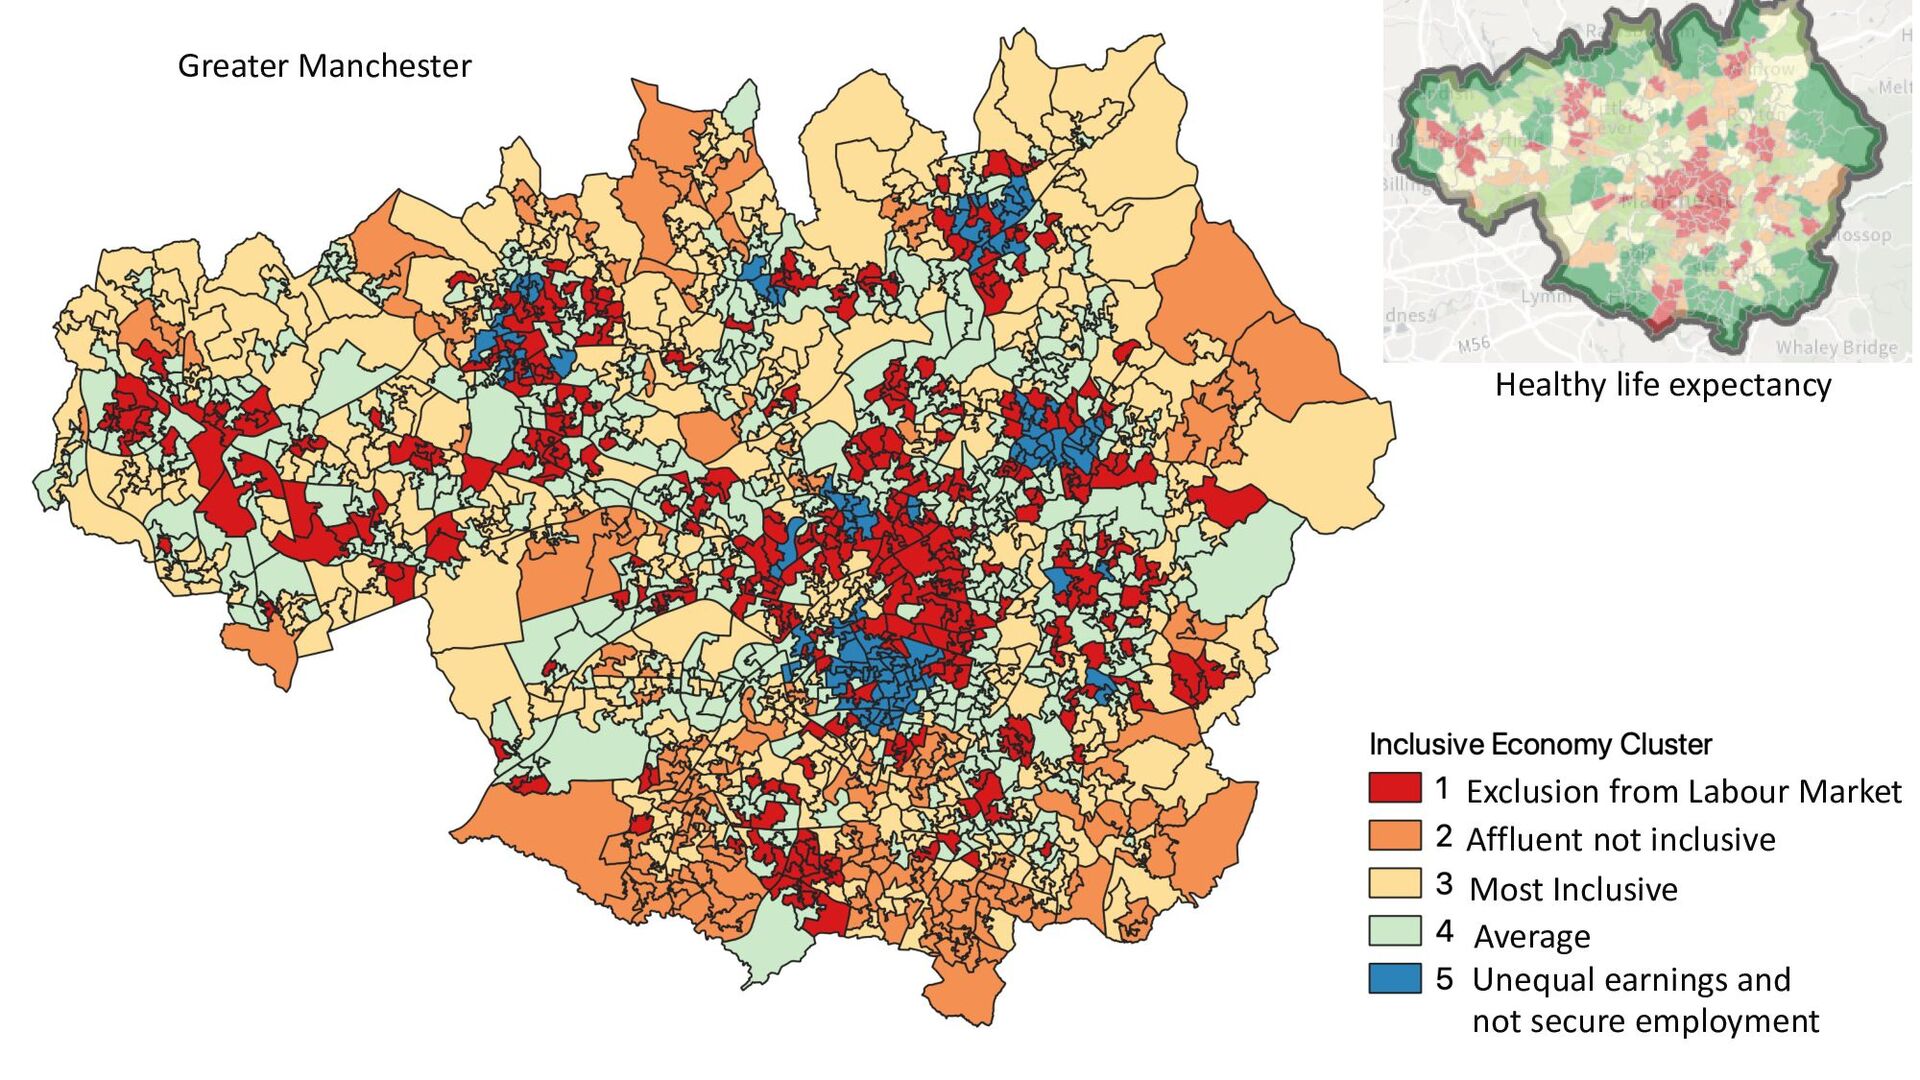
A barrier to undertaking detailed spatial analysis of policy is the lack of high-resolution data on the composition and distribution of the population across key variables of interest. In this paper we utilise a spatially representative individual level ‘digital twin’ dataset of the UK population that has been built from a range of datasets (census, survey and administrative) using spatial microsimulation methods. We are concerned with assessing the spatial distribution of variables which contribute to how inclusive the economy is at a fine spatial resolution. These indicators include access to services, jobs and affordable housing which all vary spatially and temporally. We create an area-based classification from these variables and compare area types to understand how (un)equal the distribution of inclusivity is within a number of UK cities. We briefly outline the data used, methods, strengths and limitations of both the digital twin population and the indicators set before presenting results from the classification exercise. SIPHER’s inclusive economy indicators are designed for inclusion in models of relationships between policies for economic inclusion and health outcomes. The results will help policy makers by demonstrating where there is specific need across the inclusive economy domains.

Nik Lomax

November 04, 2022
Tweet

More Decks by Nik Lomax

Other Decks in Research

Transcript

  1. Utilising Synthetic Microdata to
    assess the spatial distribution of
    the inclusive economy
    Nik Lomax1, Ceri Hughes2, Ruth Lupton2
    1School of Geography | University of Leeds | Alan Turing Institute
    [email protected] |Twitter @NikLomax
    2University of Manchester
    BSPS| Winchester| 5 September 2022

    View Slide

  2. The Synthetic Microdata

    View Slide

  3. Spatial Microsimulation
    Sample or survey data Target or constraining data

    View Slide

  4. Spatial Microsimulation
    Target or constraining data
    Sample or survey data

    View Slide

  5. Creating a baseline population (spine)
    2011 Census
    Full enumeration
    Spatially detailed
    Understanding Society survey data
    Representative sample
    Detailed attributes
    No spatial detail
    Mid-Year estimate and other constraint
    data
    Keeps constraints current

    View Slide

  6. Simulated
    Annealing
    algorithm

    View Slide

  7. https://bit.ly/3pYmuUs
    https://www.nature.com/articles/s415
    97-022-01124-9

    View Slide

  8. Allows for more spatially detailed analysis
    e.g. Employment rate (working-age population)
    NOMIS (Annual Population Survey) Synthetic population data
    Bolton

    View Slide

  9. The Inclusive Economy

    View Slide

  10. https://bit.ly/3AxkMhT

    View Slide

  11. The inclusive growth (IG)/inclusive economy (IE)
    concept itself is both ill-defined and contested.

    View Slide

  12. SIPHER is…
    concerned with economic
    inclusion rather than inclusive
    growth.
    The relationship between the extent and nature of inclusion on the one
    hand, and health and wellbeing outcomes on the other.

    View Slide

  13. The consortium has developed a set of
    inclusive economy indicators.
    Meaningful to decision makers (capturing
    a recognisable, relevant aspect of
    inclusive economies)
    Number needs to be relatively small,
    adequately capturing the inclusive
    economy concept without being overly
    abundant and complex

    View Slide

  14. Indicators - Economic outcomes
    Sub-domain Indicator decision
    1 Participation in paid employment Percentage of working-age people who are employed
    2 Involuntary exclusion from the labour
    market
    Share of working-age people who are long-term
    unemployed OR inactive due to ill health or disability
    3 Wealth inequality Ratio of house price in most expensive area to least
    expensive area
    4 Earnings inequality Ratio of weekly earnings between 80th and 20th
    percentiles
    5 Poverty Percentage of children living in low income households
    6 Decent pay Proportion of employees paid at or above the Living
    Wage (as defined by the Living Wage Foundation)
    7 Job security/precarity – an aspect of job
    quality
    Share of employees in permanent work

    View Slide

  15. Indicators – Wider Outcomes/Enablers
    Sub-domain Indicator decision
    1 Whether people are gaining the skills and
    qualifications to enable economic
    participation and success
    Percentage of adults aged 20-49 with a Level 2 or
    higher NVQ qualification
    2 Digital connectivity/inclusion Engagement with digital at LSOA level based on
    Internet User Classification (IUC)
    3 Physical connectivity Public transport accessibility measure
    4 Housing affordability Ratio of median house prices to median
    (workplace) earnings
    5 Costs of Living Fuel poor households
    6 Inclusion in decision-making Voter turnout in local elections

    View Slide

  16. Data
    • Understanding Society – Wave 11 (aggregated to LSOA level via
    synthetic population)
    • Physical connectivity – Accessibility score from DFT (1-6) for each
    LSOA
    • Housing affordability - median LSOA house price data from ONS
    • All continuous variables
    • Variables scaled (subtract mean, divide by standard deviation)
    • Just Greater Manchester in first iteration

    View Slide

  17. The aim of the K-means algorithm is to divide M
    points in N dimensions into K clusters so that the
    within-cluster sum of squares is minimized.
    Hartigan and Wong (1979)
    The K-means algorithm identifies k number
    of centroids, and then allocates every data
    point to the nearest cluster, while keeping
    the centroids as small as possible.
    https://towardsdatascience.com/understanding-k-means-
    clustering-in-machine-learning-6a6e67336aa1

    View Slide

  18. View Slide

  19. View Slide

  20. View Slide

  21. View Slide

  22. More exclusion from labour market
    Below average employment
    More unequal
    earnings
    Less secure employment
    House prices are lower
    relative to earnings
    Low engagement with
    decision making
    C5 Least
    inclusive?

    View Slide

  23. Unequal earnings
    Lower proportion in
    secure employment
    High house prices relative to earnings
    Affluent but not inclusive?

    View Slide

  24. Most inclusive? Average?

    View Slide

  25. Greater Manchester
    Most Inclusive
    Average
    Affluent not inclusive
    Exclusion from Labour Market
    Unequal earnings and
    not secure employment

    View Slide

  26. Greater Manchester
    Most Inclusive
    Average
    Affluent not inclusive
    Exclusion from Labour Market
    Unequal earnings and
    not secure employment
    Healthy life expectancy

    View Slide

  27. Next steps
    •Validate!
    (consult and correlate)
    •Incorporate additional variables
    (those identified, plus others?)
    •Extend to whole of Great Britain
    •Examine relationship with health outcomes

    View Slide

  28. SIPHER is funded by:
    This work was supported by the UK Prevention Research Partnership (MR/S037578/1), which is funded by the British
    Heart Foundation, Cancer Research UK, Chief Scientist Office of the Scottish Government Health and Social Care
    Directorates, Engineering and Physical Sciences Research Council, Economic and Social Research Council, Health and
    Social Care Research and Development Division (Welsh Government), Medical Research Council, National Institute
    for Health Research, Natural Environment Research Council, Public Health Agency (Northern Ireland), The Health
    Foundation and Wellcome.

    View Slide

  29. Utilising Synthetic Microdata to
    assess the spatial distribution of
    the inclusive economy
    Nik Lomax1, Ceri Hughes2, Ruth Lupton2
    1School of Geography | University of Leeds | Alan Turing Institute
    [email protected] |Twitter @NikLomax
    2University of Manchester
    BSPS| Winchester| 5 September 2022

    View Slide