Upgrade to Pro — share decks privately, control downloads, hide ads and more …

Estimation of EU Referendum results for Westminster Parliamentary Constituencies

Nik Lomax
September 05, 2018

Estimation of EU Referendum results for Westminster Parliamentary Constituencies

This is a presentation for the elections & electoral geographies session of the annual BSPS Conference 2018, held in Winchester.

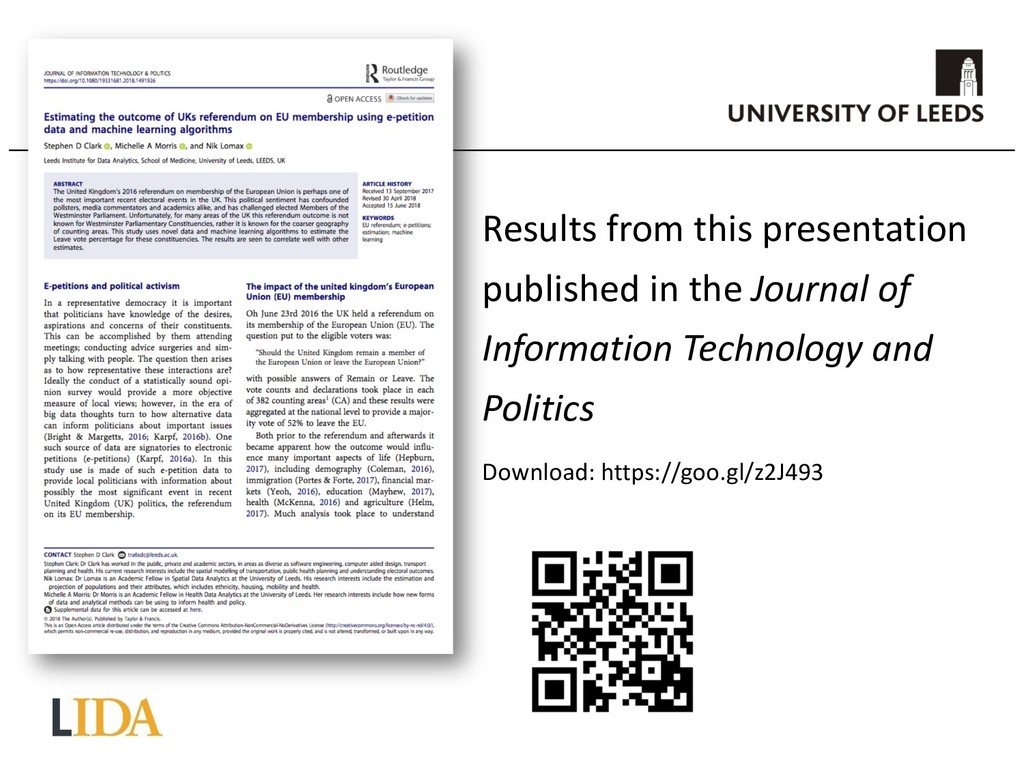
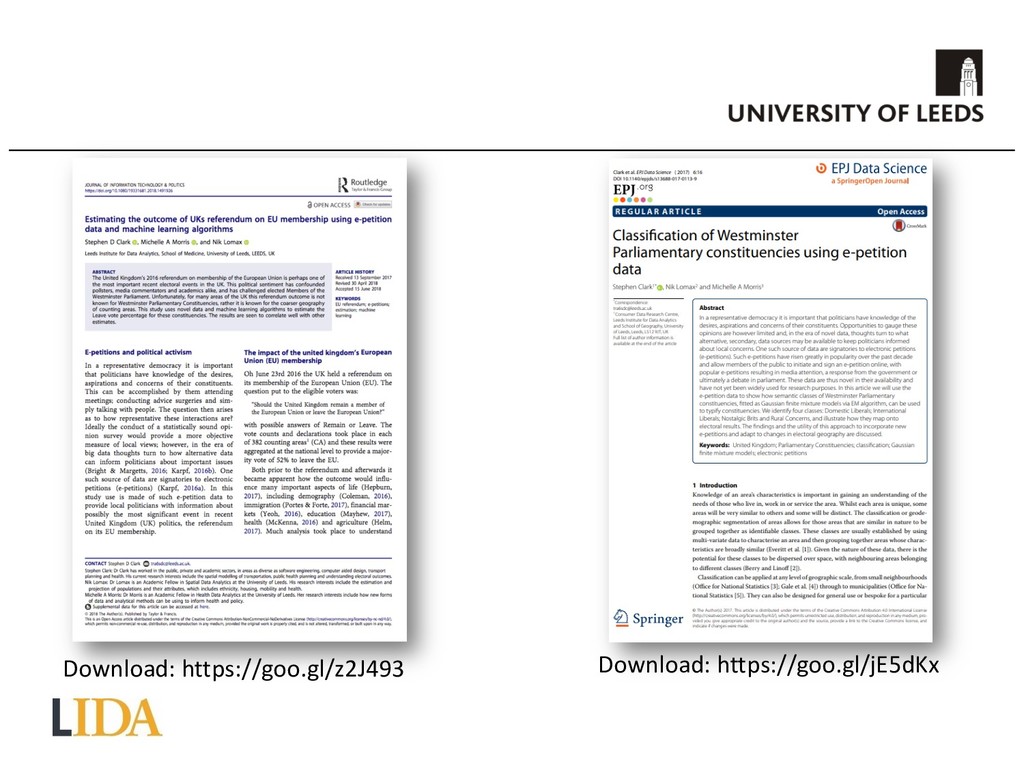
It presents results published in the Journal of Information Technology & Politics.
https://www.tandfonline.com/doi/full/10.1080/19331681.2018.1491926

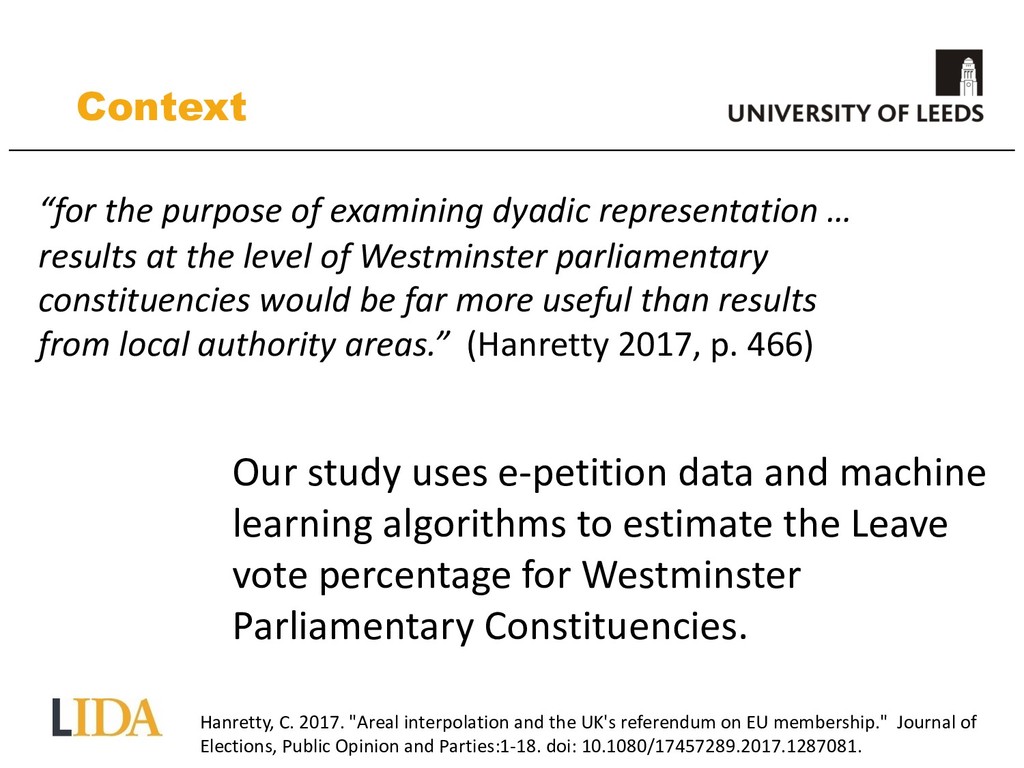
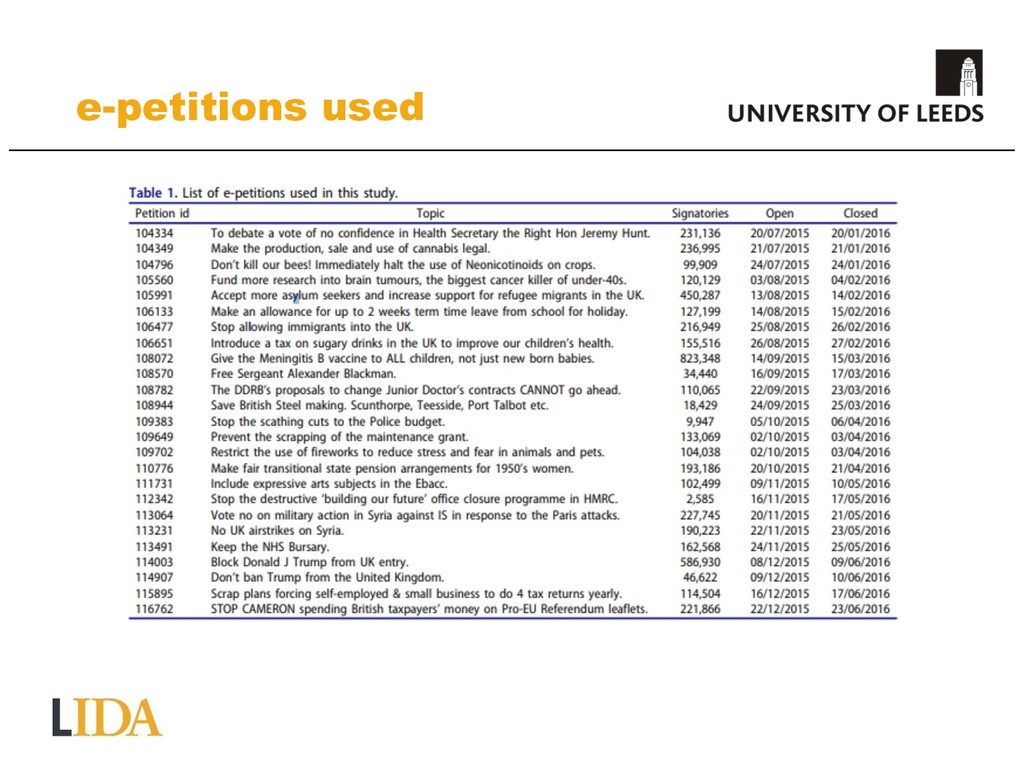
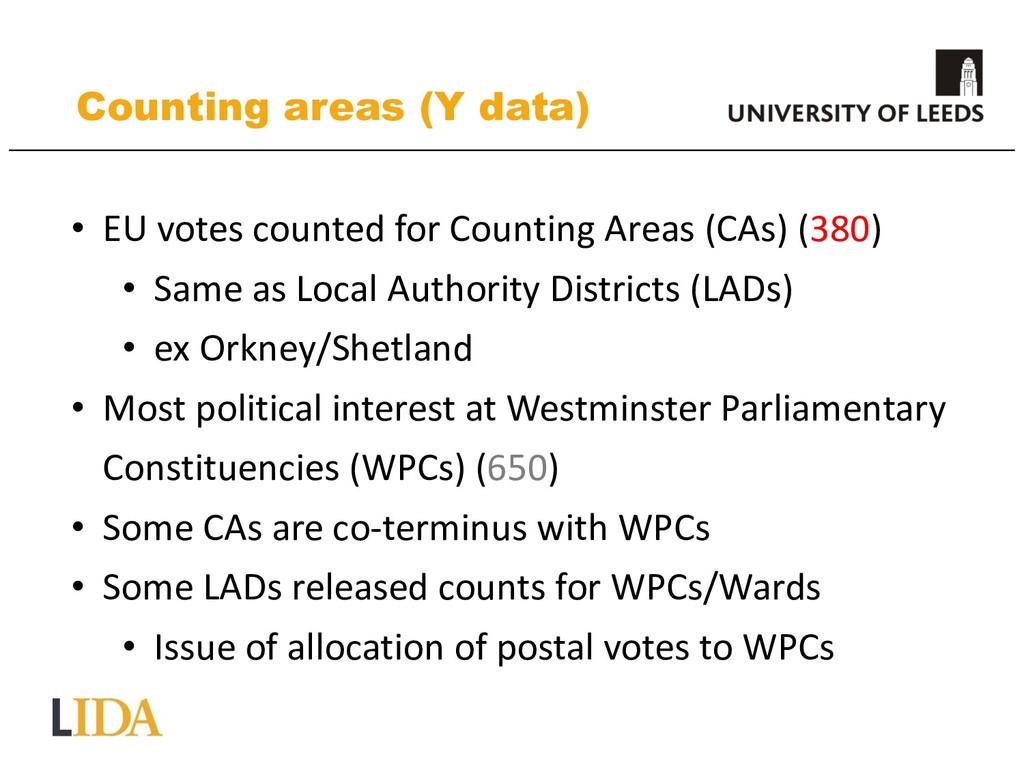
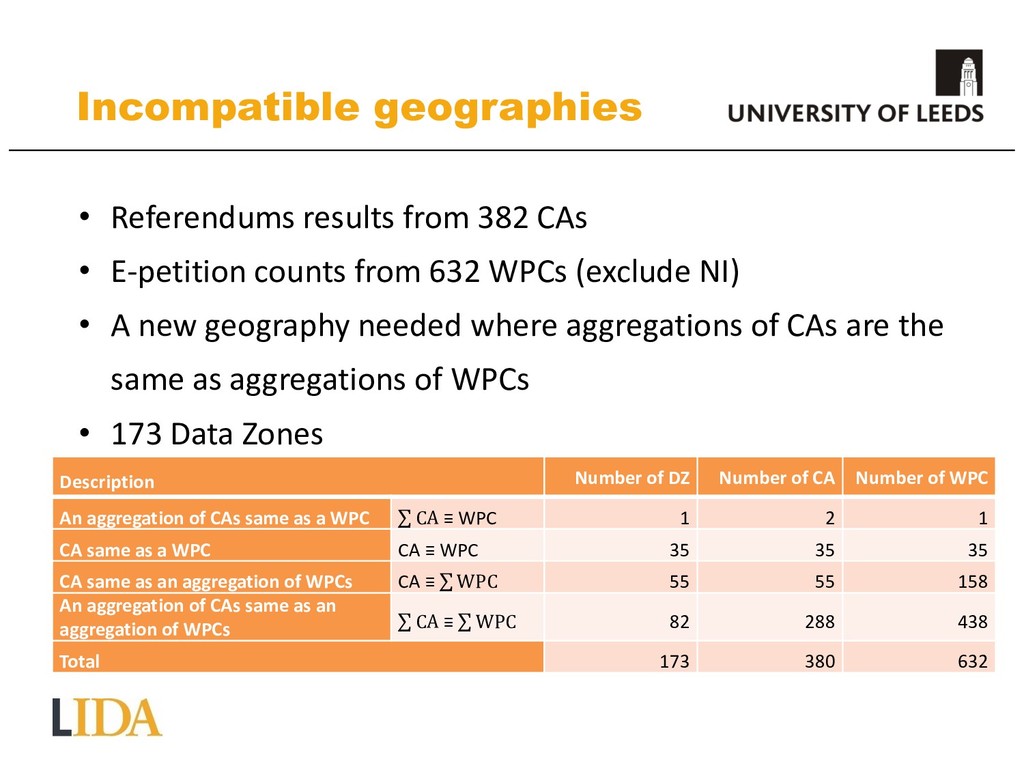
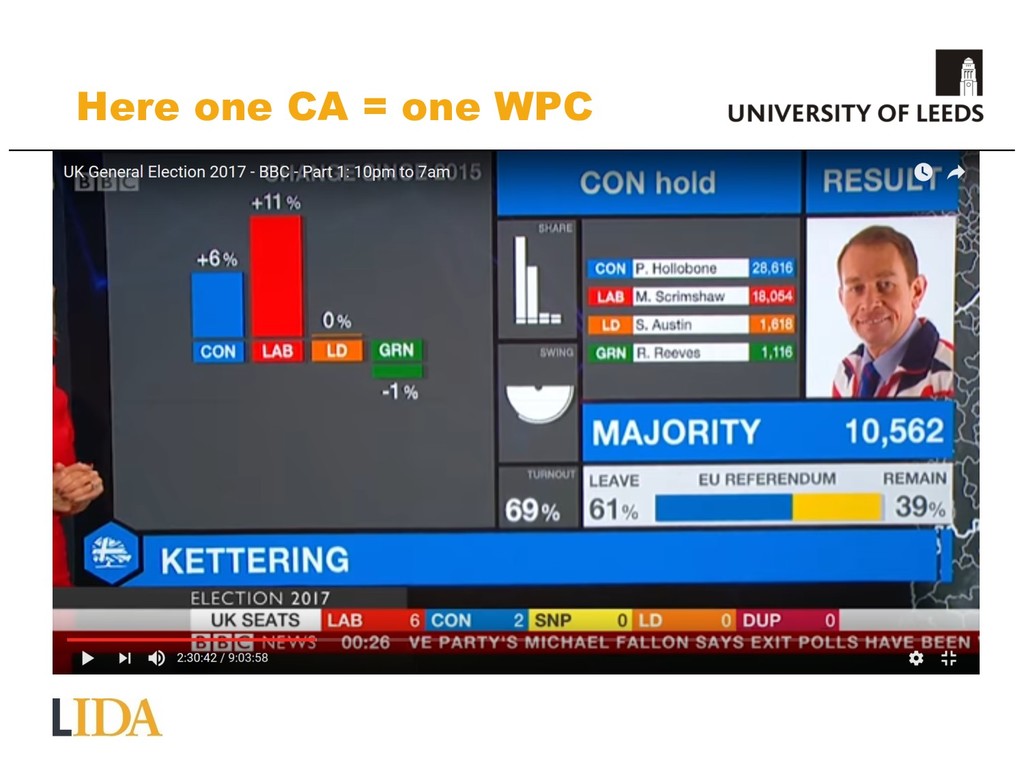
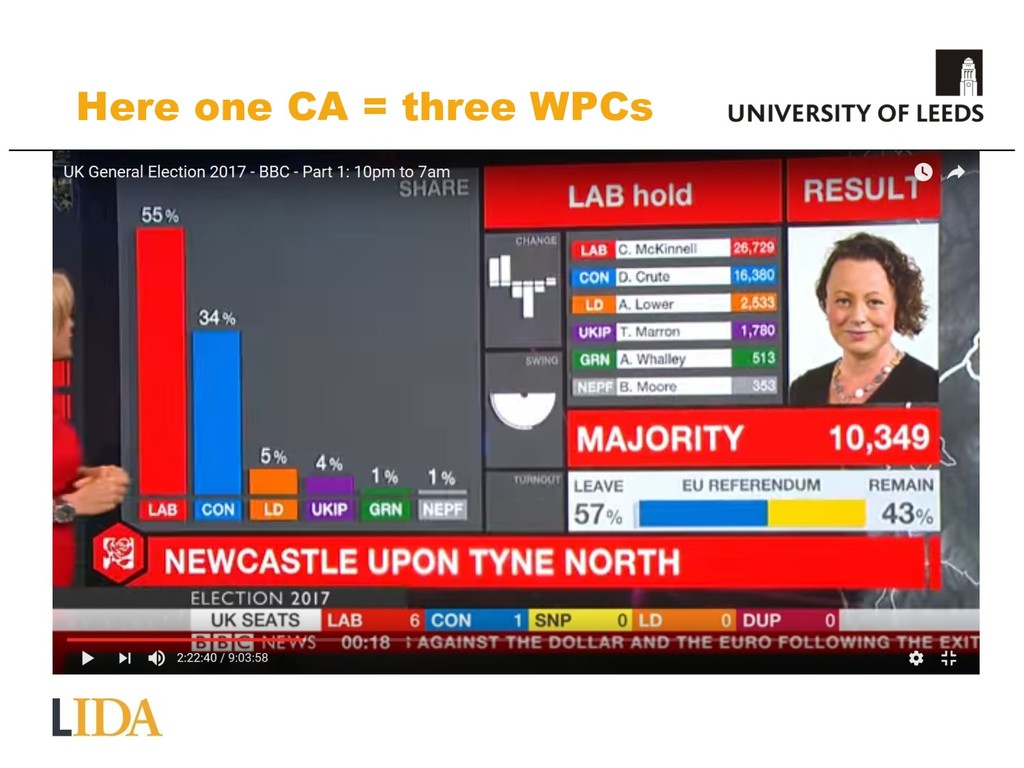
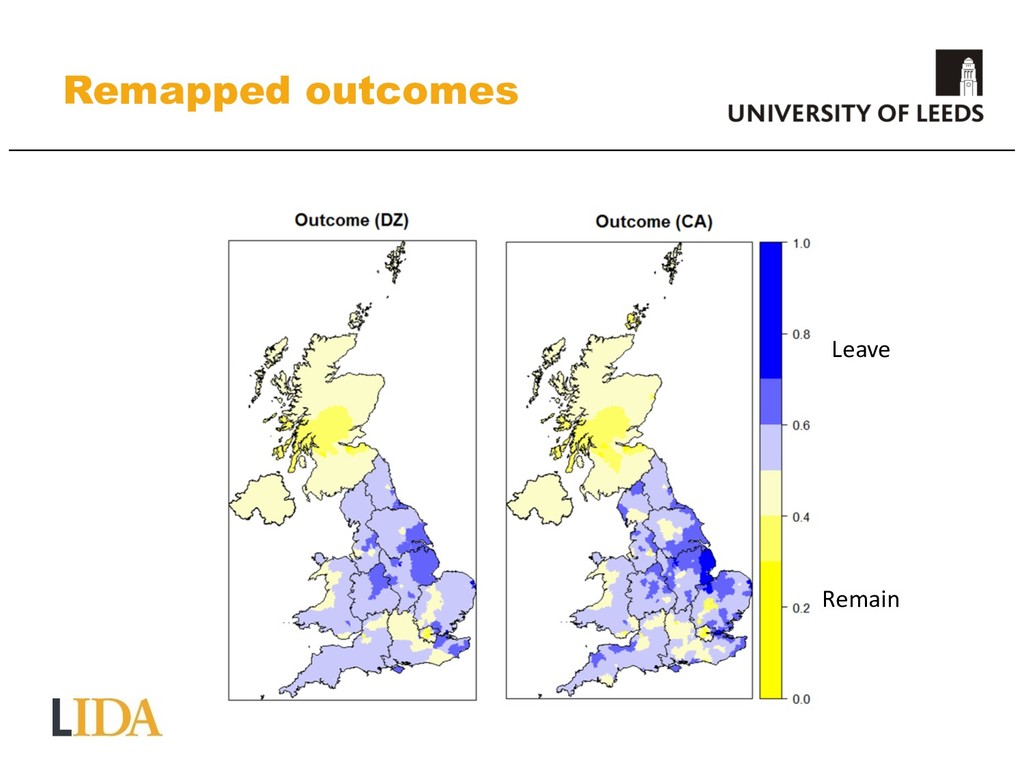
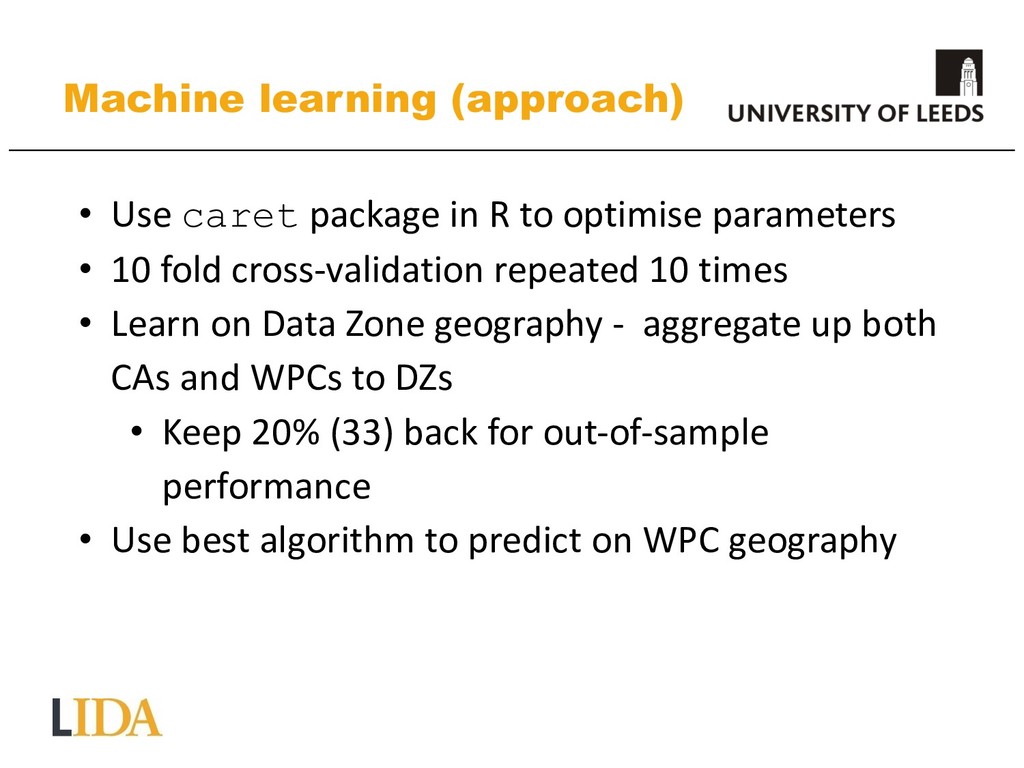
This study uses novel e-petition data and machine learning algorithms to estimate the Leave vote percentage for Westminster Parliamentary Constituencies.

Nik Lomax

September 05, 2018
Tweet

More Decks by Nik Lomax

Other Decks in Research

Transcript

  1. Nik Lomax
    Stephen Clark
    Michelle Morris
    BSPS annual conference | Winchester | 12 September 2018
    Estimation of EU Referendum
    results for Westminster
    Parliamentary Constituencies

    View Slide

  2. Outline
    • Context
    • E-petitions (X data)
    • Counting of the EU referendum votes (Y data)
    • A new geography
    • Machine learning
    • Comparison with other estimates

    View Slide

  3. Context
    • On 23 June 2016, 52% voted in favour of leaving the EU
    (turnout 72% of registered voters)
    • Results published for ‘Counting Areas’
    • But not for Westminster
    Parliamentary Constituencies
    (WPCs)
    • WPCs are geography that
    elected members of
    Parliament are held to
    account by their constituents.

    View Slide

  4. Our study uses e-petition data and machine
    learning algorithms to estimate the Leave
    vote percentage for Westminster
    Parliamentary Constituencies.
    Context
    “for the purpose of examining dyadic representation …
    results at the level of Westminster parliamentary
    constituencies would be far more useful than results
    from local authority areas.” (Hanretty 2017, p. 466)
    Hanretty, C. 2017. "Areal interpolation and the UK's referendum on EU membership." Journal of
    Elections, Public Opinion and Parties:1-18. doi: 10.1080/17457289.2017.1287081.

    View Slide

  5. e-petitions (X data)
    • Hosted by UK Parliament
    • Create or sign a petition that asks for a
    change to the law or to government policy.
    • Use e-petitions between May 2015 to
    April 2016 (25 petitions)
    • JSON files of raw counts in WPCs
    • Size of WPC electorate varies from 22k to
    110k
    • Normalise by dividing by the size of the
    2015 electorate

    View Slide

  6. e-petitions used

    View Slide

  7. e-petitions: geography

    View Slide

  8. e-petitions: a rich source of
    online data
    Download: https://goo.gl/jE5dKx

    View Slide

  9. Results from this presentation
    published in the Journal of
    Information Technology and
    Politics
    Download: https://goo.gl/z2J493

    View Slide

  10. Counting areas (Y data)
    • EU votes counted for Counting Areas (CAs) (380)
    • Same as Local Authority Districts (LADs)
    • ex Orkney/Shetland
    • Most political interest at Westminster Parliamentary
    Constituencies (WPCs) (650)
    • Some CAs are co-terminus with WPCs
    • Some LADs released counts for WPCs/Wards
    • Issue of allocation of postal votes to WPCs

    View Slide

  11. Incompatible geographies
    • Referendums results from 382 CAs
    • E-petition counts from 632 WPCs (exclude NI)
    • A new geography needed where aggregations of CAs are the
    same as aggregations of WPCs
    • 173 Data Zones
    Description Number of DZ Number of CA Number of WPC
    An aggregation of CAs same as a WPC ∑ CA ≡ WPC 1 2 1
    CA same as a WPC CA ≡ WPC 35 35 35
    CA same as an aggregation of WPCs CA ≡ ∑ WPC 55 55 158
    An aggregation of CAs same as an
    aggregation of WPCs ∑ CA ≡ ∑ WPC 82 288 438
    Total 173 380 632

    View Slide

  12. Here one CA = one WPC

    View Slide

  13. Here one CA = one WPC

    View Slide

  14. Here one CA = three WPCs

    View Slide

  15. Here one CA = three WPCs

    View Slide

  16. Here two CA = two WPCs

    View Slide

  17. Here two CA = two WPCs

    View Slide

  18. Remapped outcomes
    Remain
    Leave

    View Slide

  19. Machine learning algorithms
    • Lazy Learners
    • K nearest neighbours
    • Self-organising maps
    • Characterised by capturing learning through a
    set of similarity relationships in
    multidimensional ‘space’

    View Slide

  20. Machine learning algorithms
    • Divide and Conquer
    • Random forests
    • Gradient Boost Machines
    • Largely tree-based algorithms, consisting of nodes
    which act as routing paths leading to a leaf (with if-
    then conditions)

    View Slide

  21. Machine learning algorithms
    • Regression
    • Support Vector Machines
    • Artificial Neural Networks
    • MARS (BagEarth)
    • Designed to capture non-linear relationships

    View Slide

  22. Machine learning algorithms
    • Hybrid
    • Cubist
    • Combination of a tradition decision tree
    and regression equations
    • At the leaf there is an estimated
    regression equation rather than a
    constant.

    View Slide

  23. Machine learning (approach)
    • Use caret package in R to optimise parameters
    • 10 fold cross-validation repeated 10 times
    • Learn on Data Zone geography - aggregate up both
    CAs and WPCs to DZs
    • Keep 20% (33) back for out-of-sample
    performance
    • Use best algorithm to predict on WPC geography

    View Slide

  24. Machine learning
    (performance)
    Algorithm RMSE R2
    Cubist 0.0224 0.971
    Nnet 0.0270 0.959
    SVM 0.0279 0.955
    BagEarth 0.0296 0.949
    Ranger 0.0378 0.945
    GLM 0.0307 0.944
    GBM 0.0382 0.926
    kNN 0.0547 0.885
    SOM 0.0642 0.759

    View Slide

  25. Hanretty, C. 2017. "Areal interpolation and the UK's referendum on EU
    membership." Journal of Elections, Public Opinion and Parties:1-18. doi:
    10.1080/17457289.2017.1287081.
    Comparison against other
    studies
    • Hanretty (2017) uses areal interpolation
    • Scaled Poisson regression incorporates demographic
    information from lower level geographies.
    • Estimated 400 WPCs voted Leave whilst 232 voted
    Remain
    • Demonstrates geographic distribution of signatures to a
    petition for a second referendum strongly associated
    with how constituencies voted in the actual referendum.

    View Slide

  26. Comparison against other
    studies
    • Marriott (2017) uses a look-up table of WPCs to CAs and
    then a method to re-allocate votes to a WPC based on a
    ‘classification’ of each WPC.
    • Estimated a Leave vote for 403 WPCs (later updated to
    400)
    Marriott, J. 2017 "EU Referendum 2016 #1 – How and why did Leave win
    and what does it mean for UK politics? (a 4-part special)." https://marriott-
    stats.com/nigels-blog/brexit-why-leave-won/.

    View Slide

  27. Results (WPC)

    View Slide

  28. Results (BREXIT)
    • Hard Remain
    = 201
    • Hard Leave
    = 372
    • Soft Remain
    = 29
    • Soft Leave
    = 30

    View Slide

  29. Discussion
    • WPCs are the democratic geography – MPs elected
    and represent their constituents
    • Largely confirms Hanretty’s and Marriot’s estimates
    • Signatories ≠ Electors
    • Method can be applied in different contexts
    • For example – plans to reduce the number of
    WPCs from 650 to 600

    View Slide

  30. Conclusion
    • e-petition data is an informative and versatile
    source of information that gauges the political
    sentiment in a location
    • This sentiment can be used to infer other
    outcomes
    • Scope for political scientists to apply machine
    learning algorithms to gain confirmatory or
    alternative insight.

    View Slide

  31. Nik Lomax
    Stephen Clark
    Michelle Morris
    BSPS annual conference | Winchester | 12 September 2018
    Estimation of EU Referendum
    results for Westminster
    Parliamentary Constituencies

    View Slide

  32. Download: https://goo.gl/z2J493 Download: https://goo.gl/jE5dKx

    View Slide