Upgrade to Pro — share decks privately, control downloads, hide ads and more …

Use of On-Line Data to Provide Rental Housing Market Mass Appraisals for England

Nik Lomax
August 31, 2018

Use of On-Line Data to Provide Rental Housing Market Mass Appraisals for England

This is a presentation I gave at the 58th European Regional Science Association Congress in Cork.

Nik Lomax

August 31, 2018
Tweet

More Decks by Nik Lomax

Other Decks in Research

Transcript

  1. Use of On-Line Data to
    Provide Rental Housing
    Market Mass Appraisals for
    England
    Nik Lomax and Stephen Clark
    University of Leeds
    58th ERSA Congress | Cork | 31 August 2018

    View Slide

  2. Introduction
    • Mass appraisal of house sales market well
    established
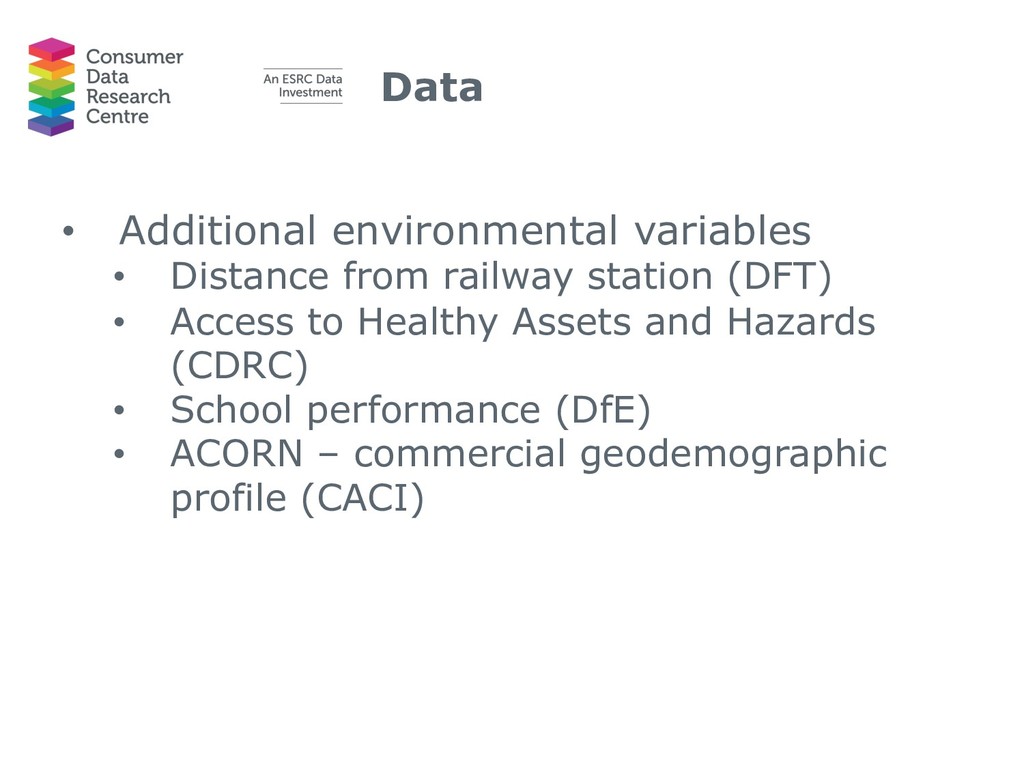
    • Needed for levying of local property taxes
    • Well established field in the literature
    • Broad approaches to appraisals:
    • (hedonic) valuation models
    • cost models (based on the materials,
    design and labour used)
    • use of comparable sales data
    • land value estimations

    View Slide

  3. Introduction
    • Far less emphasis on mass market appraisal
    in rental market
    • But necessary to place a rental value on a
    property that reflects current market
    conditions
    • Has received little academic study
    • Primarily due to lack of available data on
    such transactions

    View Slide

  4. Introduction
    • Banzhaf and Farooque (2013) rental values
    correlate with access to public goods and income
    levels in Los Angeles
    • Löchl (2010) accessibility and travel time most
    important for explaining rents in Zurich
    • Fuss and Koller (2016) neighbouring property price
    is most important using hedonic models for Zurich
    • Baron and Kaplan (2010) impact of
    ‘studentification’ on rent is negative in Haifa
    • Prunty (2016) difference in hedonic features in
    comparative study of New York and California
    • McCord et al (2014) use GWR, find a high level of
    segmentation across localised pockets of the Belfast
    rental market

    View Slide

  5. Rationale and contribution
    • A lack of insight hampers commercial
    organisations and local and national
    governments in understanding rental
    market.
    • We offer a practical guide for property
    professionals and academics wishing to
    undertake such appraisals and looking for
    guidance on the best methods to use.
    • We provide insight in to the property
    characteristics which most influence rental
    listing price.

    View Slide

  6. Data
    • Rental data from online property search
    engine Zoopla, 
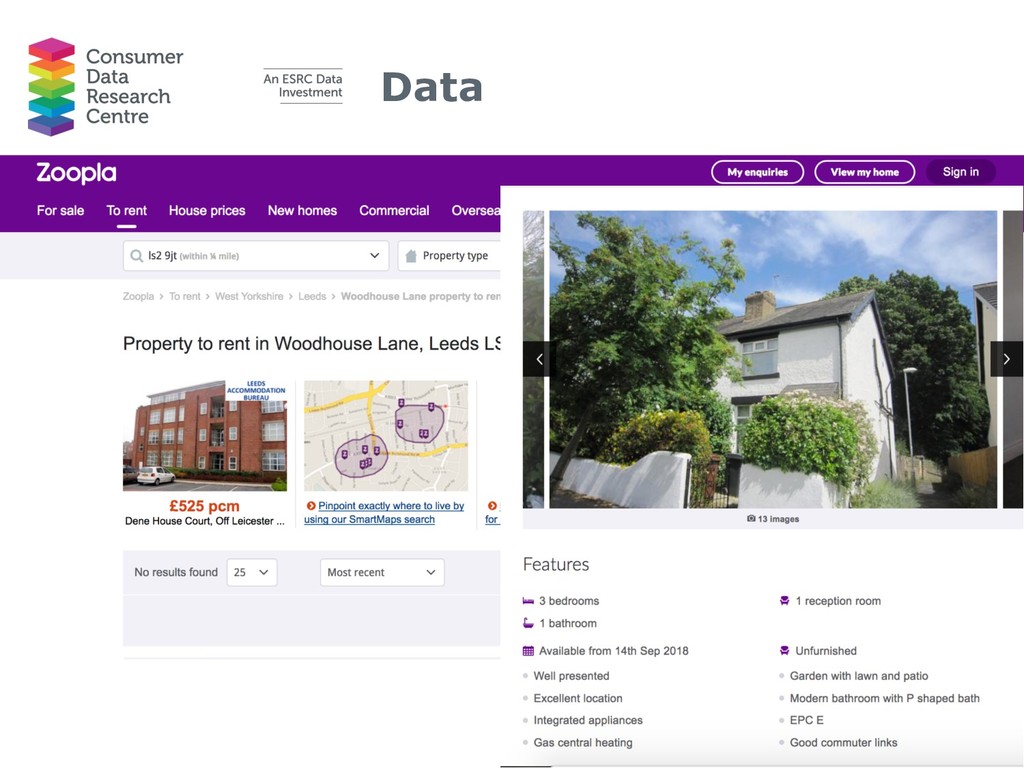
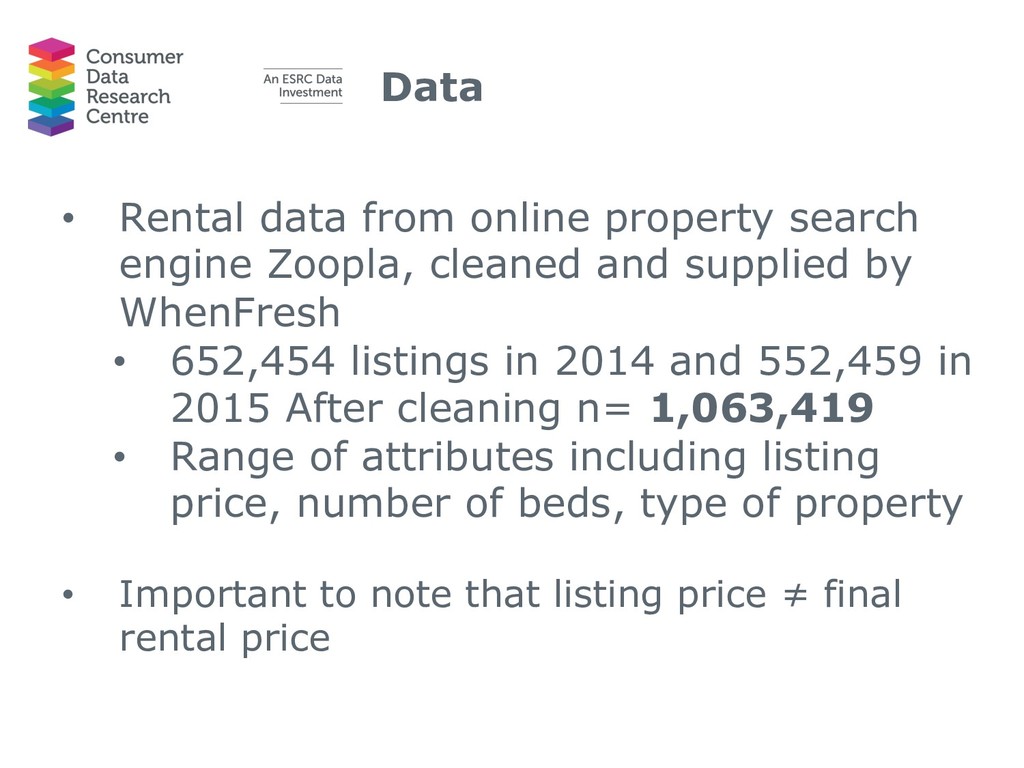
cleaned and supplied by
    When Fresh
    • 652,454 listings in 2014 and 552,459 in
    2015 After cleaning n= 1,063,419
    • Range of attributes including listing
    price, number of beds, type of property
    • Important to note that listing price ≠ final
    rental price

    View Slide

  7. Data
    • Rental data from online property search
    engine Zoopla, cleaned and supplied by
    WhenFresh
    • 652,454 listings in 2014 and 552,459 in
    2015 After cleaning n= 1,063,419
    • Range of attributes including listing
    price, number of beds, type of property
    • Important to note that listing price ≠ final
    rental price

    View Slide

  8. Data
    • Additional environmental variables
    • Distance from railway station (DFT)
    • Access to Healthy Assets and Hazards
    (CDRC)
    • School performance (DfE)
    • ACORN – commercial geodemographic
    profile (CACI)

    View Slide

  9. Methods
    1. Quassi Poisson generalised linear model
    (GLM)
    2. Machine 
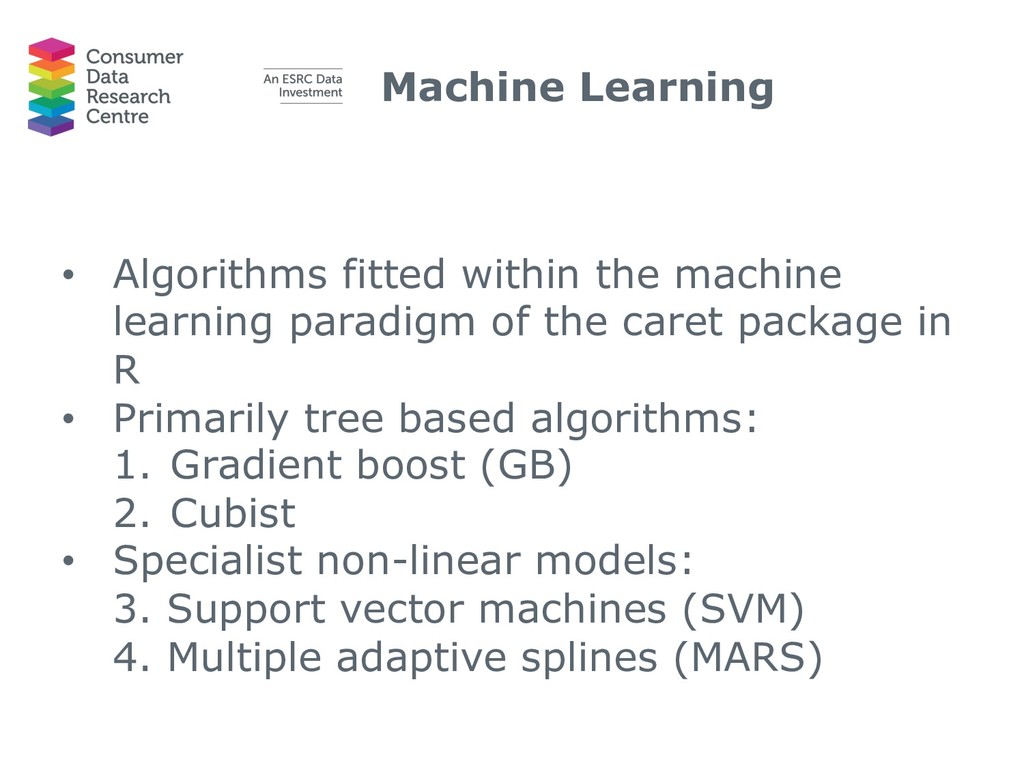
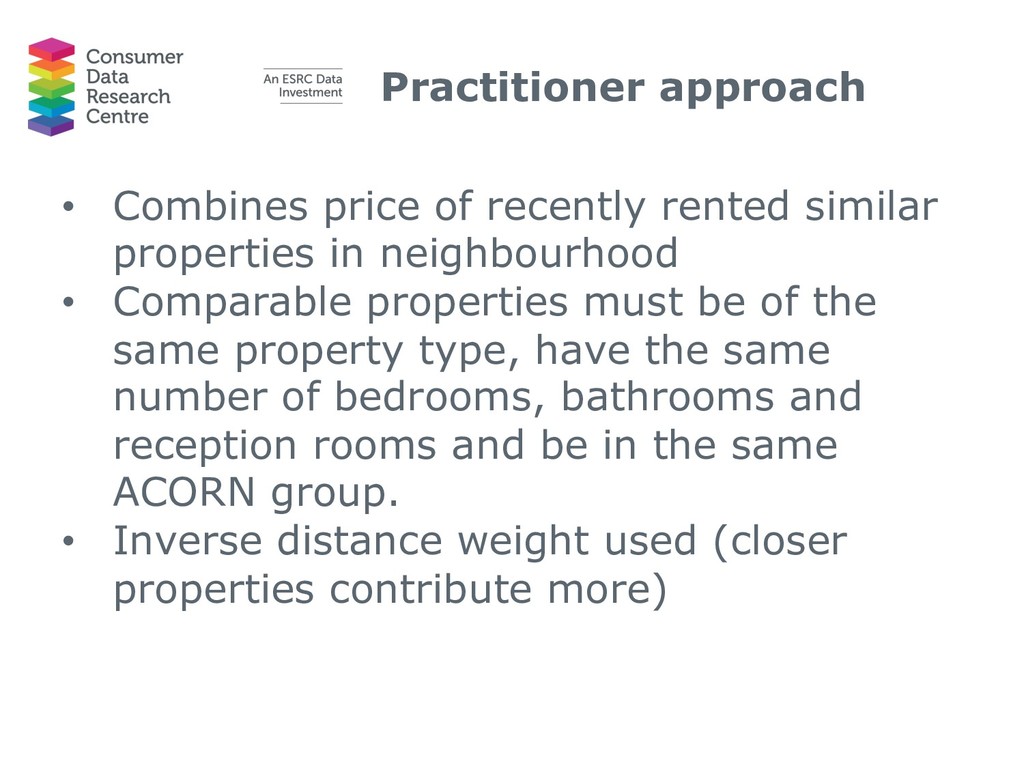
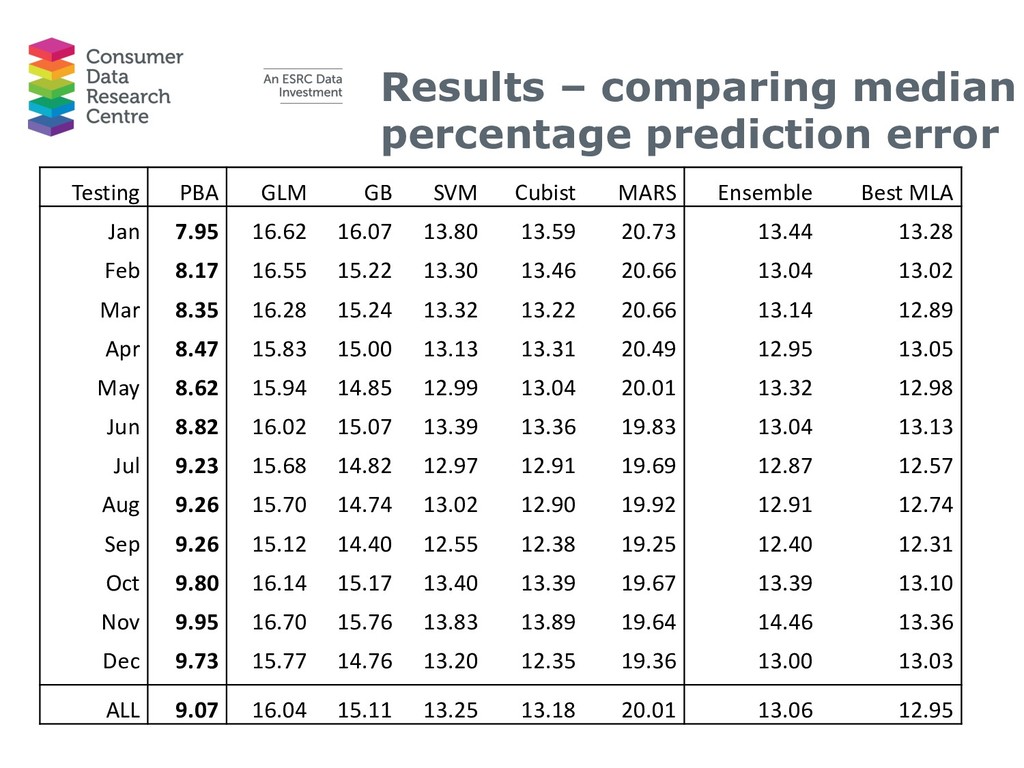
learning algorithms
    • Tree based: gradient boost (GB) and Cubist
    • Specialist non-linear models: support
    vector machines (SVM) and multiple
    adaptive splines (MARS)
    3. Practitioner based approach (PBA)
    • rental price is a summary of recently
    rented similar properties in neighbourhood

    View Slide

  10. Experimental procedure
    • All methods are applied in a consistent
    manner akin to a moving window
    • Information from the previous 12 months
    used predict the out-of-sample rental
    prices
    2014 2015
    Jan Feb Mar Apr May Jun Jul Aug Sept Oct Nov Dec Jan Feb Mar Apr May Jun Jul Aug Sept Oct Nov Dec

    View Slide

  11. GLM Results
    • quassi Poisson generalised linear model
    (GLM) used 
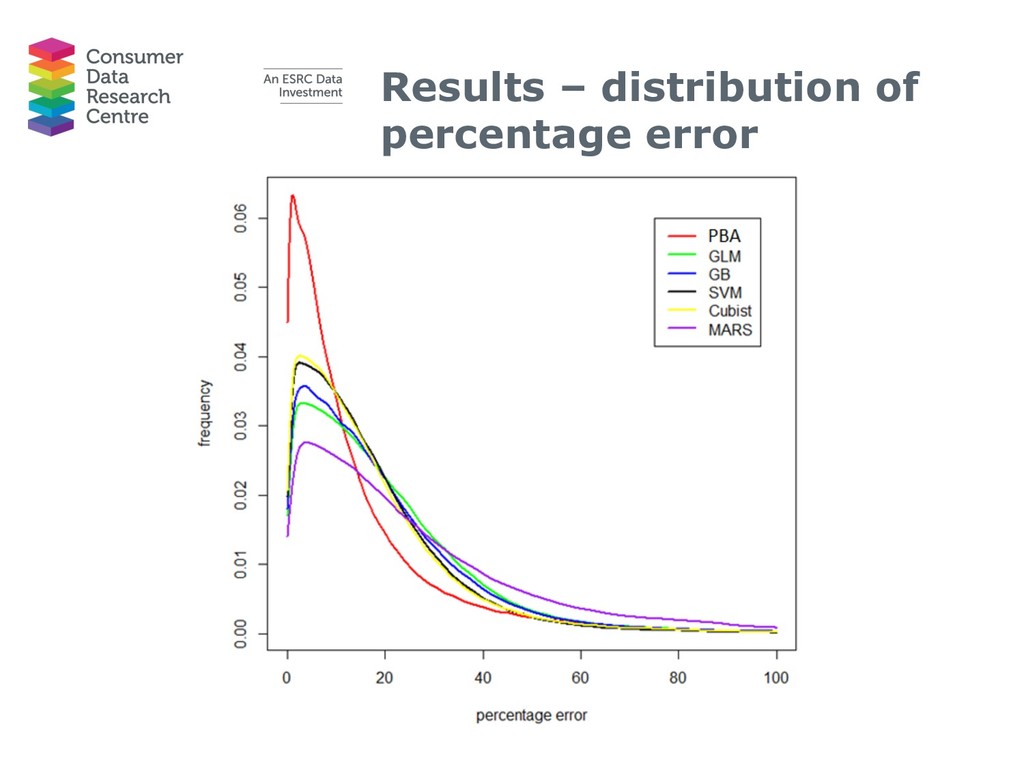
because:
    • skewed distribution of the rental price
    • possible over-dispersion
    • Essential step prior to Machine Learning –
    Does the data capture dynamics of the
    housing market in a sensible manner?
    • 63 variables
    • Squared correlation between observed and
    in-sample predicted r2 = 0.738 on log of
    rental price
    • r2 drops to 0.54 on original scale

    View Slide

  12. GLM Results
    -0.05
    -0.04
    -0.03
    -0.02
    -0.01
    0
    0.01
    0.02
    0.03
    Bungalow Detached Semi-detached Terraced Unknown
    Property type
    Attribute N/median estimate std error t
    Intercept 487253 6.451 0.0067 957.7 ***
    Flat 212275
    Bungalow 11617 0.0073 0.0059 1.2
    Detached 31996 0.0192 0.0037 5.2 ***
    Semi-
    detached
    54410 -0.0463 0.0032 -14.5 ***
    Terraced 111087 -0.0185 0.0025 -7.4 ***
    Unknown 65868 0.0169 0.0026 6.4 ***

    View Slide

  13. -0.2
    0
    0.2
    0.4
    0.6
    0.8
    1
    1.2
    1.4
    2 Bedrooms 3 Bedrooms 4 Bedrooms 5 Bedrooms 6 and more
    Bedrooms
    Unknown
    Number of bedrooms
    Attribute N/median estimate std error t
    Intercept 487253 6.451 0.0067 957.7 ***
    1 Bedroom 94379
    2 Bedrooms 192236 0.2772 0.0024 116.8 ***
    3 Bedrooms 123546 0.5157 0.0028 186.7 ***
    4 Bedrooms 41505 0.7607 0.0033 228.6 ***
    5 Bedrooms 12558 1.008 0.0043 235.7 ***
    6 and more
    Bedrooms
    7097 1.265 0.0051 248.3 ***
    Unknown 15932 -0.0881 0.005 -17.7 ***
    GLM Results

    View Slide

  14. 0
    0.1
    0.2
    0.3
    0.4
    0.5
    0.6
    0.7
    2 Bathrooms 3 Bathrooms 4 Bathrooms 5 and more
    Bathrooms
    Unknown
    Number of bathrooms
    Attribute N/median estimate std error t
    Intercept 487253 6.451 0.0067 957.7 ***
    1 Bathroom 194157
    2
    Bathrooms
    45440 0.1314 0.0026 50.8 ***
    3
    Bathrooms
    6767 0.3343 0.0047 71.2 ***
    4
    Bathrooms
    1150 0.5347 0.0085 63.3 ***
    5 and more
    Bathrooms
    622 0.6633 0.0107 62 ***
    Unknown 239117 0.1169 0.0024 48.2 ***
    GLM Results

    View Slide

  15. -0.1
    -0.05
    0
    0.05
    0.1
    0.15
    0.2
    0.25
    0.3
    0.35
    0.4
    2 Reception
    rooms
    3 Reception
    rooms
    4 Reception
    rooms
    5 and more
    Reception rooms
    Unknown
    Number of reception rooms
    Attribute N/median estimate std error t
    Intercept 487253 6.451 0.0067 957.7 ***
    1 Reception
    room
    159999
    2 Reception
    rooms
    41912 0.002 0.003 0.7
    3 Reception
    rooms
    4921 0.0681 0.006 11.4 ***
    4 Reception
    rooms
    723 0.2235 0.0113 19.8 ***
    5 and more
    Reception
    rooms
    191 0.3379 0.0189 17.9 ***
    Unknown 279507 -0.0333 0.0024 -13.9 ***
    GLM Results

    View Slide

  16. -0.03
    -0.02
    -0.01
    0
    0.01
    0.02
    0.03
    February
    M
    arch
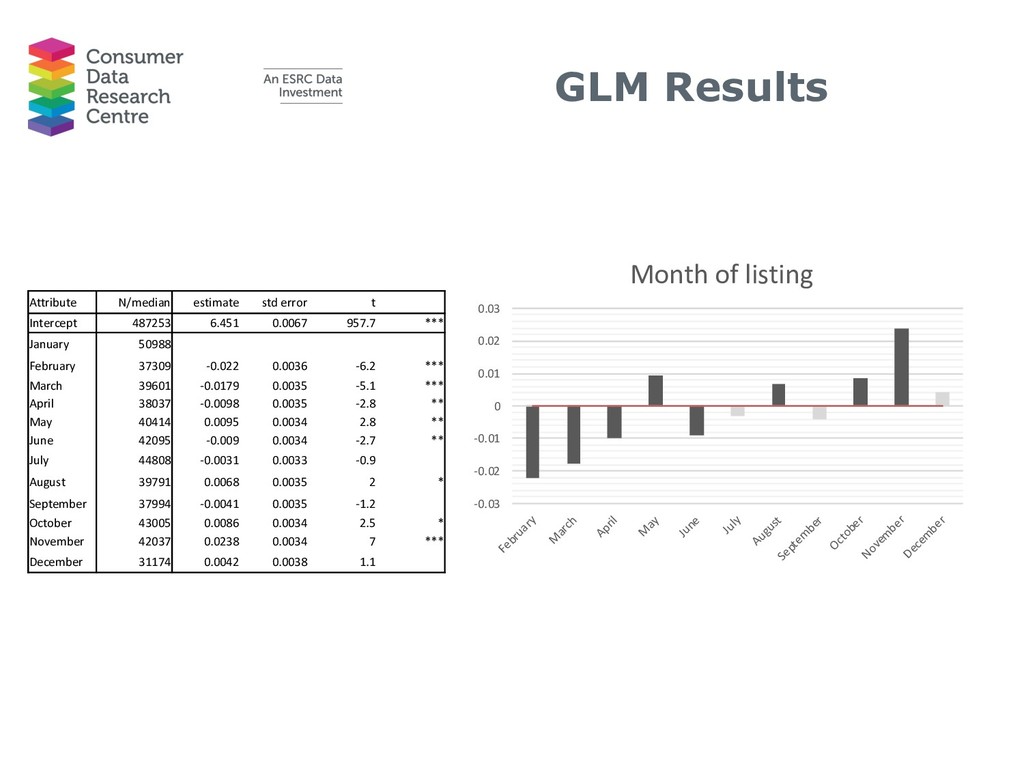
    April
    M
    ay
    June
    July
    August
    Septem
    ber
    October
    Novem
    ber
    Decem
    ber
    Month of listing
    Attribute N/median estimate std error t
    Intercept 487253 6.451 0.0067 957.7 ***
    January 50988
    February 37309 -0.022 0.0036 -6.2 ***
    March 39601 -0.0179 0.0035 -5.1 ***
    April 38037 -0.0098 0.0035 -2.8 **
    May 40414 0.0095 0.0034 2.8 **
    June 42095 -0.009 0.0034 -2.7 **
    July 44808 -0.0031 0.0033 -0.9
    August 39791 0.0068 0.0035 2 *
    September 37994 -0.0041 0.0035 -1.2
    October 43005 0.0086 0.0034 2.5 *
    November 42037 0.0238 0.0034 7 ***
    December 31174 0.0042 0.0038 1.1
    GLM Results

    View Slide

  17. -0.1
    -0.08
    -0.06
    -0.04
    -0.02
    0
    0.02
    0.04
    5 to 10 11 to 20 21 to 60 61 and more Unknown
    Webpage visits per day
    Attribute N/median estimate std error t
    Intercept 487253 6.451 0.0067 957.7 ***
    Up to 4 24094
    5 to 10 14610 0.0244 0.0055 4.4 ***
    11 to 20 23114 -0.0199 0.005 -3.9 ***
    21 to 60 39969 -0.0469 0.0046 -10.3 ***
    61 and more 29423 -0.0754 0.005 -15.2 ***
    Unknown 356043 0.023 0.0037 6.2 ***
    GLM Results

    View Slide

  18. -0.45
    -0.4
    -0.35
    -0.3
    -0.25
    -0.2
    -0.15
    -0.1
    -0.05
    0
    Rising
    prosperity
    Comfortable
    communities
    Financially
    stretched
    Urban
    adversity
    Not private
    households
    ACORN not
    known
    Acorn classification
    Attribute N/median estimate std error t
    Intercept 487253 6.451 0.0067 957.7 ***
    Affluent
    achievers
    60017
    Rising
    prosperity
    136624 -0.1961 0.0026 -74.5 ***
    Comfortable
    communities
    98779 -0.2798 0.0028 -99.7 ***
    Financially
    stretched
    92146 -0.3463 0.0031 -112.9 ***
    Urban
    adversity
    96472 -0.4212 0.0031 -134.3 ***
    Not private
    households
    3008 -0.0994 0.009 -11.1 ***
    ACORN not
    known
    207 -0.1028 0.0274 -3.8 ***
    GLM Results

    View Slide

  19. -0.35
    -0.3
    -0.25
    -0.2
    -0.15
    -0.1
    -0.05
    0
    Log Distance 
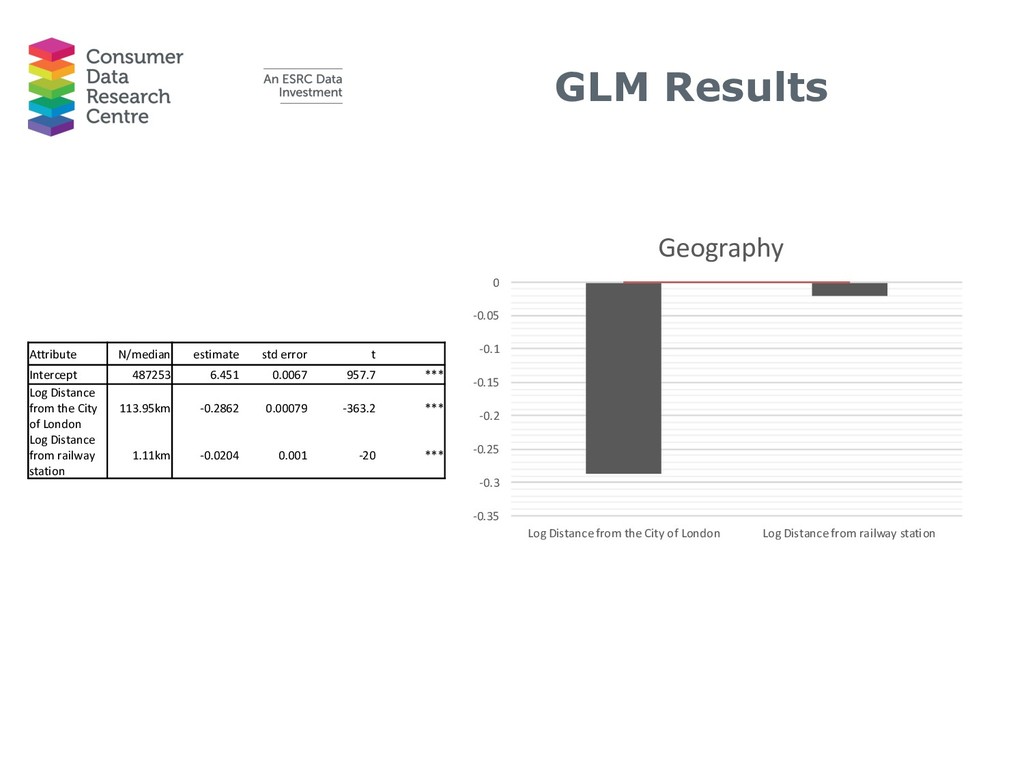
from the City of London Log Distance from railway station
    Geography
    Attribute N/median estimate std error t
    Intercept 487253 6.451 0.0067 957.7 ***
    Log Distance
    from the City
    of London
    113.95km -0.2862 0.00079 -363.2 ***
    Log Distance
    from railway
    station
    1.11km -0.0204 0.001 -20 ***
    GLM Results

    View Slide

  20. -0.0005
    0
    0.0005
    0.001
    0.0015
    0.002
    0.0025
    0.003
    Retail health Access health Environment health
    Environment and amenity
    Attribute N/median estimate std error t
    Intercept 487253 6.451 0.0067 957.7 ***
    Retail health 30.53 0.0025 0.00005 52.2 ***
    Access
    health
    7.21 -0.0001 0.00008 -1.9
    Environmen
    t health
    25.32 0.0004 0.00004 10.5 ***
    GLM Results

    View Slide

  21. Access to Healthy Assets and Hazards (AHAH)
    Daras, Konstantinos; Green, Mark; Davies, Alec; Singleton, Alex; Barr, Benjamin. (2017).

    View Slide

  22. -0.12
    -0.1
    -0.08
    -0.06
    -0.04
    -0.02
    0
    Good Primary school Requires improvement
    Primary school
    Inadequate Primary school
    Primary school Ofsted score
    Attribute N/median estimate std error t
    Intercept 487253 6.451 0.0067 957.7 ***
    Outstanding
    Primary
    91869
    Good
    Primary
    308287 -0.0487 0.0019 -26.2 ***
    Requires
    improveme
    nt Primary
    79841 -0.0614 0.0026 -24 ***
    Inadequate
    Primary
    7256 -0.0972 0.0071 -13.7 ***
    GLM Results

    View Slide

  23. -0.14
    -0.12
    -0.1
    -0.08
    -0.06
    -0.04
    -0.02
    0
    Good Secondary school Requires improvement
    Secondary school
    Inadequate Secondary
    school
    Secondary school Ofsted score
    Attribute N/median estimate std error t
    Intercept 487253 6.451 0.0067 957.7 ***
    Outstanding
    Secondary
    1119014
    Good
    Secondary
    245070 -0.076 0.0018 -43.2 ***
    Requires
    improvement
    Secondary
    96715 -0.1047 0.0024 -44.6 ***
    Inadequate
    Secondary
    26454 -0.1269 0.0044 -28.9 ***
    GLM Results

    View Slide

  24. Machine Learning
    • Algorithms fitted within the machine
    learning paradigm of the caret package in
    R
    • Primarily tree based algorithms:
    1. Gradient boost (GB)
    2. Cubist
    • Specialist non-linear models:
    3. Support vector machines (SVM)
    4. Multiple adaptive splines (MARS)

    View Slide

  25. Practitioner approach
    • Combines price of recently rented similar
    properties in neighbourhood
    • Comparable properties must be of the
    same property type, have the same
    number of bedrooms, bathrooms and
    reception rooms and be in the same
    ACORN group.
    • Inverse distance weight used (closer
    properties contribute more)

    View Slide

  26. Results – comparing r2
    Testing PBA GLM GB SVM Cubist MARS
    Jan 0.55 0.56 0.62 0.56 0.65 0.47
    Feb 0.53 0.55 0.61 0.57 0.64 0.50
    Mar 0.48 0.49 0.52 0.48 0.56 0.43
    Apr 0.52 0.55 0.58 0.55 0.65 0.47
    May 0.41 0.44 0.48 0.44 0.50 0.39
    Jun 0.53 0.59 0.63 0.60 0.67 0.52
    Jul 0.55 0.58 0.66 0.61 0.66 0.53
    Aug 0.51 0.53 0.58 0.56 0.62 0.48
    Sep 0.52 0.57 0.64 0.57 0.68 0.51
    Oct 0.49 0.56 0.59 0.57 0.63 0.49
    Nov 0.52 0.57 0.63 0.54 0.64 0.48
    Dec 0.51 0.56 0.61 0.57 0.66 0.51
    ALL 0.51 0.54 0.59 0.55 0.63 0.48

    View Slide

  27. Results – comparing r2
    Testing PBA GLM GB SVM Cubist MARS Ensemble Best MLA
    Jan 0.55 0.56 0.62 0.56 0.65 0.47 0.67 0.68
    Feb 0.53 0.55 0.61 0.57 0.64 0.50 0.65 0.64
    Mar 0.48 0.49 0.52 0.48 0.56 0.43 0.57 0.58
    Apr 0.52 0.55 0.58 0.55 0.65 0.47 0.65 0.64
    May 0.41 0.44 0.48 0.44 0.50 0.39 0.51 0.52
    Jun 0.53 0.59 0.63 0.60 0.67 0.52 0.68 0.68
    Jul 0.55 0.58 0.66 0.61 0.66 0.53 0.69 0.69
    Aug 0.51 0.53 0.58 0.56 0.62 0.48 0.63 0.62
    Sep 0.52 0.57 0.64 0.57 0.68 0.51 0.69 0.68
    Oct 0.49 0.56 0.59 0.57 0.63 0.49 0.64 0.63
    Nov 0.52 0.57 0.63 0.54 0.64 0.48 0.66 0.66
    Dec 0.51 0.56 0.61 0.57 0.66 0.51 0.67 0.60
    ALL 0.51 0.54 0.59 0.55 0.63 0.48 0.64 0.64

    View Slide

  28. Results – comparing median
    percentage prediction error
    Testing PBA GLM GB SVM Cubist MARS Ensemble Best MLA
    Jan 7.95 16.62 16.07 13.80 13.59 20.73 13.44 13.28
    Feb 8.17 16.55 15.22 13.30 13.46 20.66 13.04 13.02
    Mar 8.35 16.28 15.24 13.32 13.22 20.66 13.14 12.89
    Apr 8.47 15.83 15.00 13.13 13.31 20.49 12.95 13.05
    May 8.62 15.94 14.85 12.99 13.04 20.01 13.32 12.98
    Jun 8.82 16.02 15.07 13.39 13.36 19.83 13.04 13.13
    Jul 9.23 15.68 14.82 12.97 12.91 19.69 12.87 12.57
    Aug 9.26 15.70 14.74 13.02 12.90 19.92 12.91 12.74
    Sep 9.26 15.12 14.40 12.55 12.38 19.25 12.40 12.31
    Oct 9.80 16.14 15.17 13.40 13.39 19.67 13.39 13.10
    Nov 9.95 16.70 15.76 13.83 13.89 19.64 14.46 13.36
    Dec 9.73 15.77 14.76 13.20 12.35 19.36 13.00 13.03
    ALL 9.07 16.04 15.11 13.25 13.18 20.01 13.06 12.95

    View Slide

  29. Results – distribution of
    percentage error

    View Slide

  30. Conclusions
    • What increases rental price (from GLM):
    • Number 
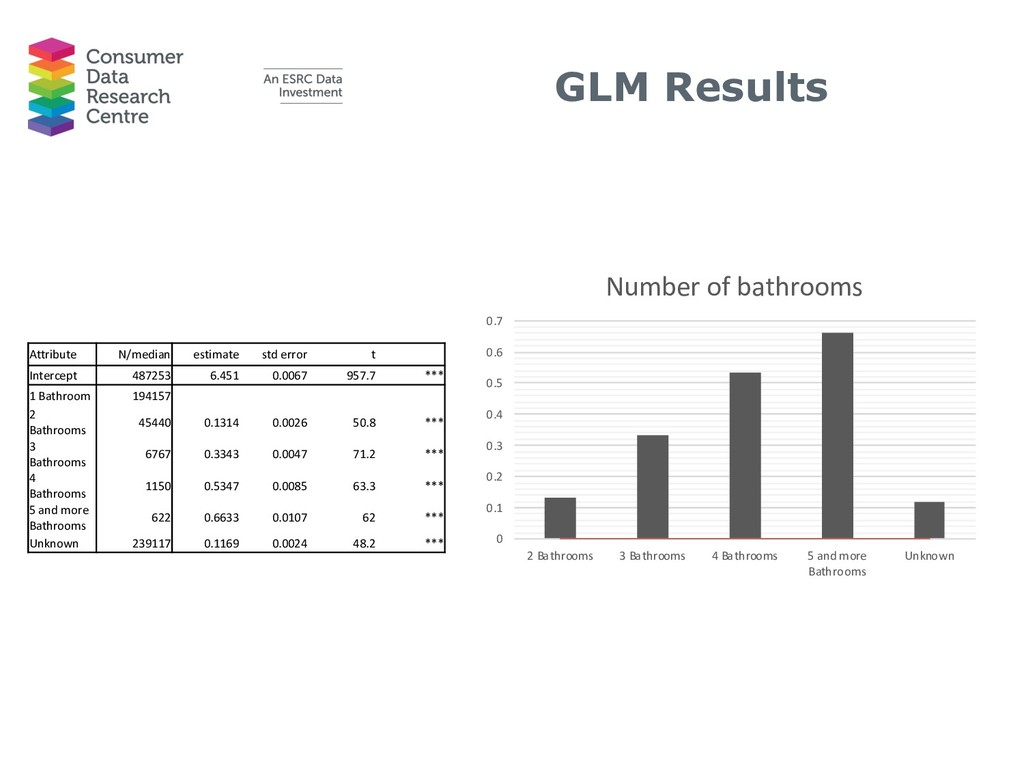
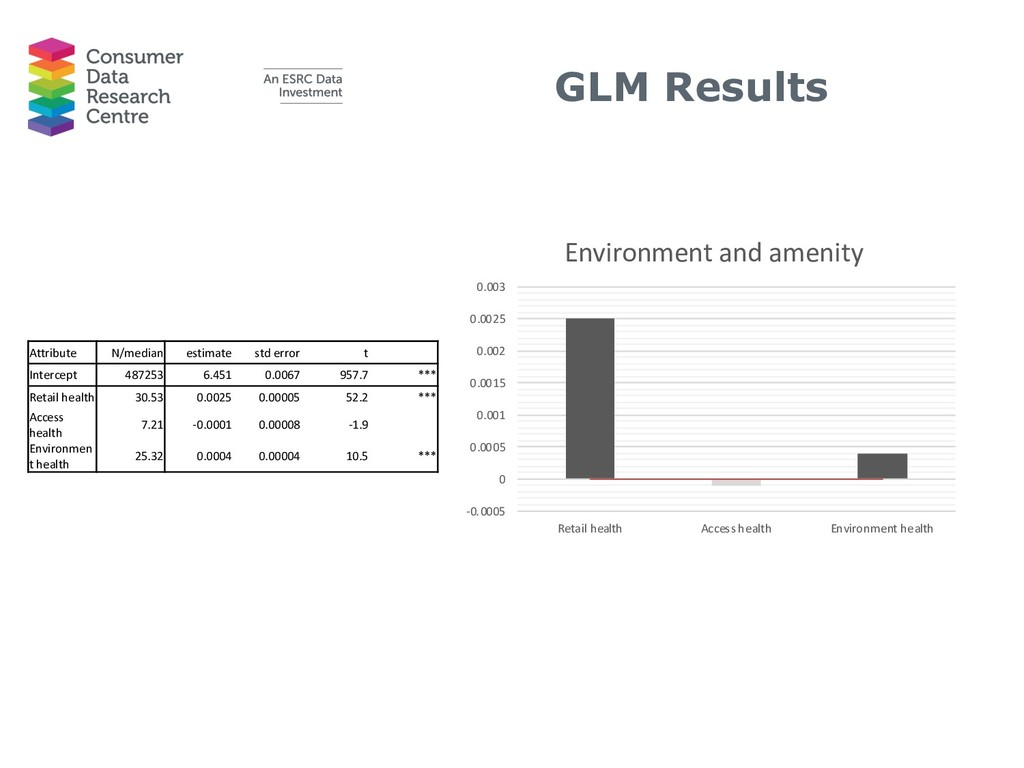
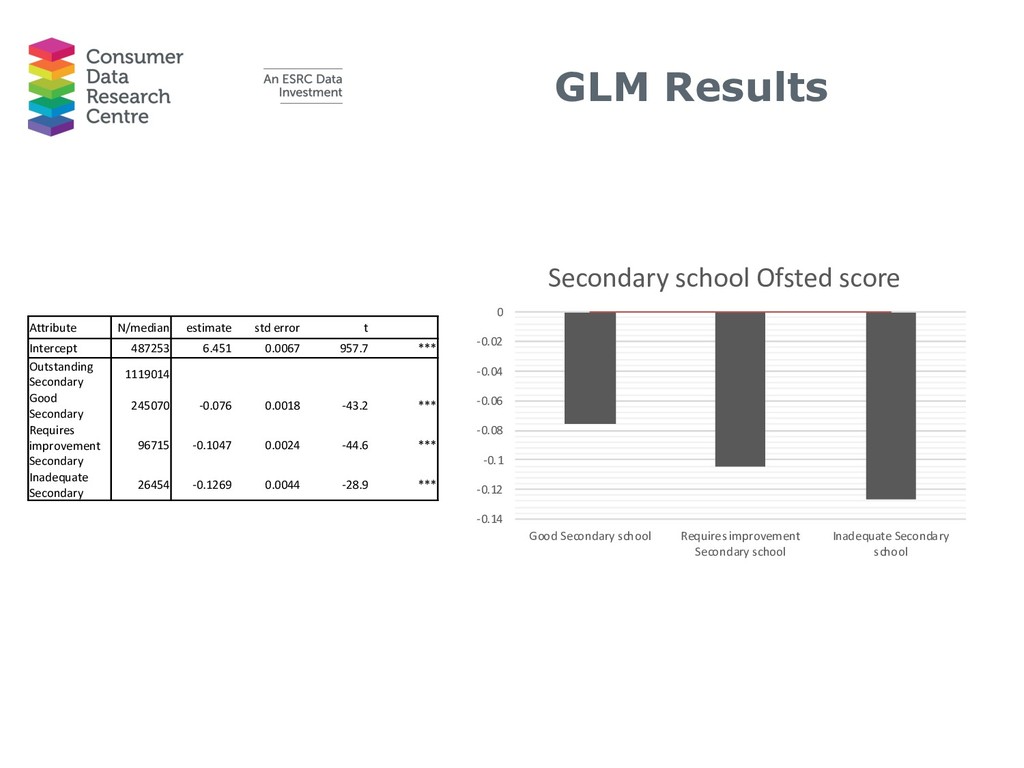
of rooms in the property
    • proximity to central London
    • Proximity to railway stations
    • being located in more affluent
    neighbourhoods
    • being close to local amenities
    • Being close to better performing schools

    View Slide

  31. Conclusions
    • Practitioner approach produced appraisals
    that have much smaller percentage error
    whilst the other approaches have better r2
    • The two tree based approaches were seen
    to outperform the regression based
    approaches

    View Slide

  32. https://goo.gl/7SQ5AG
    https://goo.gl/BM53NT

    View Slide

  33. • Three-tier Data Access
    • Secure Facilities
    • Trusted Researchers
    • Governance
    • Safe results
    www.cdrc.ac.uk
    Questions

    View Slide