Upgrade to Pro — share decks privately, control downloads, hide ads and more …

What is... IPF and Microsimulation

Nik Lomax
September 09, 2019

What is... IPF and Microsimulation

Here is the summary of the session at the British Society for Population Studies annual conference in Cardiff, organised by my colleague Paul Norman.

This session is aimed at those who want to know more about getting skilled up. The audience might be PhD students, postdocs, local or national government researchers or just anybody intrigued about knowing about something new to them. Each (c. 10 minute) presentation will: introduce in an accessible manner a quantitative method and will explain what you can do with it and with what kinds of data. Where possible there will be research examples and pointers to materials which can help people learn the method.

I covered Iterative Proportional Fitting (IPF) and Microsimulation (IPF):

Iterative Proportional Fitting
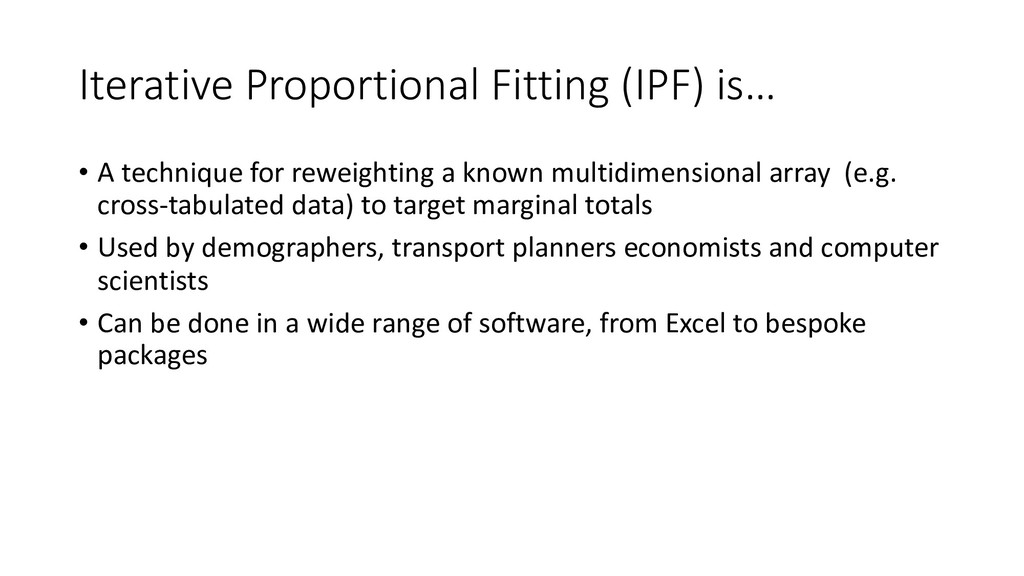
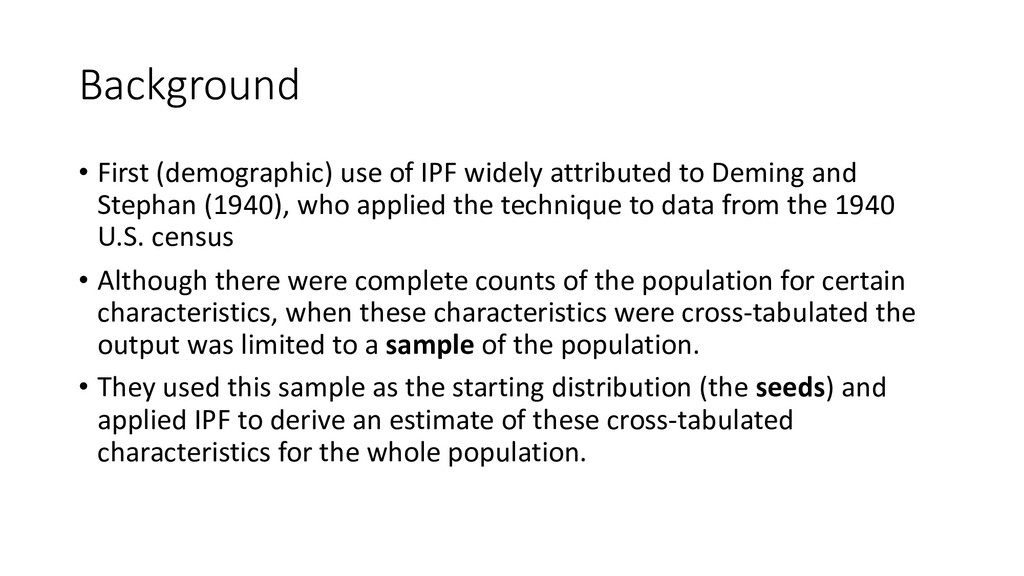
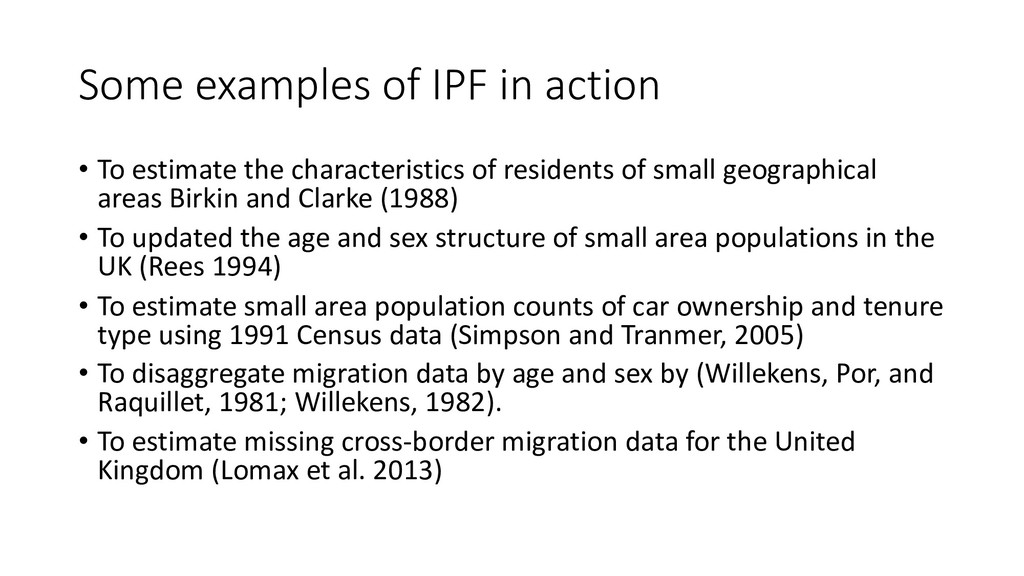
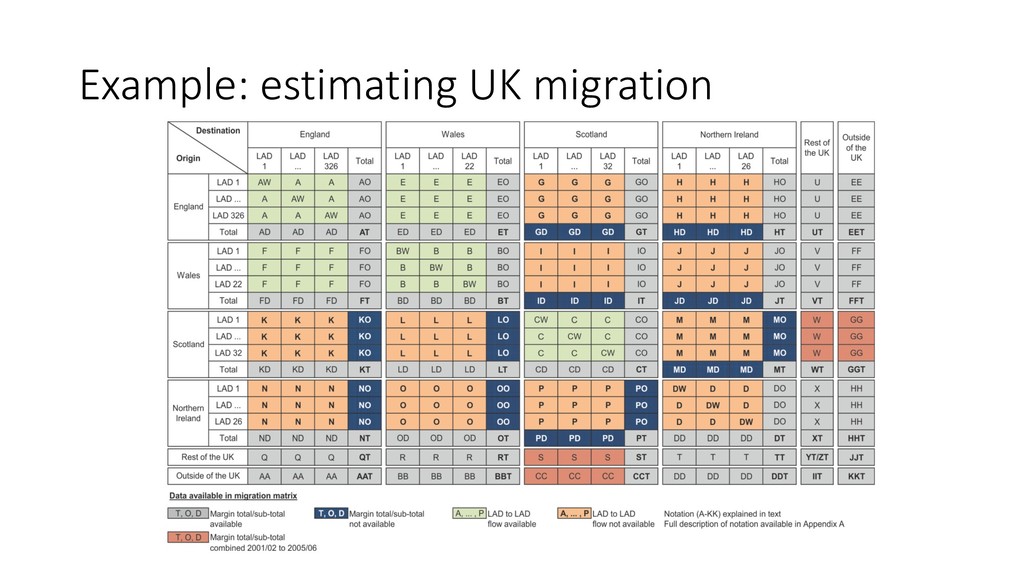
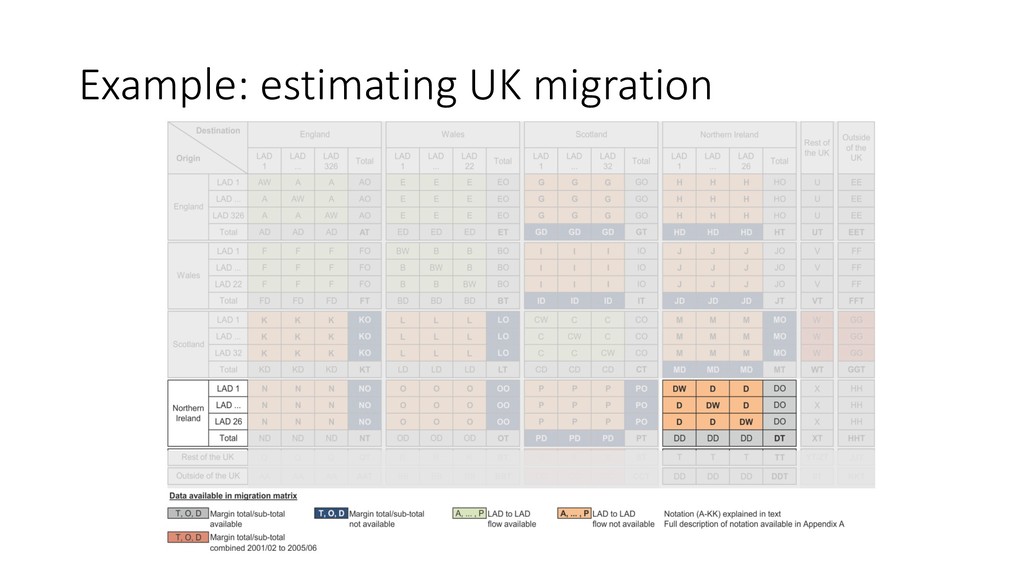
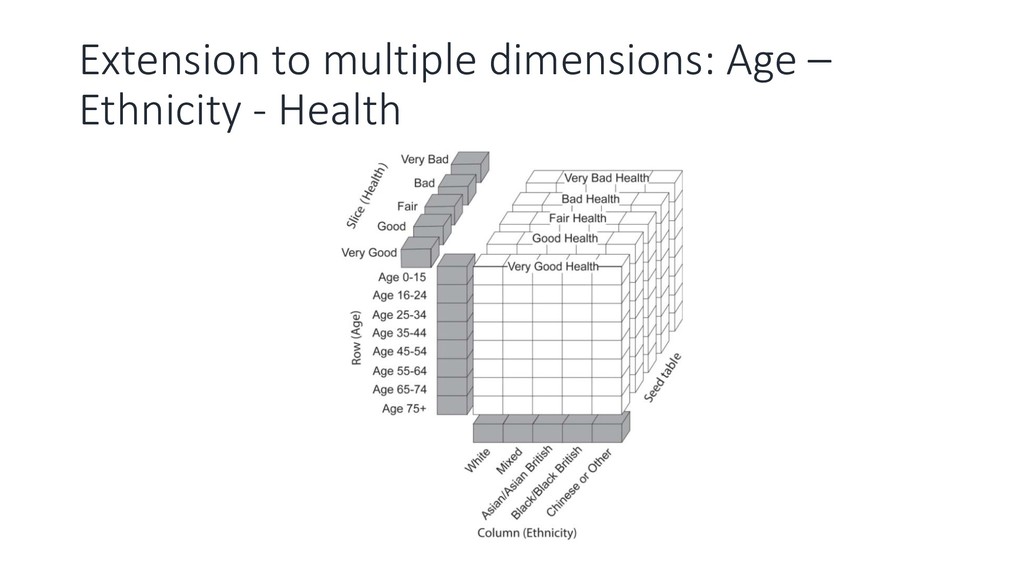
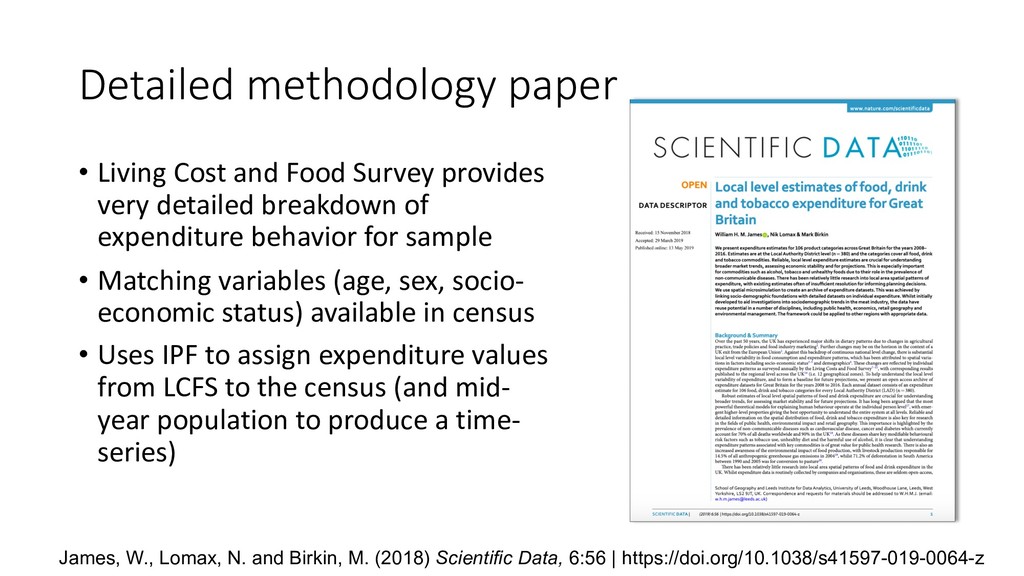
Iterative Proportional Fitting (IPF) is a technique that can be used to adjust a distribution reported in one data set by totals reported in others. There are various data situations in population research when values for population attributes might be missing due to being unknown, unreliable, outdated, or a sample. IPF provides a tool for estimating these missing data.
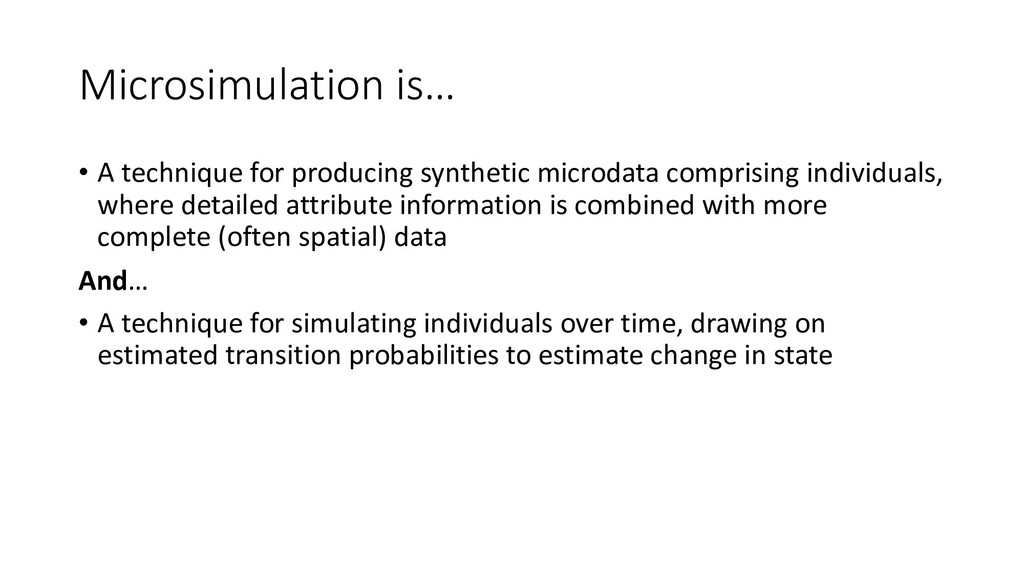
Microsimulation
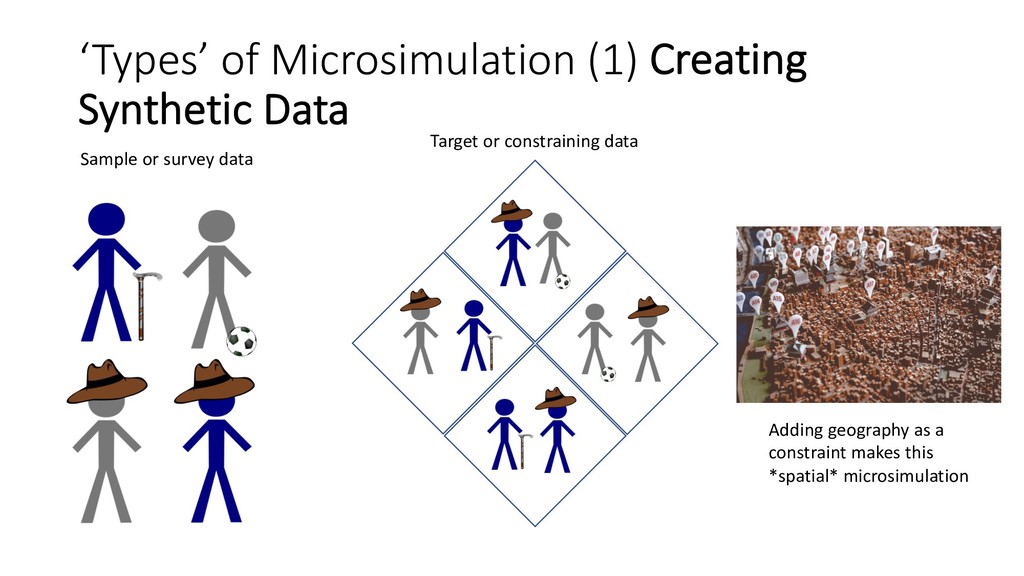
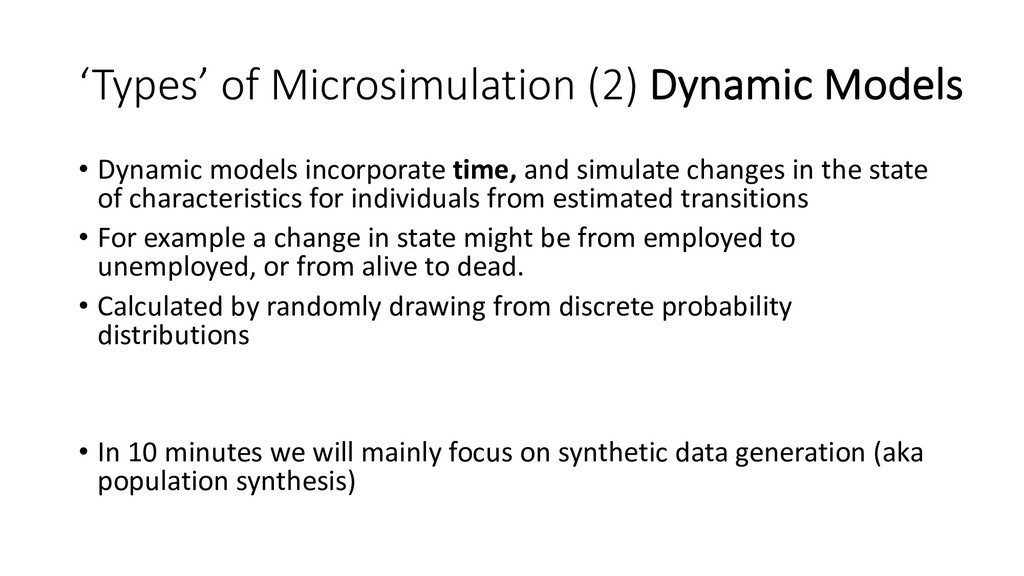
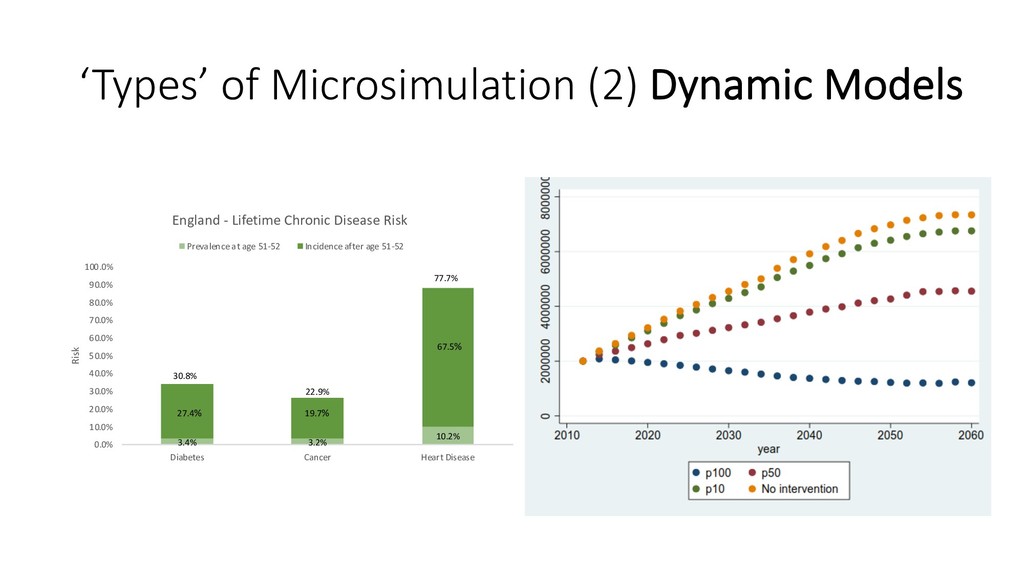
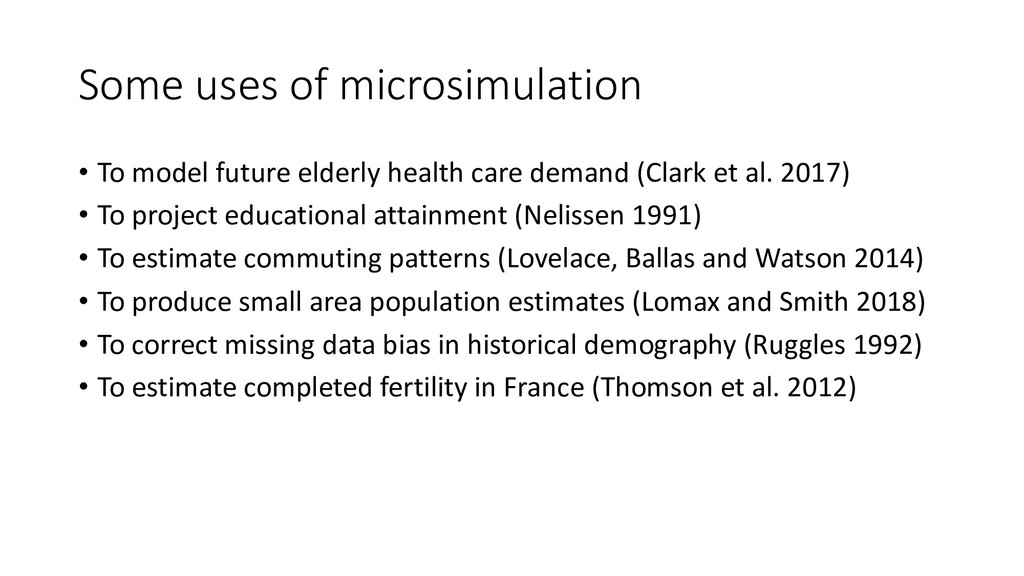
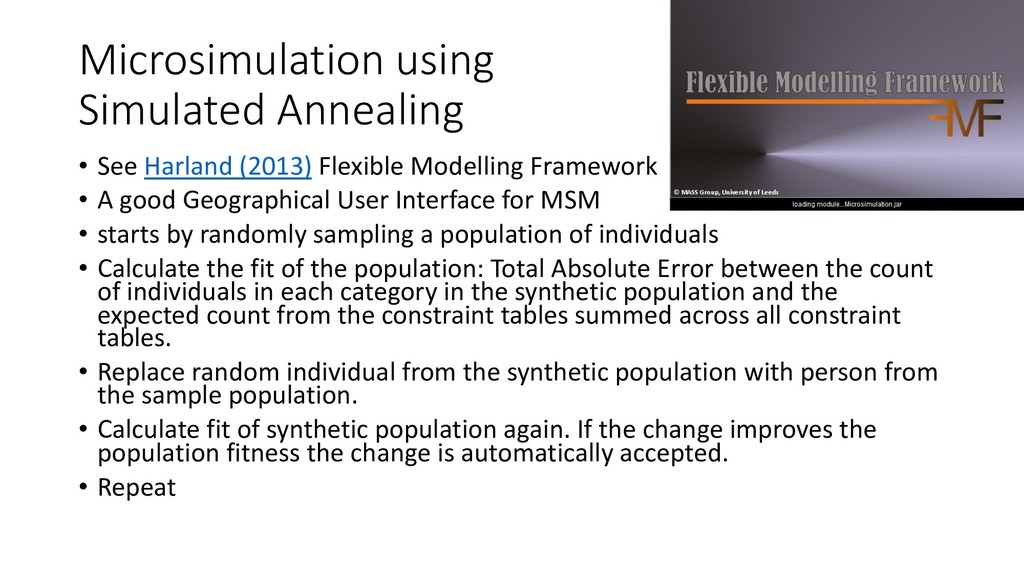
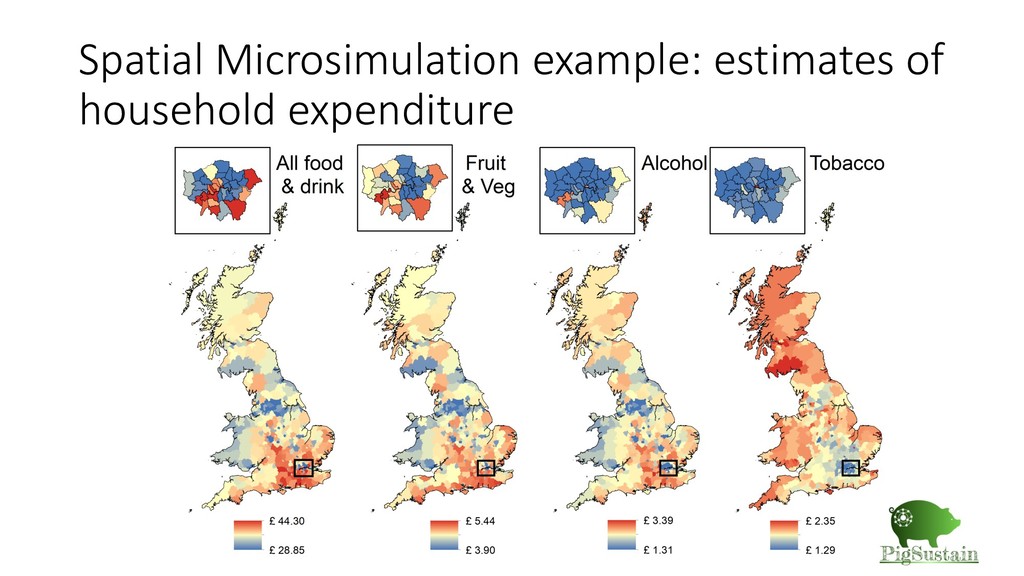
Microsimulation is an approach used to estimate the characteristics of individuals within a population from a range of attribute-rich data sources and for modelling those individuals over time. The creation of a synthetic population of individuals is often called spatial microsimulation because spatial identifiers are added to the individuals. Dynamic models deal with time steps, they are used to age the individuals and alter their characteristics by introducing the probability of transitioning between different states. For example, dynamic models can be used in health policy to assess outcomes for individuals in the model under different intervention scenarios.

Nik Lomax

September 09, 2019
Tweet

More Decks by Nik Lomax

Other Decks in Research

Transcript

  1. What is… Iterative
    Proportional Fitting?
    Nik Lomax
    School of Geography, University of Leeds
    British Society for Population Studies Annual Conference, Cardiff
    9 September 2019

    View Slide

  2. Iterative Proportional Fitting (IPF) is…
    • A technique for reweighting a known multidimensional array (e.g.
    cross-tabulated data) to target marginal totals
    • Used by demographers, transport planners economists and computer
    scientists
    • Can be done in a wide range of software, from Excel to bespoke
    packages

    View Slide

  3. You might know it by another name
    • RAS in economics (see Bacharach 1965)
    • Cross–Fratar (Fratar 1954) or Furness (Furness 1965) in transport
    engineering
    • Raking in in computer science and statistics (Cohen 2008)
    • IPF has also been referred to as rim-weighting or structure-
    preserving estimation (Simpson and Tranmer 2005).

    View Slide

  4. Simply a way of reweighting a distribution

    View Slide

  5. Lomax, N., Norman, P., Rees, P. et al. (2013) Subnational migration in the United Kingdom: producing a
    consistent time series using a combination of available data and estimates, J Pop Research, 30: 265.
    https://doi.org/10.1007/s12546-013-9115-z

    View Slide

  6. Background
    • First (demographic) use of IPF widely attributed to Deming and
    Stephan (1940), who applied the technique to data from the 1940
    U.S. census
    • Although there were complete counts of the population for certain
    characteristics, when these characteristics were cross-tabulated the
    output was limited to a sample of the population.
    • They used this sample as the starting distribution (the seeds) and
    applied IPF to derive an estimate of these cross-tabulated
    characteristics for the whole population.

    View Slide

  7. Some examples of IPF in action
    • To estimate the characteristics of residents of small geographical
    areas Birkin and Clarke (1988)
    • To updated the age and sex structure of small area populations in the
    UK (Rees 1994)
    • To estimate small area population counts of car ownership and tenure
    type using 1991 Census data (Simpson and Tranmer, 2005)
    • To disaggregate migration data by age and sex by (Willekens, Por, and
    Raquillet, 1981; Willekens, 1982).
    • To estimate missing cross-border migration data for the United
    Kingdom (Lomax et al. 2013)

    View Slide

  8. Example: estimating UK migration

    View Slide

  9. Example: estimating UK migration

    View Slide

  10. Example: estimating UK migration

    View Slide

  11. Extension to multiple dimensions: Age –
    Ethnicity - Health

    View Slide

  12. Software solutions
    • Modules and user-produced syntax are available for Excel, SAS,
    Matlab, Stata, and SPSS.
    • I like the mipfp package in R

    View Slide

  13. View Slide

  14. References
    • Bacharach, M. 1965. Estimating nonnegative matrices from marginal data. International Economic Review, 6(3): 294–310
    • Birkin, M., and M. Clarke. 1988. SYNTHESIS—A synthetic spatial information system for urban and regional analysis: Methods and
    examples.Environment and Planning A20(12): 1645–71
    • Cohen, M. 2008. Raking. Encyclopedia of survey researchmethods, ed.P.Lavrakas, 672–74. Thousand Oaks, CA: Sage.
    • Fratar, T. J. 1954. Vehicular trip distribution by successive approximations. Traffic Quarterly, 8(1): 53–65.
    • Furness, K. P. 1965. Time function iteration. Traffic Engineering and Control, 7(7): 458–60.
    • Lomax, N., Norman, P., Rees, P. et al. 2013. Subnational migration in the United Kingdom: producing a consistent time series using
    a combination of available data and estimates, J Pop Research, 30: 265. https://doi.org/10.1007/s12546-013-9115-z
    • Lomax, N & Norman, P. 2016. Estimating Population Attribute Values in a Table: “Get Me Started in” Iterative Proportional Fitting,
    The Professional Geographer, 68:3,451-461, DOI: 10.1080/00330124.2015.1099
    • Rees, P. 1994. Estimating and projecting the populations of urban communities. Environment & Planning A, 26:1671–97.
    • Simpson, L., and M. Tranmer. 2005. Combining sample and census data in small area estimates: Iterative proportional fitting with
    standard software. The Professional Geographer57 (2): 222–34.
    • Willekens, F. 1982. Multidimensional population analysis with incomplete data. In Multidimensional mathematical demography,
    ed. K. Land and A. Rogers, 43–111. NewYork: Academic.
    • Willekens, F., A. Por, and R. Raquillet. 1981. Entropy, multiproportional, and quadratic techniques for inferring patterns of
    migration from aggregate data. In: Advances in multiregional demography, ed. A. Rogers, 84–106. Laxenburg, Austria: International
    Institute for Applied Systems Analysis.

    View Slide

  15. What is… Microsimulation?
    Nik Lomax
    School of Geography, University of Leeds
    British Society for Population Studies Annual Conference, Cardiff
    9 September 2019

    View Slide

  16. Microsimulation is…
    • A technique for producing synthetic microdata comprising individuals,
    where detailed attribute information is combined with more
    complete (often spatial) data
    And…
    • A technique for simulating individuals over time, drawing on
    estimated transition probabilities to estimate change in state

    View Slide

  17. ‘Types’ of Microsimulation (1) Creating
    Synthetic Data
    Sample or survey data
    Target or constraining data

    View Slide

  18. ‘Types’ of Microsimulation (1) Creating
    Synthetic Data
    Sample or survey data
    Target or constraining data
    Adding geography as a
    constraint makes this
    *spatial* microsimulation

    View Slide

  19. ‘Types’ of Microsimulation (2) Dynamic Models
    • Dynamic models incorporate time, and simulate changes in the state
    of characteristics for individuals from estimated transitions
    • For example a change in state might be from employed to
    unemployed, or from alive to dead.
    • Calculated by randomly drawing from discrete probability
    distributions
    • In 10 minutes we will mainly focus on synthetic data generation (aka
    population synthesis)

    View Slide

  20. ‘Types’ of Microsimulation (2) Dynamic Models
    3.4% 3.2%
    10.2%
    30.8%
    22.9%
    77.7%
    0.0%
    10.0%
    20.0%
    30.0%
    40.0%
    50.0%
    60.0%
    70.0%
    80.0%
    90.0%
    100.0%
    Diabetes Cancer Heart Disease
    Risk
    England - Lifetime Chronic Disease Risk
    Prevalence at age 51-52 Incidence after age 51-52
    27.4%
    67.5%
    19.7%

    View Slide

  21. Background
    • Many of today’s microsimulation developments are rooted in the
    work of Orcutt (1957) and Orcutt et al. (1961), who argued that
    theoretical models of socio-economic systems are best applied at the
    individual level because it is individuals who make decisions within
    the system.
    • Concern that macroeconomic models were not able to assess the
    effect of government policy on things like income distribution or
    policy

    View Slide

  22. Some uses of microsimulation
    • To model future elderly health care demand (Clark et al. 2017)
    • To project educational attainment (Nelissen 1991)
    • To estimate commuting patterns (Lovelace, Ballas and Watson 2014)
    • To produce small area population estimates (Lomax and Smith 2018)
    • To correct missing data bias in historical demography (Ruggles 1992)
    • To estimate completed fertility in France (Thomson et al. 2012)

    View Slide

  23. Methods for creating synthetic data
    • Deterministic reweighting
    • Iterative Proportional Fitting
    • Integerised IPF / GREGWT
    • Proabilistic (combinatorial optimization) approaches
    • Simulated Annealing
    • Hill climbing
    • For a discussion of pros/cons see Lovelace and Ballas (2013)

    View Slide

  24. Microsimulation using
    Simulated Annealing
    • See Harland (2013) Flexible Modelling Framework
    • A good Geographical User Interface for MSM
    • starts by randomly sampling a population of individuals
    • Calculate the fit of the population: Total Absolute Error between the count
    of individuals in each category in the synthetic population and the
    expected count from the constraint tables summed across all constraint
    tables.
    • Replace random individual from the synthetic population with person from
    the sample population.
    • Calculate fit of synthetic population again. If the change improves the
    population fitness the change is automatically accepted.
    • Repeat

    View Slide

  25. Spatial Microsimulation example: estimates of
    household expenditure

    View Slide

  26. Spatial Microsimulation example: estimates of
    household expenditure
    Living Cost and Food Survey –
    detailed attribute data
    Census and mid-year
    estimate population data
    Local authority geography

    View Slide

  27. Detailed methodology paper
    • Living Cost and Food Survey provides
    very detailed breakdown of
    expenditure behavior for sample
    • Matching variables (age, sex, socio-
    economic status) available in census
    • Uses IPF to assign expenditure values
    from LCFS to the census (and mid-
    year population to produce a time-
    series)
    James, W., Lomax, N. and Birkin, M. (2018) Scientific Data, 6:56 | https://doi.org/10.1038/s41597-019-0064-z

    View Slide

  28. Software solutions
    • R implementations: MicSim and others
    • STATA, Python, C++ …
    • … Most models are bespoke

    View Slide

  29. References
    • Clark S, Birkin M, Heppenstall A and Rees P (2017) Using 2011 Census data to estimate future elderly heath care demand. In:
    Stillwell J and Duke-Williams O (eds) The Routledge Handbook of Census Resources, Methods and Applications: Unlocking the UK
    2011 Census. London: Routledge; 305–319.
    • Harland, K (2013) Microsimulation Model User Guide (Flexible Modelling Framework). NCRM Working Paper. NCRM.
    • Lomax, N and Smith, A (2017) Microsimulation for demography. Australian Population Studies, 1(1): 73-85.
    • Lovelace, R (2016) Spatial Microsimulation with R. CRC Press.
    • Lovelace, R and Ballas, D (2013) ‘Truncate, replicate, sample’: A method for creating integer weights for spatial microsimulation,
    Computers, Environment and Urban Systems, 41: 1-11
    • Lovelace R, Ballas D and Watson M (2014) A spatial microsimulation approach for the analysis of commuter patterns: from
    individual to regional levels. Journal of Transport Geography 34: 282–296.
    • Nelissen J (1991) Household and education projections by means of a microsimulation model. Economic Modelling 8(4): 480–511.
    • Ruggles S (1992) Migration, marriage, and mortality: correcting sources of bias in English family reconstitutions. Population studies
    46(3): 507–522.
    • Thomson E, Winkler-Dworak M, Spielauer M and Prskawetz A (2012) Union instability as an engine of fertility? A microsimulation
    model for France. Demography 49(1): 175–195.
    • Orcutt, G.H. (1957) A new type of socio-economic system. The Review of Economics and Statistics, 39(2): 116-123.
    • Orcutt, G., Greenberger, M., Korbel, J. and Rivlin A (1961) Microanalysis of Socioeconomic Systems: A Simulation Study. New York:
    Harper and Row.

    View Slide