Upgrade to Pro — share decks privately, control downloads, hide ads and more …

Improve Monitoring and Observability of Kubernetes with OSS tools

Improve Monitoring and Observability of Kubernetes with OSS tools

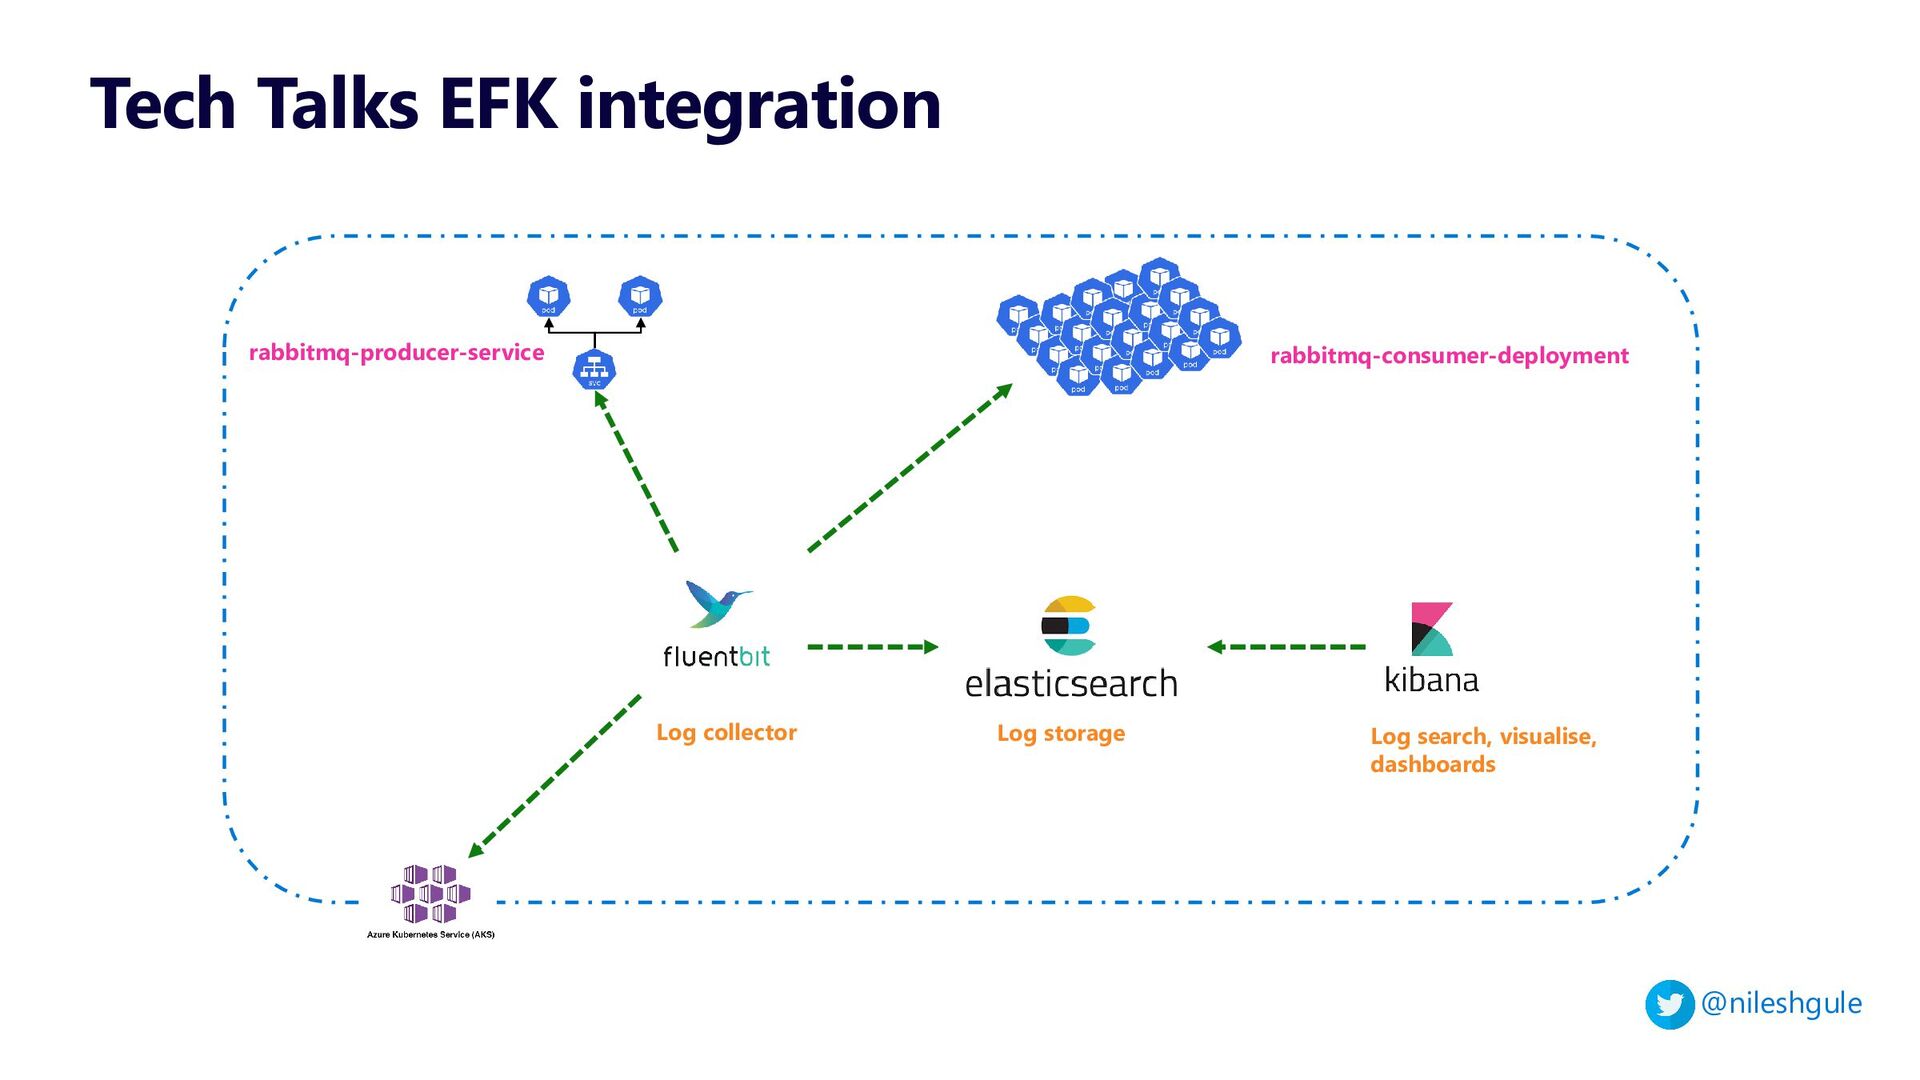
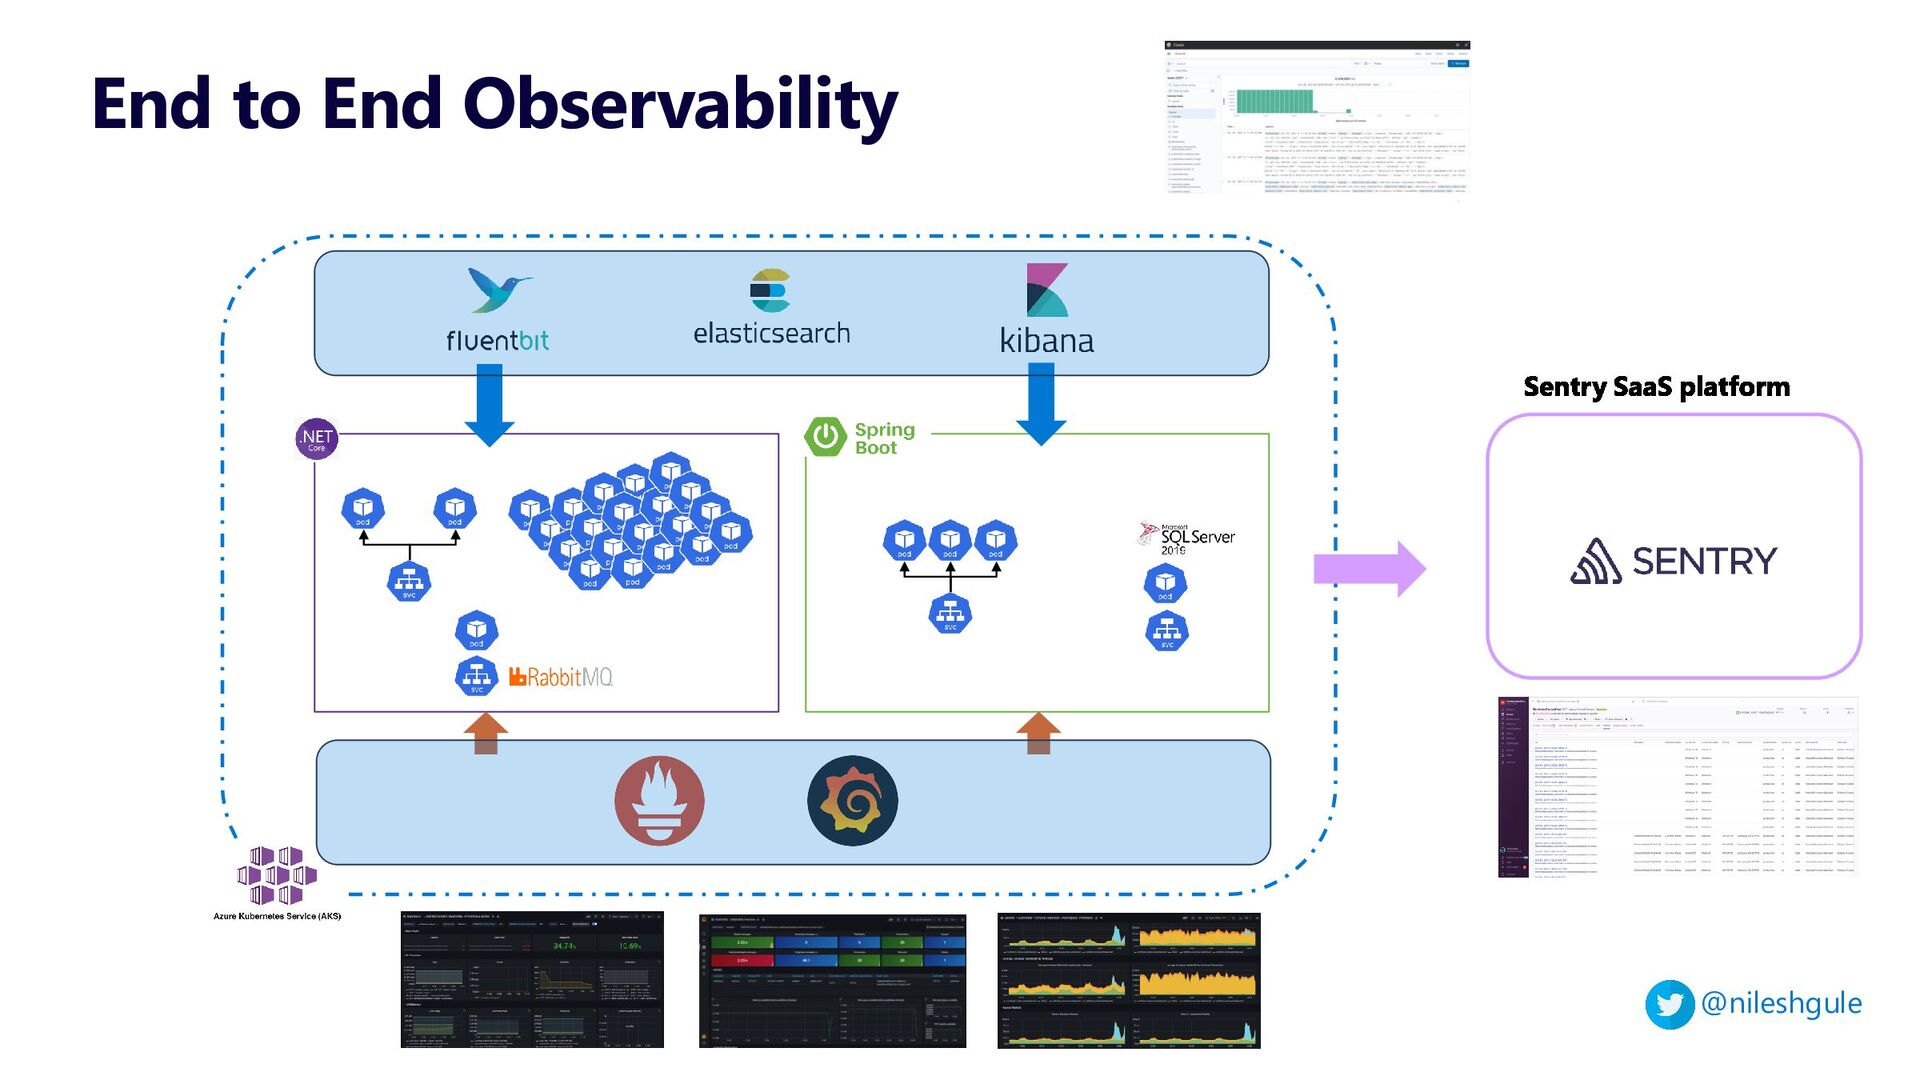
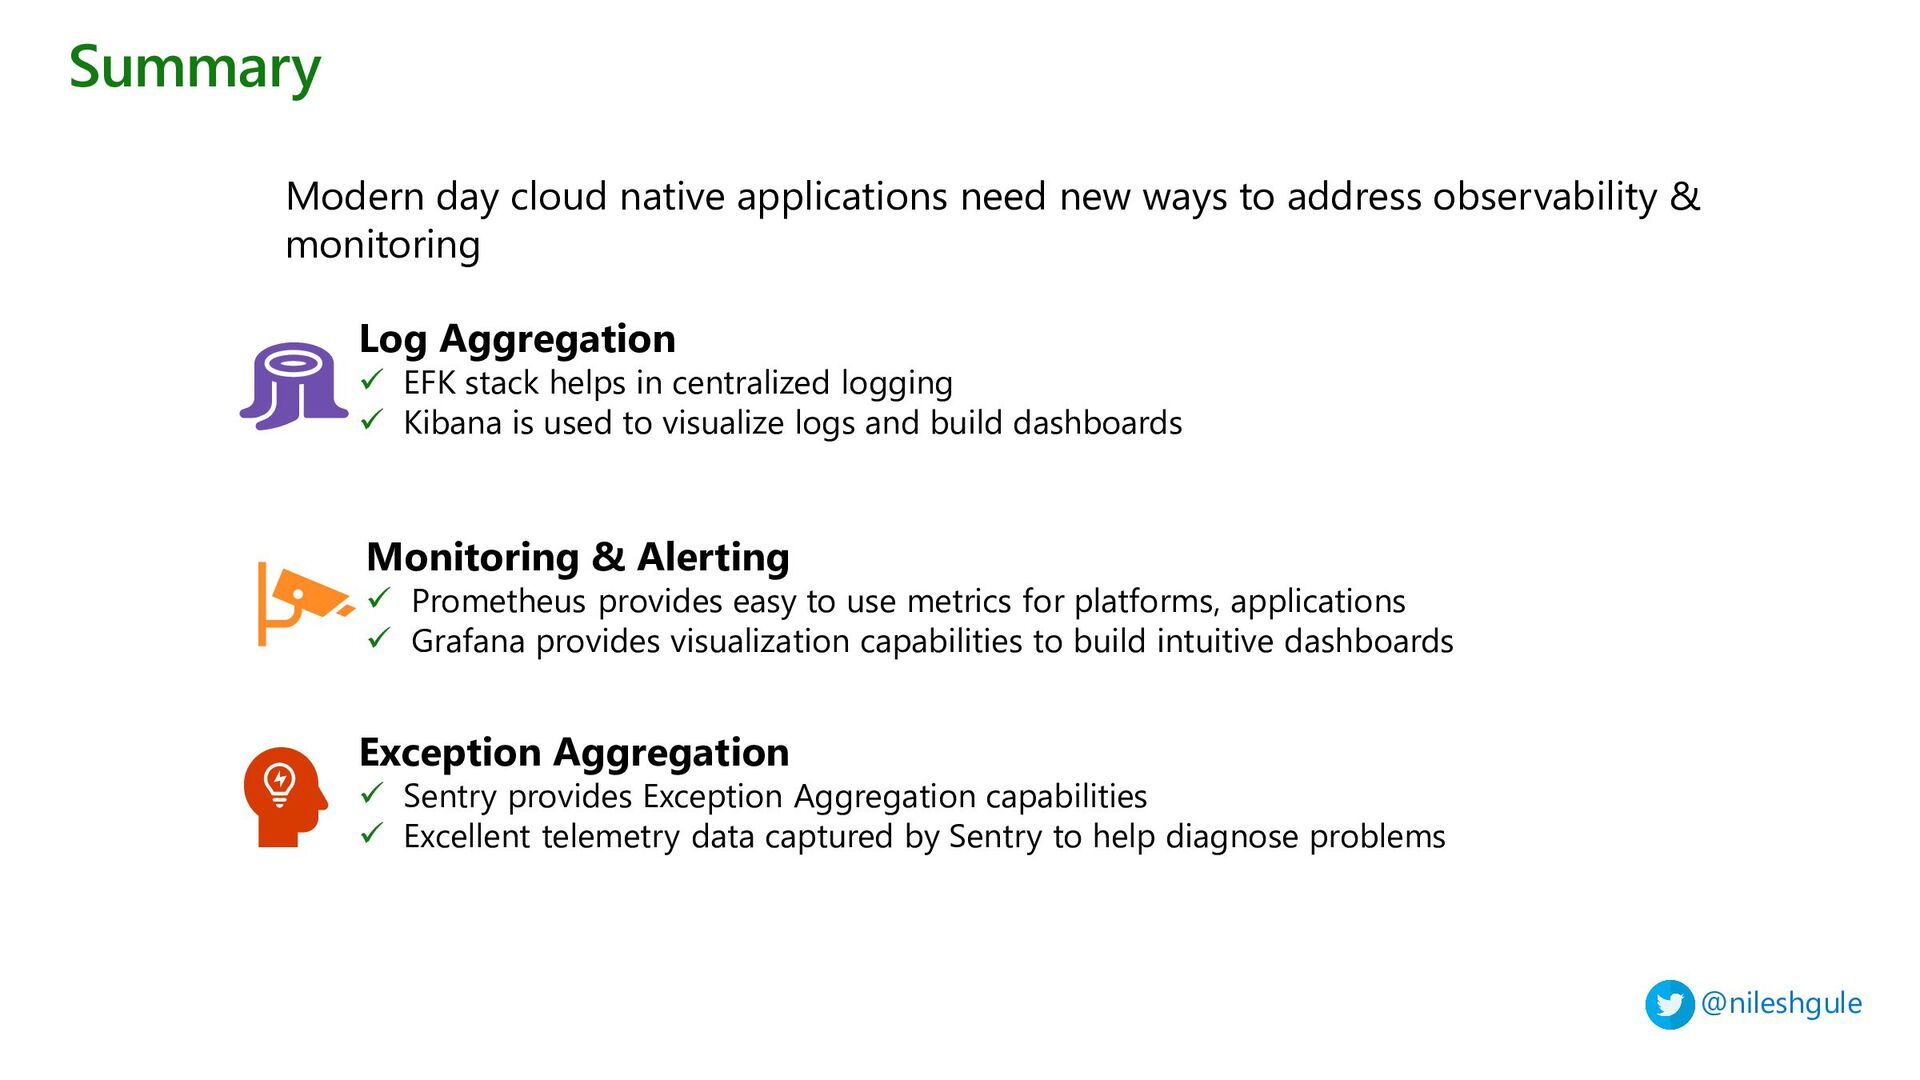
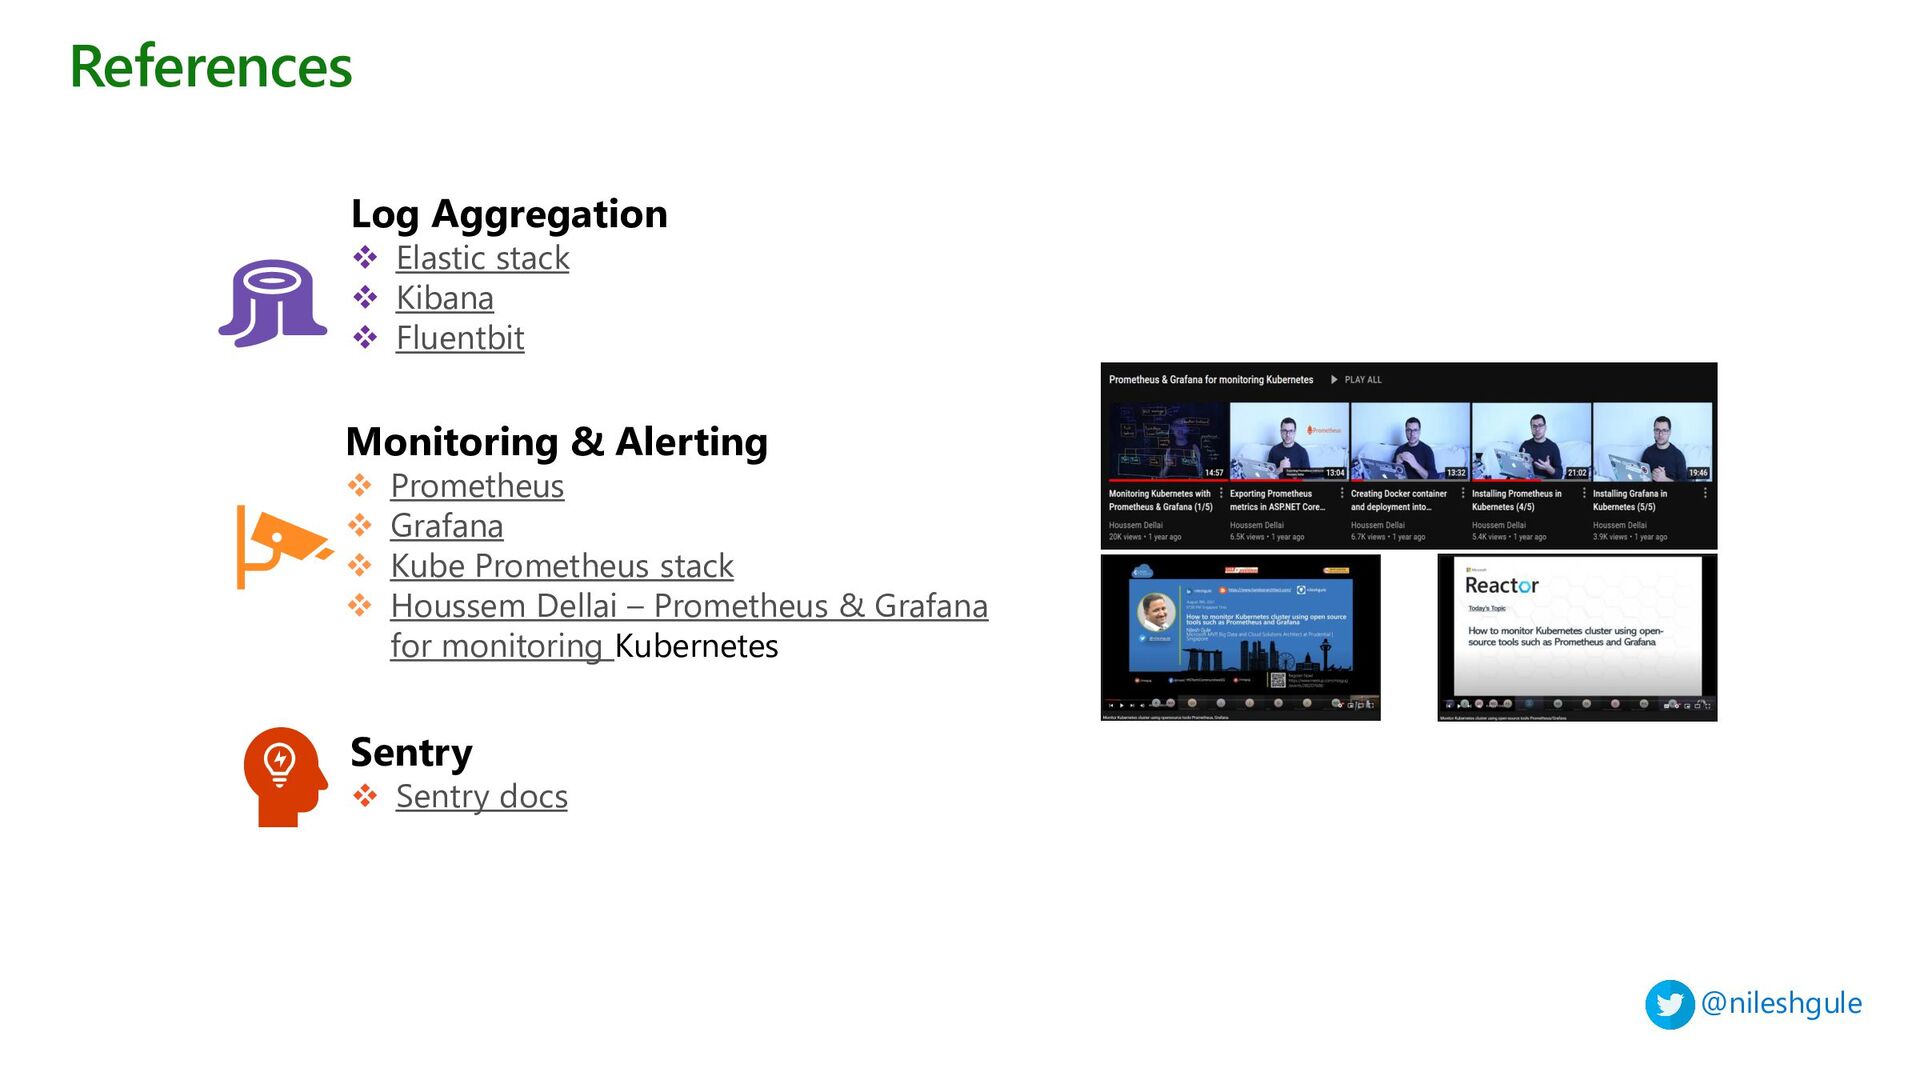
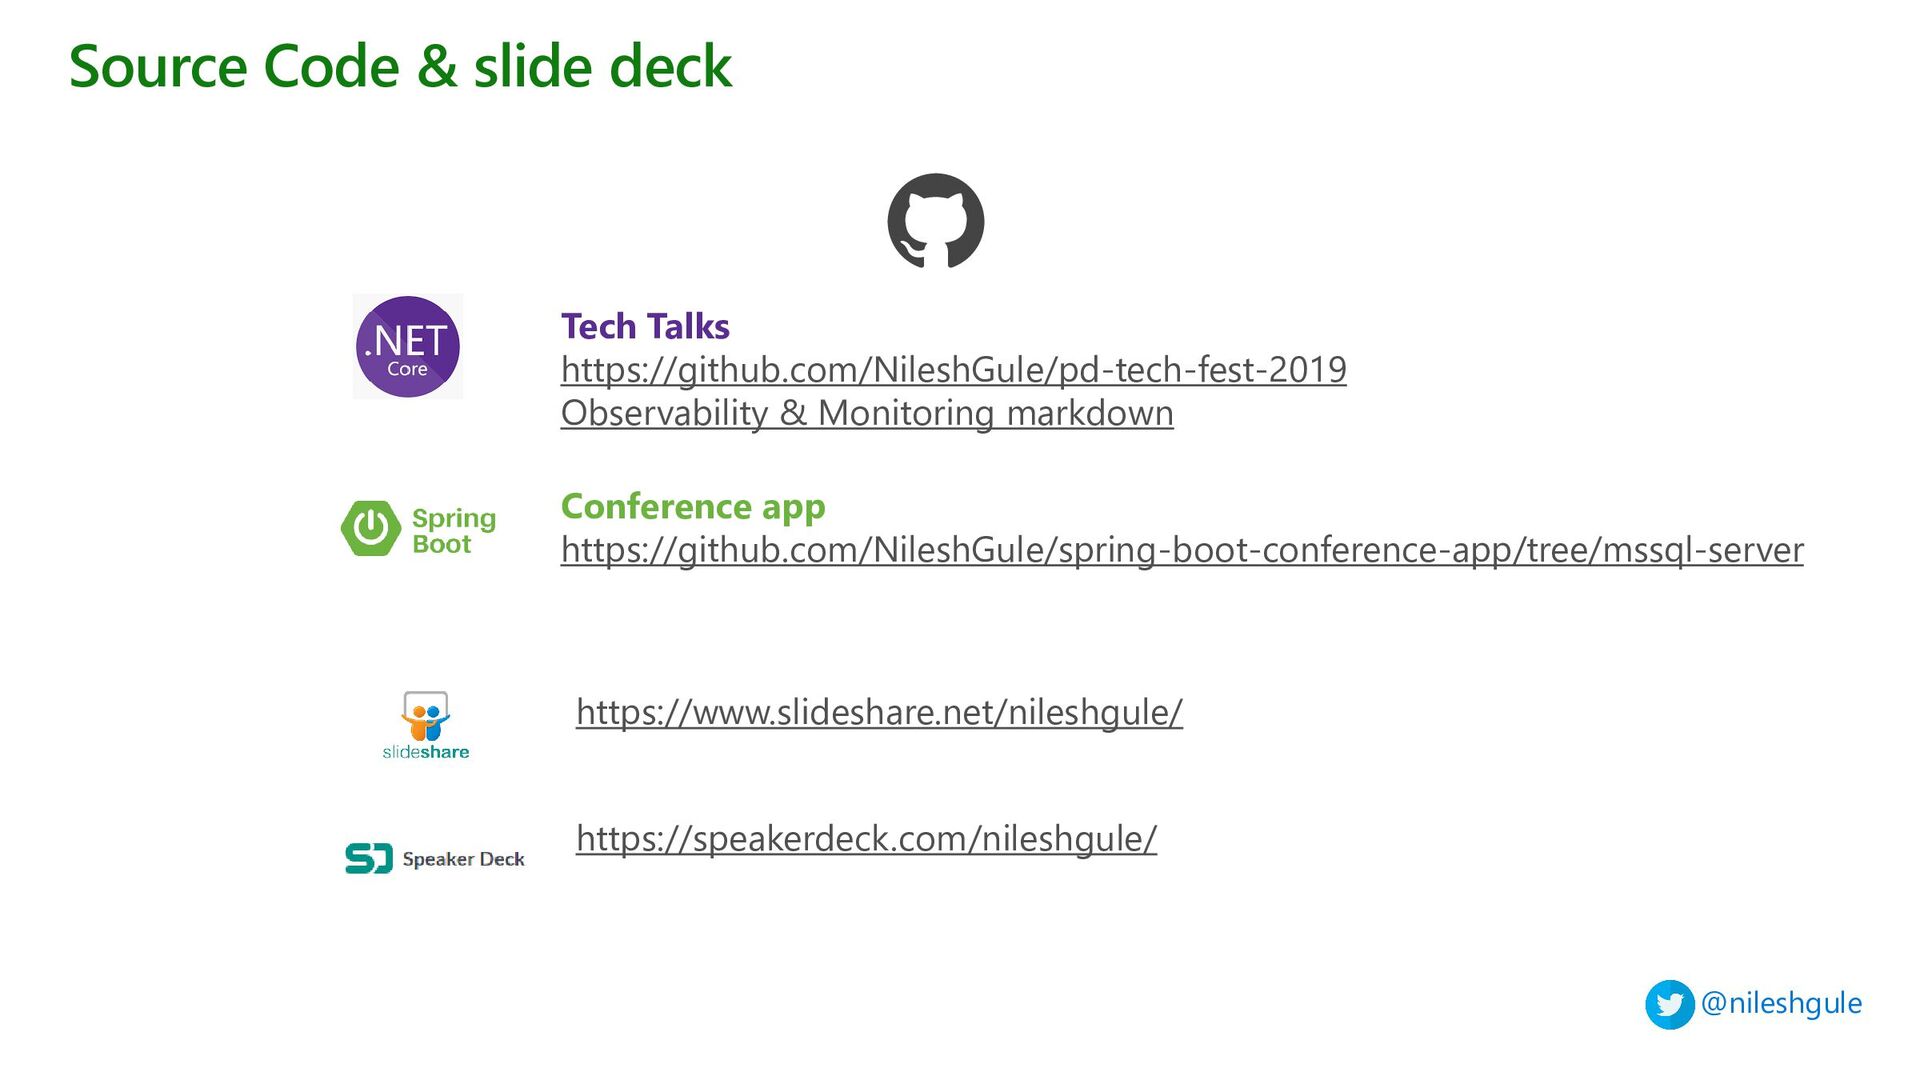
Deck used for the Surati Tech Talks 2022 event on 11 January. The demo covers end to end Monitoring and Observability for Kubernetes using Elasticsearch, Fluentbit and Kibana for log aggregation, Prometheus & Grafana for Monitoring & Alerting and Sentry for Exception handling. The target environment is Azure Kubernetes Service (AKS) cluster.

Nilesh Gule

January 11, 2022
Tweet

More Decks by Nilesh Gule

Other Decks in Technology

Transcript

  1. $whoami { “name” : “Nilesh Gule”, “website” : “https://www.HandsOnArchitect.com", “github”

    : “https://GitHub.com/NileshGule" “twitter” : “@nileshgule”, “linkedin” : “https://www.linkedin.com/in/nileshgule”, “likes” : “Technical Evangelism, Cricket”, “co-organizer” : “Azure Singapore UG” } https://bit.ly/AzureSingaporeSessions
  2. @nileshgule Pre-requisites Self contained application with all its dependencies Docker

    ❖ Orchestrates containers ❖ Self healing ❖ Service discovery ❖ Scaling Kubernetes ❖ Scalable apps in dynamic environments (public / private / hybrid clouds) ❖ Exemplified by Containers, service meshes, microservices, immutable infrastructure & declarative APIs ❖ Loosely coupled systems, resilient, observable & manageable ❖ Robust automation Cloud Native Applications
  3. @nileshgule ❑ Application specific ❖ Long term log retention for

    compliance reasons ❖ Workloads scheduled on different nodes during application restarts / updates ❖ Autoscaling workloads ❑ Kubernetes upgrades ❖ Auto healing can reschedule workloads ❖ Underlying nodes added / deleted during cluster scaling ❖ Underlying nodes replaced during cluster upgrades Container based workloads Why centralized logging ❖ Not much control over underlying infra ❖ Relies on cloud prover specific logging and monitoring solution PaaS / Serverless services
  4. @nileshgule Tech Talks EFK integration Log collector Log storage Log

    search, visualise, dashboards rabbitmq-producer-service rabbitmq-consumer-deployment
  5. @nileshgule • Application specific • Monitor resource usage • Monitor

    scaling needs • Monitor anomalies / outliers • Kubernetes platform level • Monitor cluster resources (CPU / RAM) • API health • Autoscaling Container based workloads Why Monitoring & Alerting • Monitor resource usage • Scaling • Bottlenecks PaaS / Serverless services
  6. @nileshgule Summary Modern day cloud native applications need new ways

    to address observability & monitoring Log Aggregation ✓ EFK stack helps in centralized logging ✓ Kibana is used to visualize logs and build dashboards Monitoring & Alerting ✓ Prometheus provides easy to use metrics for platforms, applications ✓ Grafana provides visualization capabilities to build intuitive dashboards Exception Aggregation ✓ Sentry provides Exception Aggregation capabilities ✓ Excellent telemetry data captured by Sentry to help diagnose problems
  7. @nileshgule References Log Aggregation ❖ Elastic stack ❖ Kibana ❖

    Fluentbit Monitoring & Alerting ❖ Prometheus ❖ Grafana ❖ Kube Prometheus stack ❖ Houssem Dellai – Prometheus & Grafana for monitoring Kubernetes Sentry ❖ Sentry docs
  8. @nileshgule Source Code & slide deck Tech Talks https://github.com/NileshGule/pd-tech-fest-2019 Observability

    & Monitoring markdown Conference app https://github.com/NileshGule/spring-boot-conference-app/tree/mssql-server https://speakerdeck.com/nileshgule/ https://www.slideshare.net/nileshgule/
  9. Nilesh Gule ARCHITECT | MICROSOFT MVP “Code with Passion and

    Strive for Excellence” nileshgule @nileshgule Nilesh Gule NileshGule www.handsonarchitect.com https://bit.ly/youtube-nileshgule
  10. Q&A