Masters of GIS, University of Minnesota (2010) Graduate Assistant, Polar Geospatial Center (2008-2010) Research Fellow, Polar Geospatial Center (2010-present) Roles & Responsibilities • Cartography & Logistics Mapping • User Support & Special Projects • Web Services Administration • GIS Application Developer
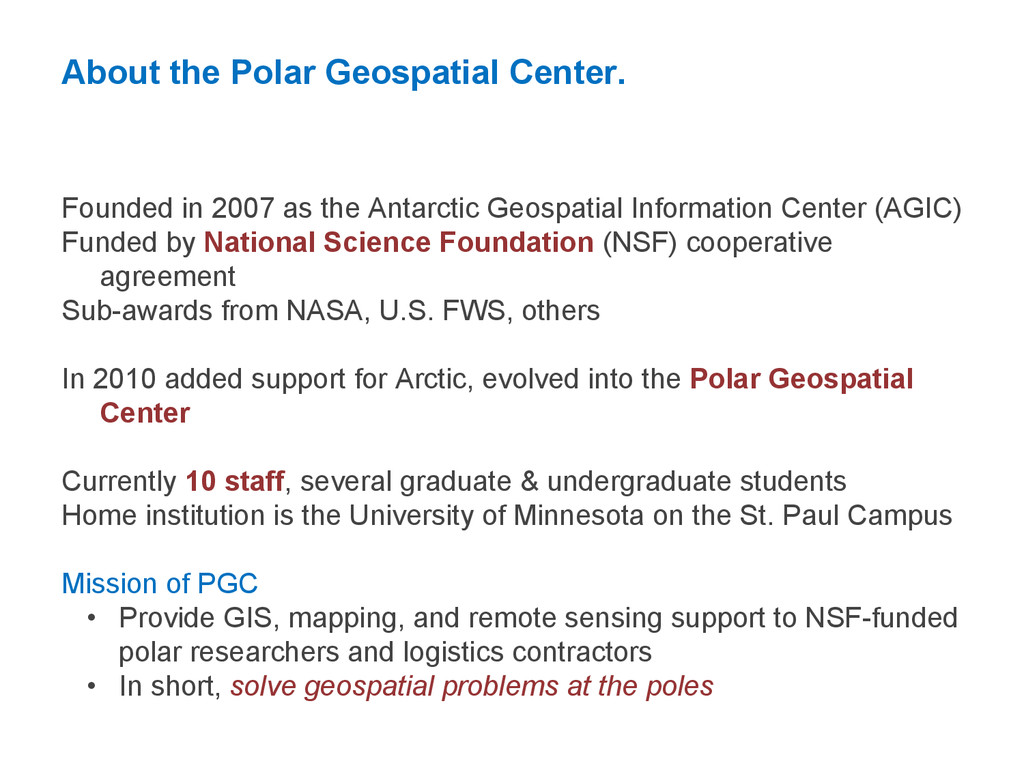
Antarctic Geospatial Information Center (AGIC) Funded by National Science Foundation (NSF) cooperative agreement Sub-awards from NASA, U.S. FWS, others In 2010 added support for Arctic, evolved into the Polar Geospatial Center Currently 10 staff, several graduate & undergraduate students Home institution is the University of Minnesota on the St. Paul Campus Mission of PGC • Provide GIS, mapping, and remote sensing support to NSF-funded polar researchers and logistics contractors • In short, solve geospatial problems at the poles
Resolution • Temporal Resolution Challenges with high-resolution commercial imagery. • Image size and volume • File formats (especially from U.S. Government sources) • Clouds, fog, and darkness • Bit depth and radiometric correction • Projection and terrain correction • Cost ($$$)
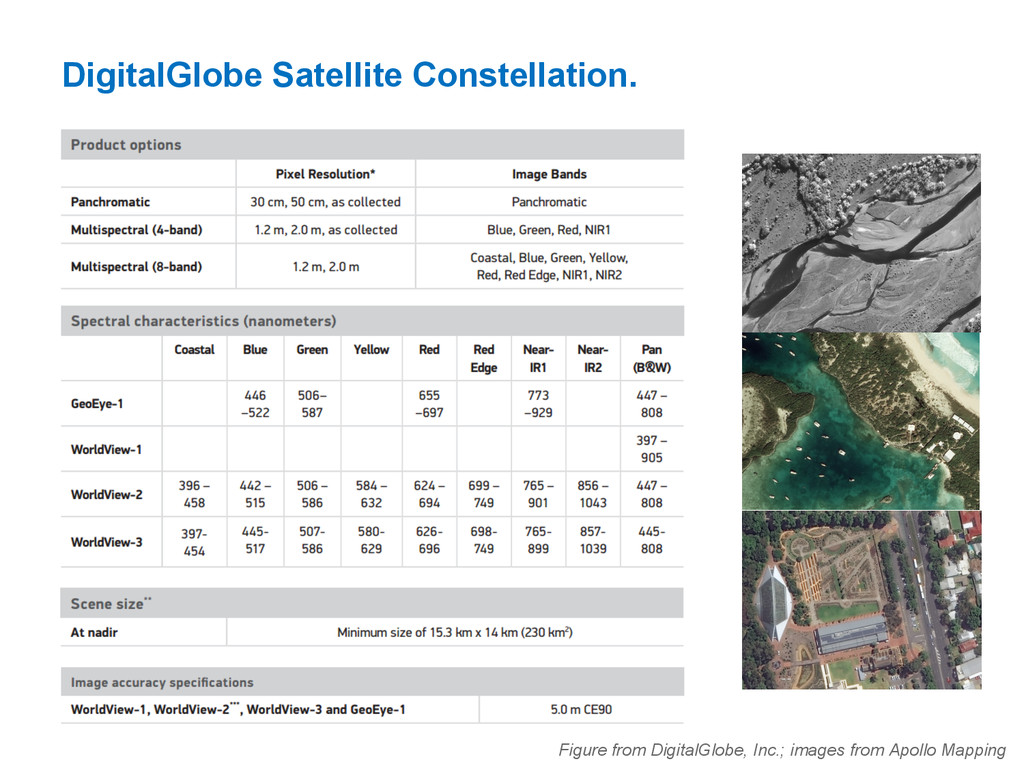
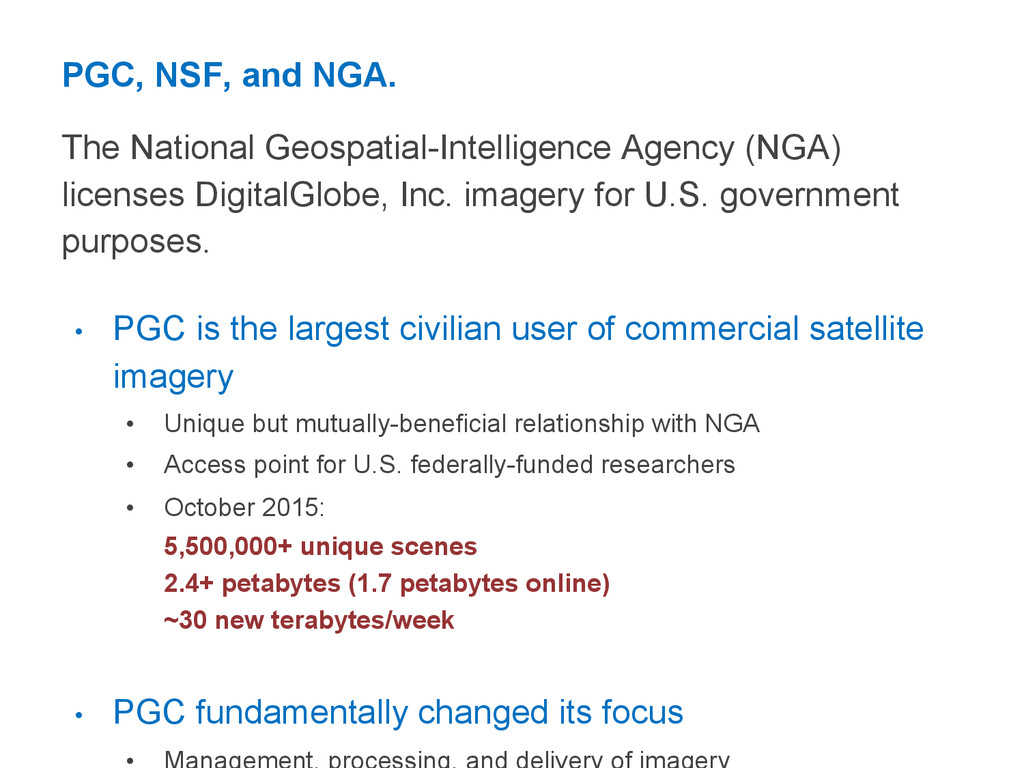
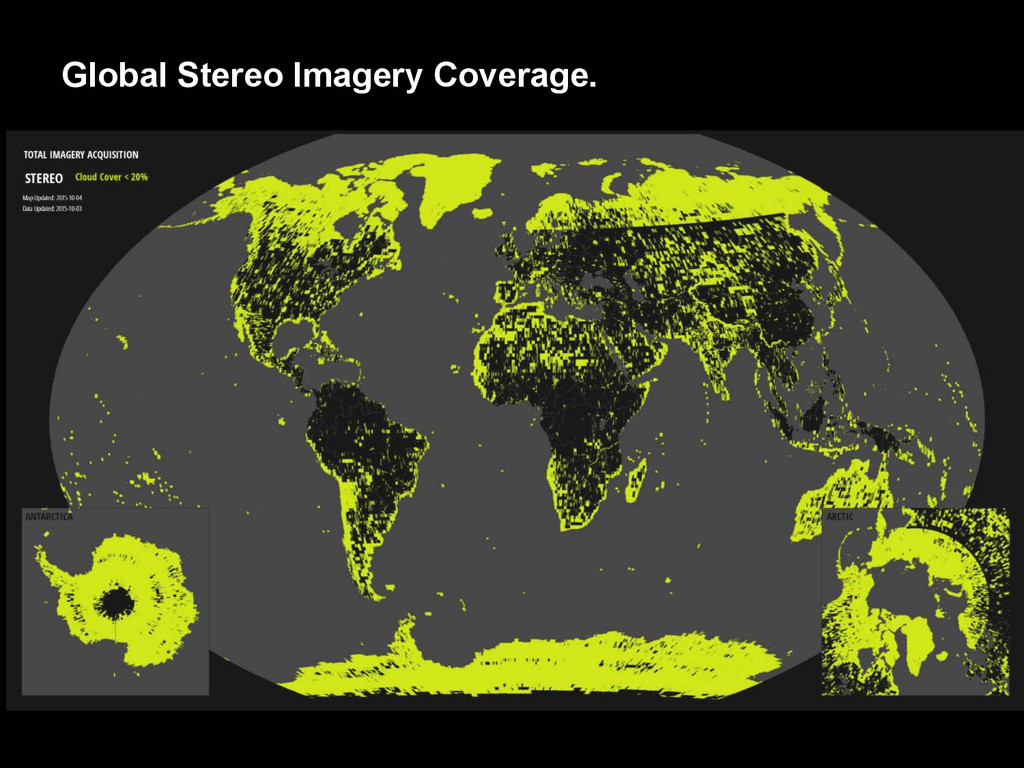
DigitalGlobe, Inc. imagery for U.S. government purposes. • PGC is the largest civilian user of commercial satellite imagery • Unique but mutually-beneficial relationship with NGA • Access point for U.S. federally-funded researchers • October 2015: 5,500,000+ unique scenes 2.4+ petabytes (1.7 petabytes online) ~30 new terabytes/week • PGC fundamentally changed its focus
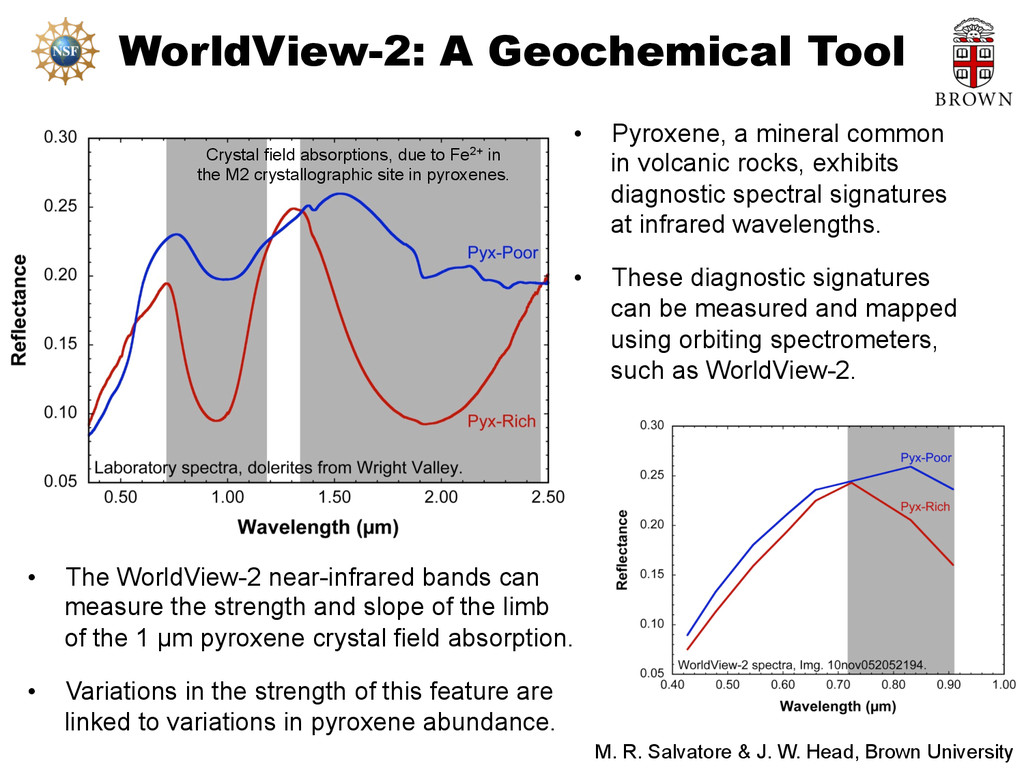
volcanic rocks, exhibits diagnostic spectral signatures at infrared wavelengths. • These diagnostic signatures can be measured and mapped using orbiting spectrometers, such as WorldView-2. • The WorldView-2 near-infrared bands can measure the strength and slope of the limb of the 1 µm pyroxene crystal field absorption. • Variations in the strength of this feature are linked to variations in pyroxene abundance. M. R. Salvatore & J. W. Head, Brown University Crystal field absorptions, due to Fe2+ in the M2 crystallographic site in pyroxenes.
1.8 m pix-1, WorldView-2 is able to map localized changes in the strength and abundance of pyroxene. • In Victoria Valley, the Basement Sill of the Ferrar Dolerite is exposed, showing variations in the distribution and abundance of pyroxene. OPX-Poor OPX-Rich The distribution of these signatures provides information regarding the magmatic evolution of the Ferrar Dolerite.
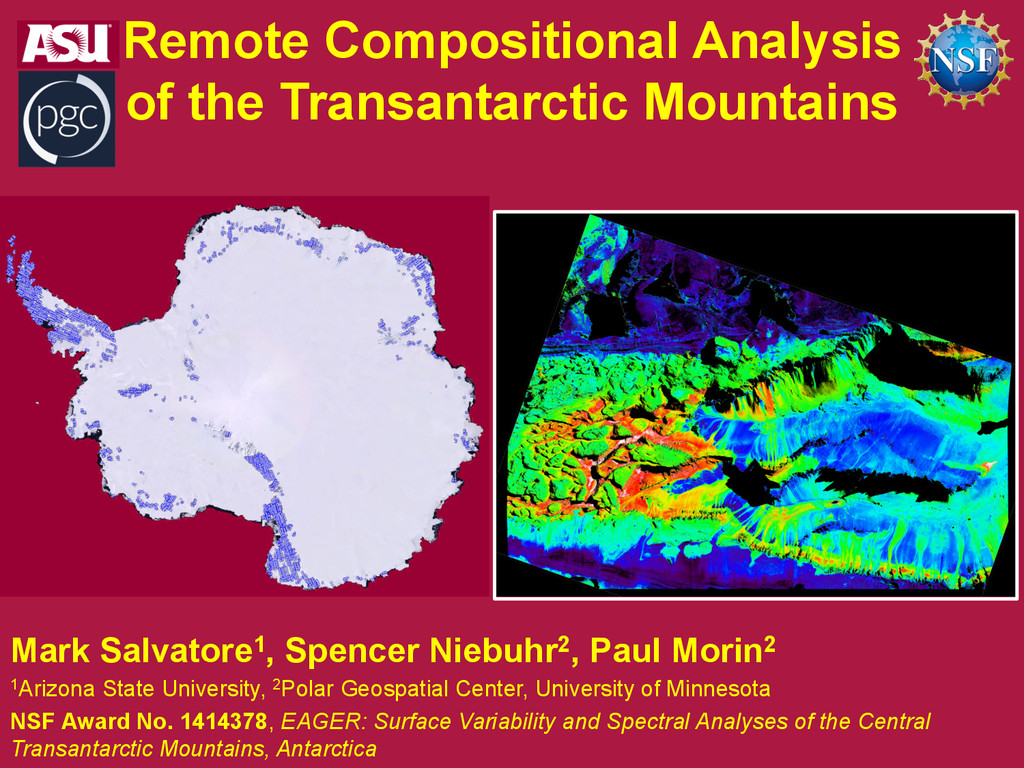
Niebuhr2, Paul Morin2 1Arizona State University, 2Polar Geospatial Center, University of Minnesota NSF Award No. 1414378, EAGER: Surface Variability and Spectral Analyses of the Central Transantarctic Mountains, Antarctica
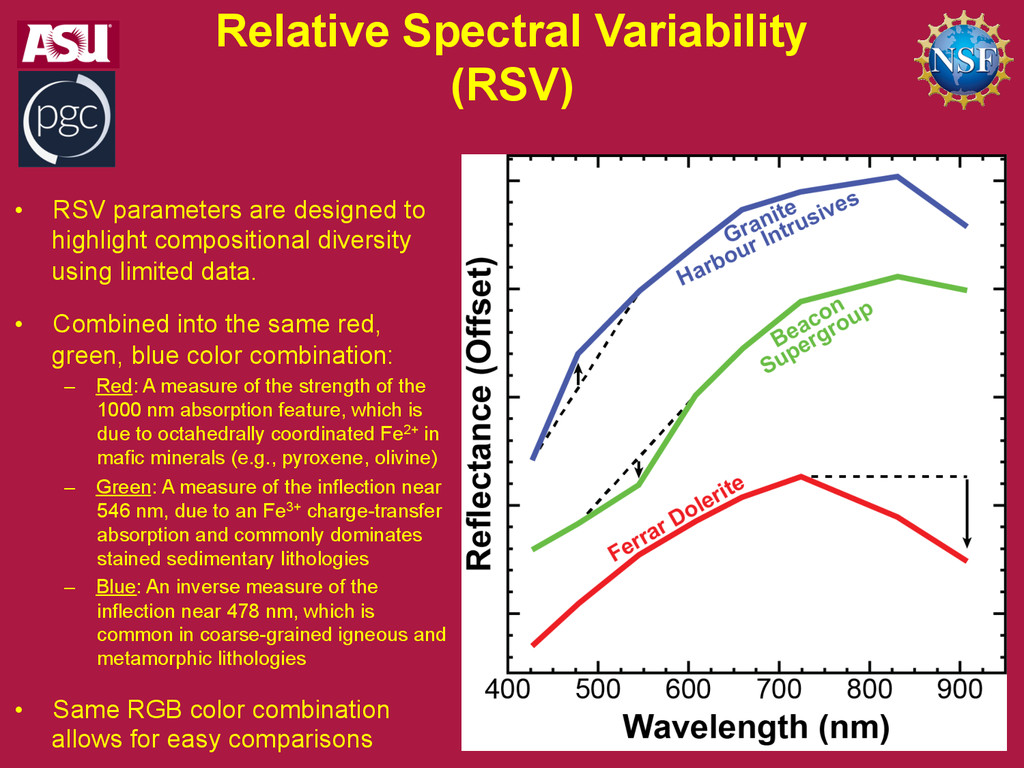
highlight compositional diversity using limited data. • Combined into the same red, green, blue color combination: – Red: A measure of the strength of the 1000 nm absorption feature, which is due to octahedrally coordinated Fe2+ in mafic minerals (e.g., pyroxene, olivine) – Green: A measure of the inflection near 546 nm, due to an Fe3+ charge-transfer absorption and commonly dominates stained sedimentary lithologies – Blue: An inverse measure of the inflection near 478 nm, which is common in coarse-grained igneous and metamorphic lithologies • Same RGB color combination allows for easy comparisons
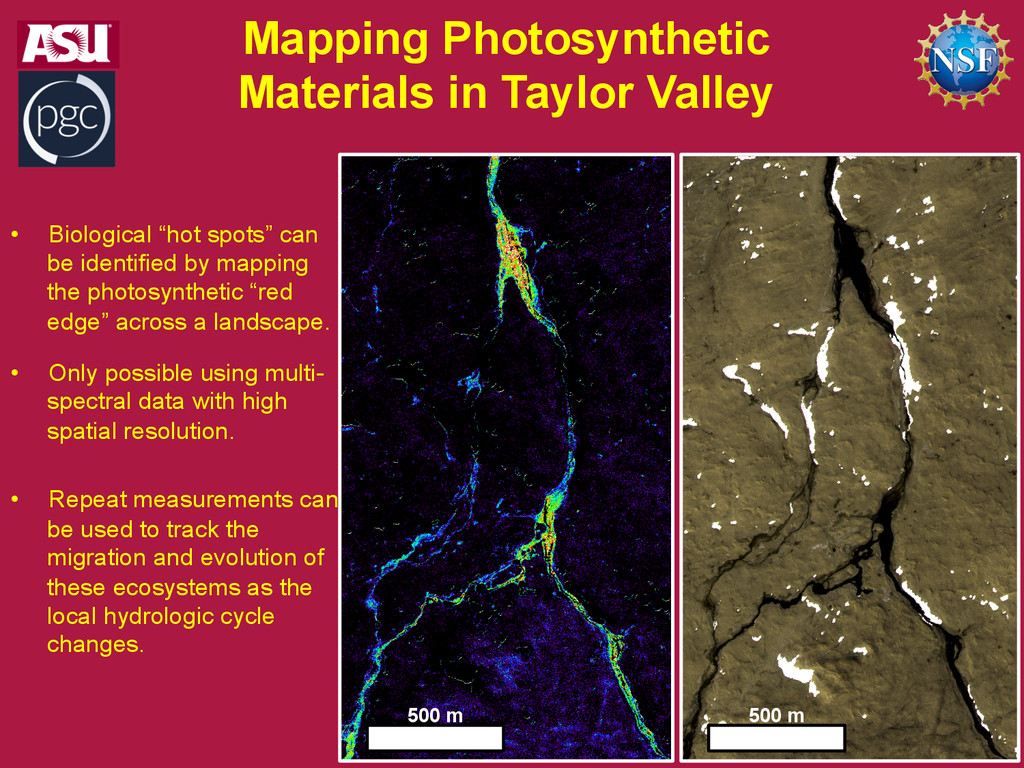
can be identified by mapping the photosynthetic “red edge” across a landscape. • Only possible using multi- spectral data with high spatial resolution. • Repeat measurements can be used to track the migration and evolution of these ecosystems as the local hydrologic cycle changes. 500 m 500 m
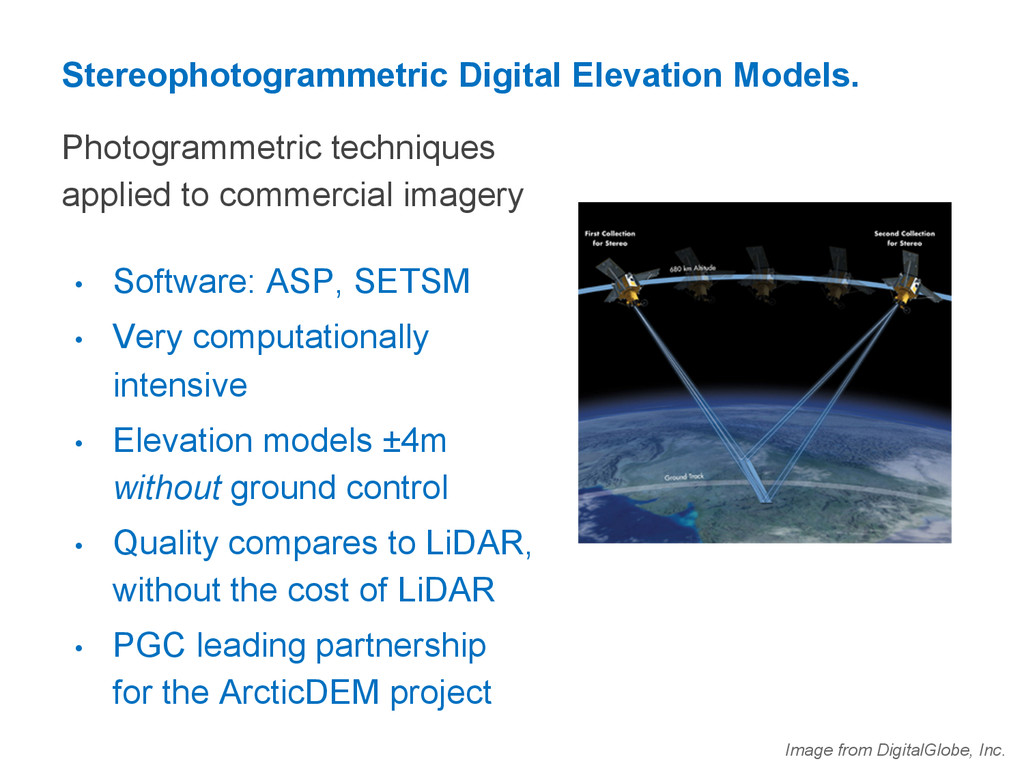
• Software: ASP, SETSM • Very computationally intensive • Elevation models ±4m without ground control • Quality compares to LiDAR, without the cost of LiDAR • PGC leading partnership for the ArcticDEM project Image from DigitalGlobe, Inc.
Where? For Who? Why is this important? High-resolution, commercial satellite imagery; derived products such as elevation models, mosaics, or map products Petabytes… and growing Complete coverage of Antarctica and the Arctica; global archive increasing; perpetual acquisitions United States federally-funded (polar) researchers Established a connection to advance science through a U.S. government resource; innovation and automation for a relatively small cost
![Brad Herried [email protected] Polar Geospatial Center, University of Minnesota @herried](https://files.speakerdeck.com/presentations/5f97fc588c394564ab588be8190ae1c8/slide_47.jpg)