Alice Rühl, Penn State University
Scott Pezanowski, Penn State University
Frank Hardisty, Penn State University
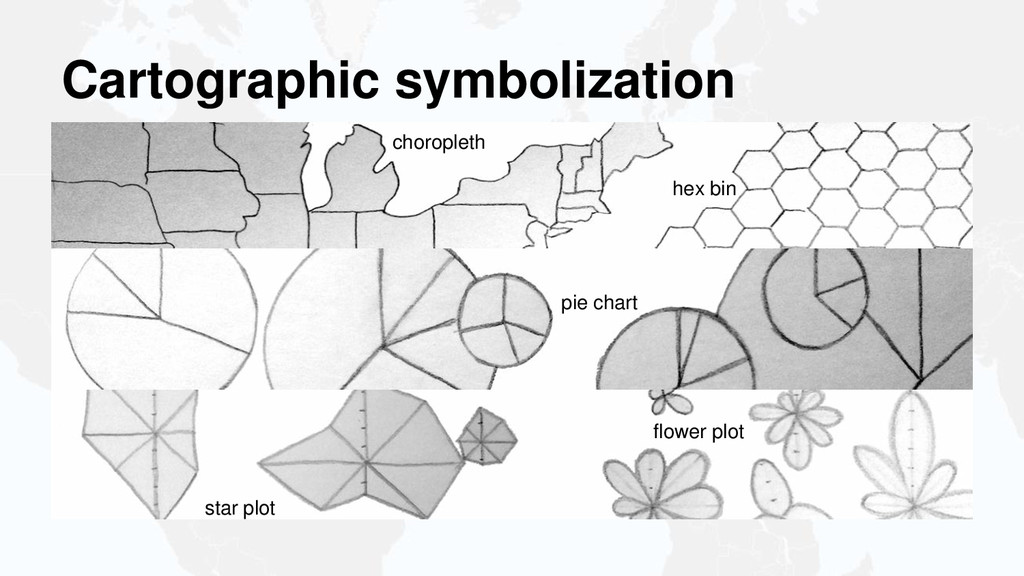
The increasing importance of Visual Analytics, particularly in response to the advent of 'big data', calls for greater attention to maps in analytic tools and applications. While maps provide a familiar, understandable interface to underlying data, not enough has been done in the field of Visual Analytics to advance the design and usage of maps.
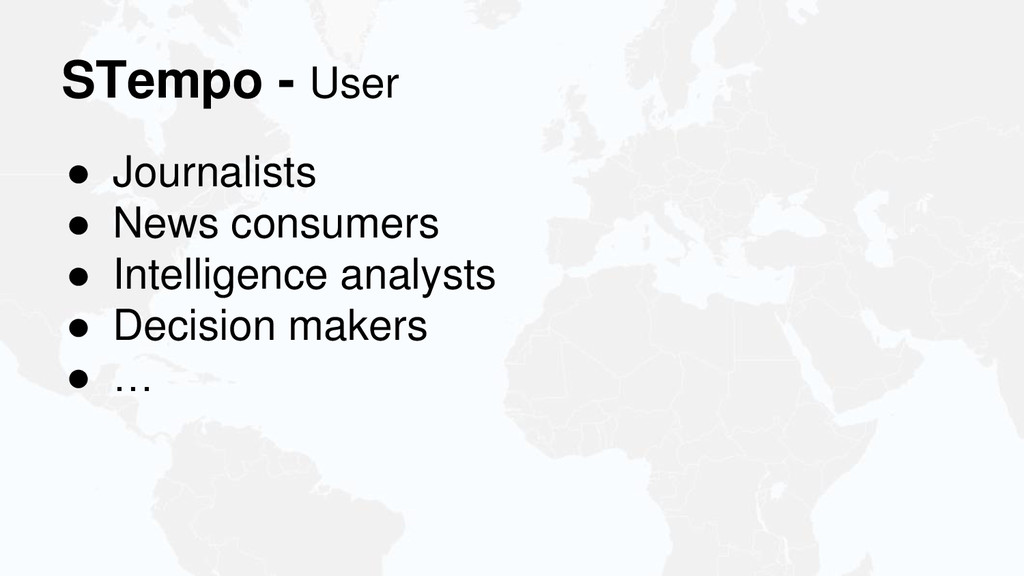
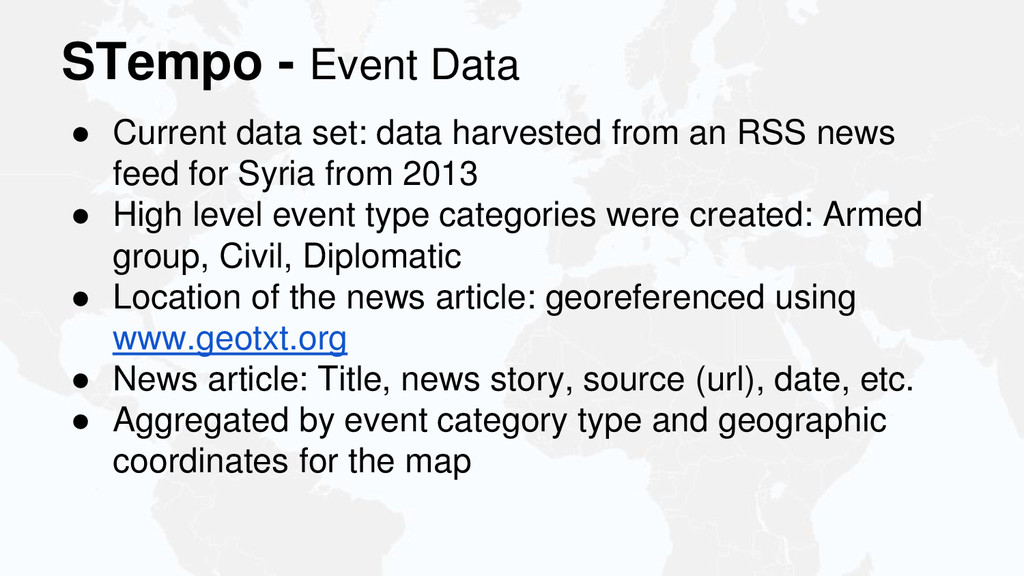
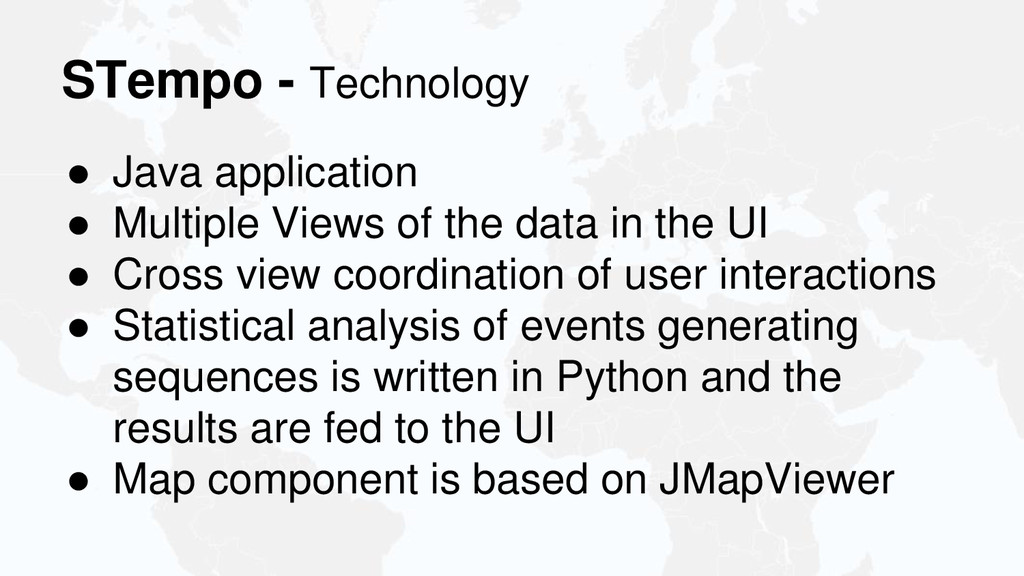
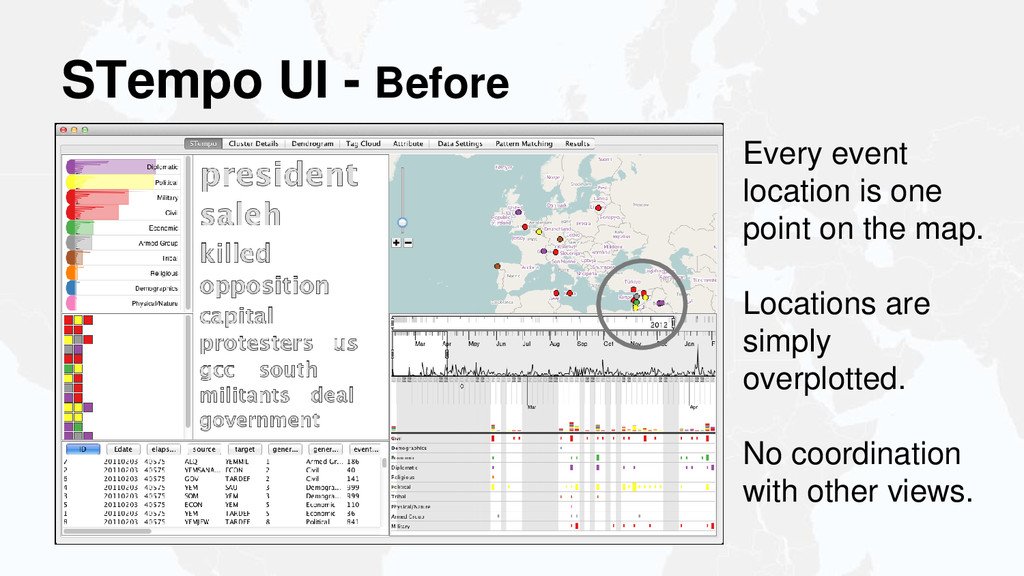
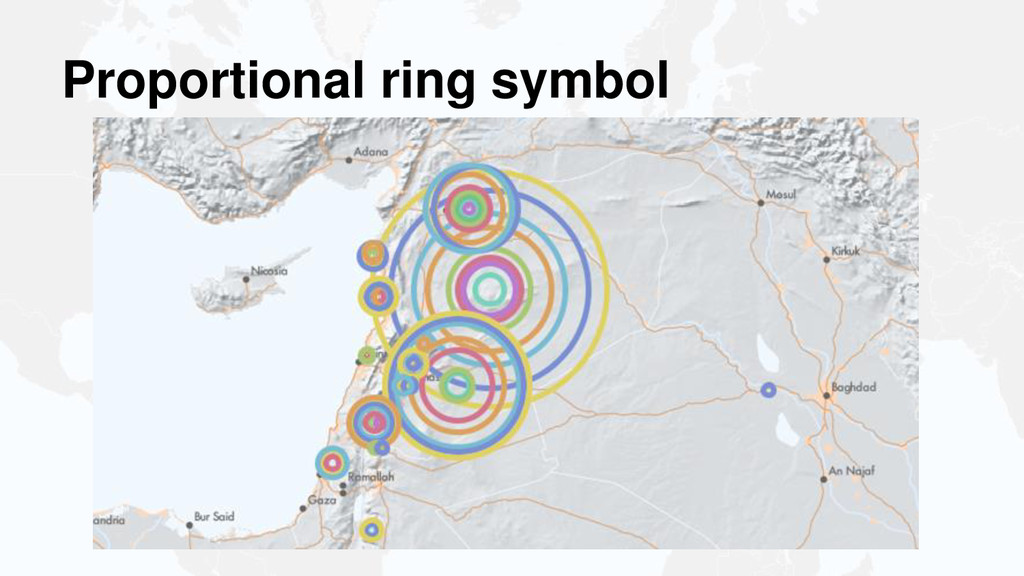
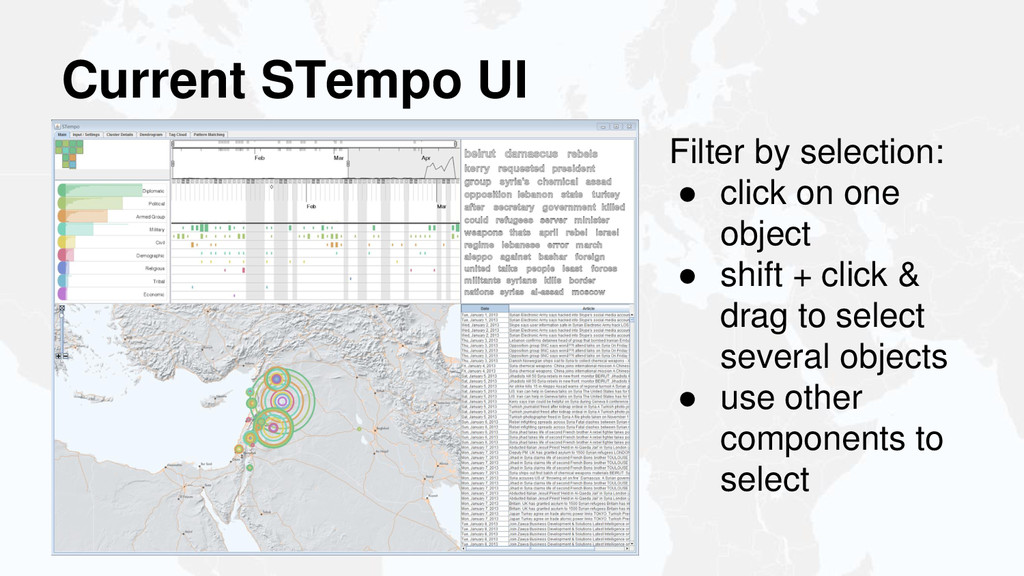
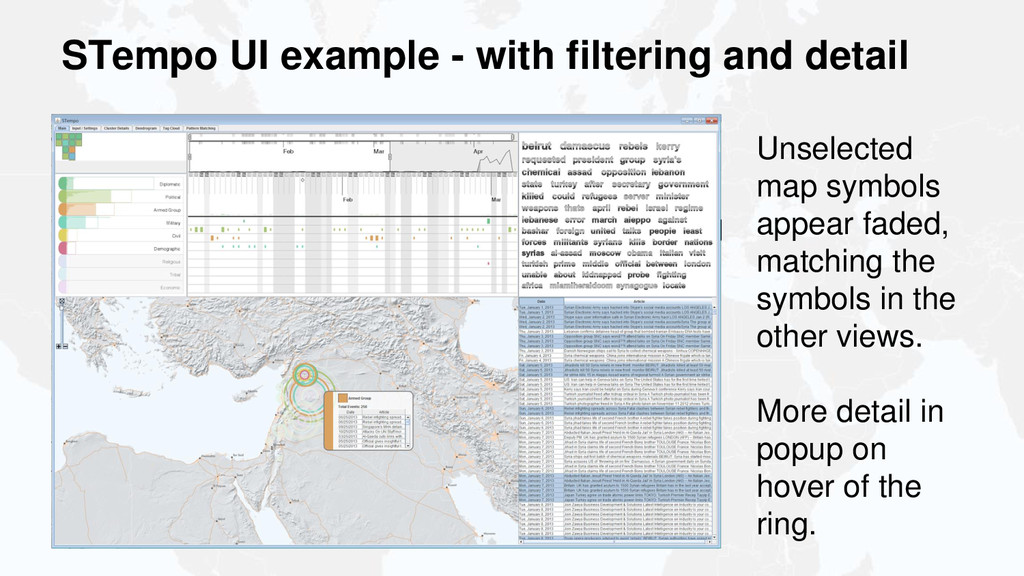
This study explores the development of map components within multi-view applications using multivariate and zoom-level dependent representations of news event data. Integrated in the system with a timeline, a word cloud and other view components, we consider the traditional 'rules' of cartography as well as aspects of human-computer interaction and interactive design research. This allows users to efficiently explore complex spatio-temporal data. Our approach was validated by re-developing the mapping component inside STempo, a project developed at the GeoVISTA Center, Pennsylvania State University.