the problem space • Symmetric ◦ Instances are identical with respect to form and function • Fault-tolerant ◦ Handle failures seamlessly through built-in redundancy • Decentralized ◦ System is self-organizing and lacks any centralized control • Incrementally Scalable ◦ Capacity can be introduced gradually • Operational Simplicity ◦ Easy to deploy, no special hardware, no synchronized clocks, etc.
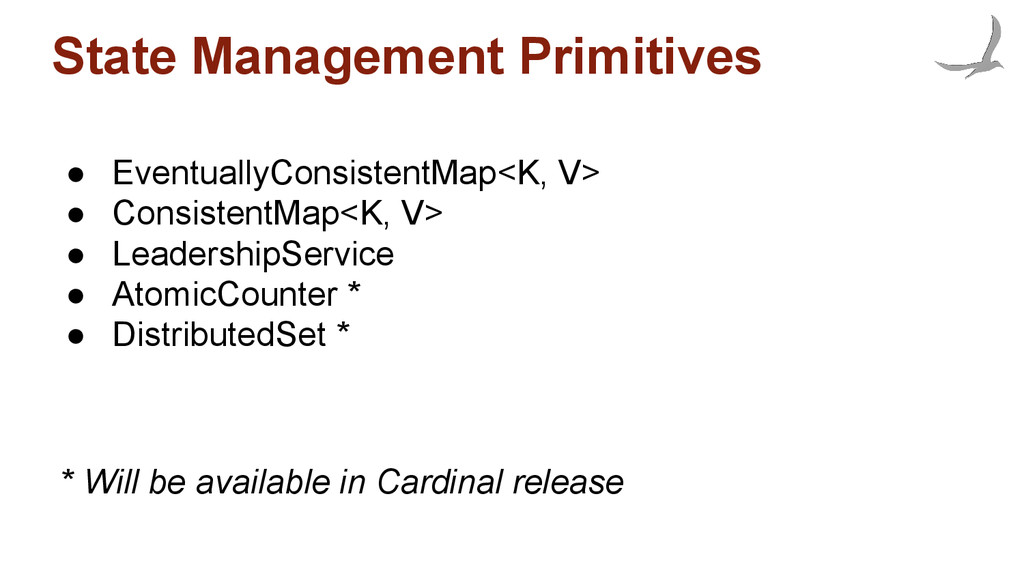
at scale • Match problems to solutions that can meet their consistency/availability/durability needs • Provide strong consistency at scale • Expose distributed state management and coordination primitives as key application building blocks
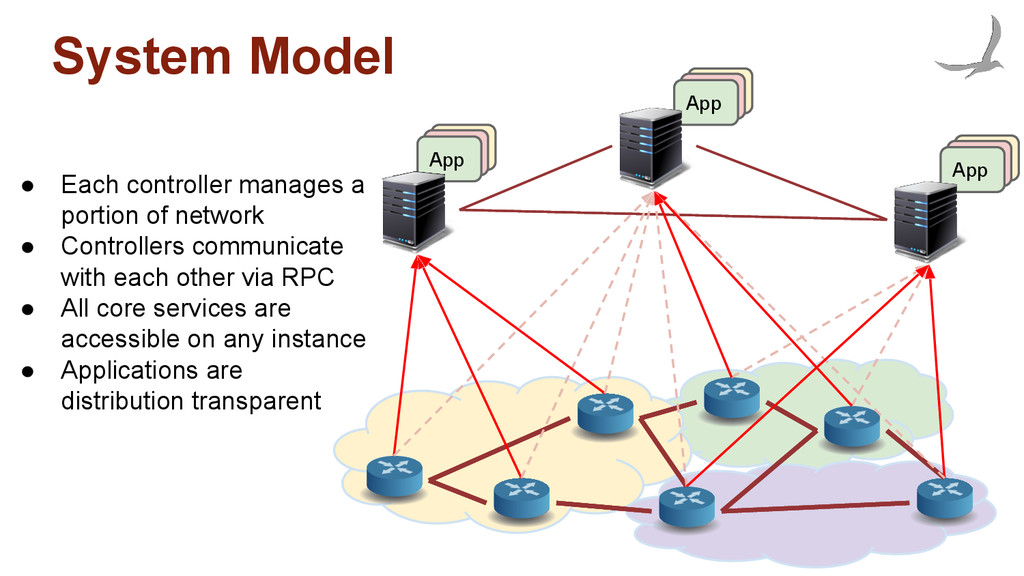
Model • Each controller manages a portion of network • Controllers communicate with each other via RPC • All core services are accessible on any instance • Applications are distribution transparent
single controller has direct visibility over entire network • Reasonable size ◦ can fit into main memory on a given controller • Read-intensive ◦ low latency access to GNV is critical • Consistent with Environment ◦ incorporate network updates as soon as possible
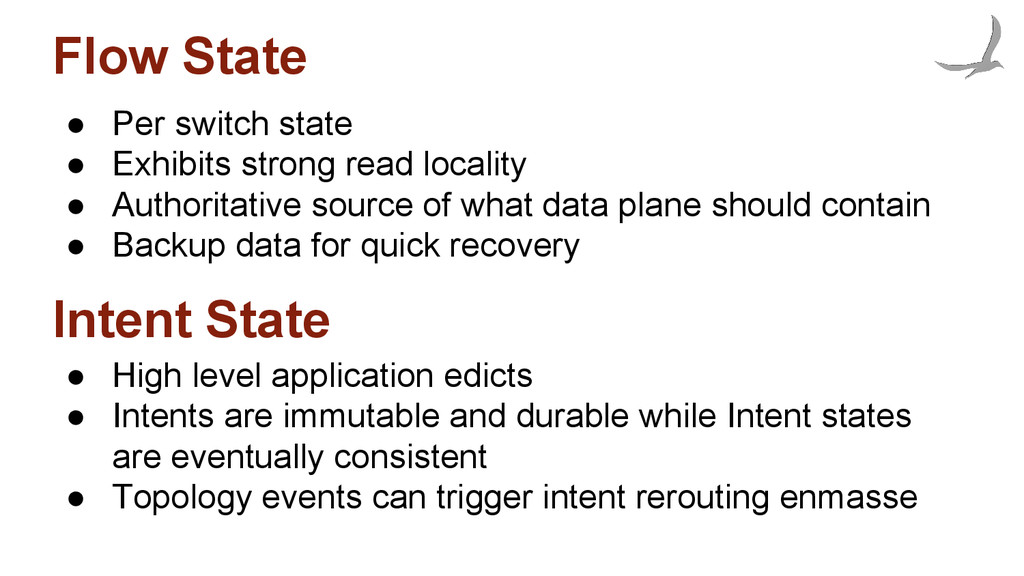
locality • Authoritative source of what data plane should contain • Backup data for quick recovery • High level application edicts • Intents are immutable and durable while Intent states are eventually consistent • Topology events can trigger intent rerouting enmasse Intent State
Backup location is the node that will most likely succeed the current master. • Fully replicated using an Eventually Consistent Map • Partitioned Logical Queues enable synchronization free execution Intent State
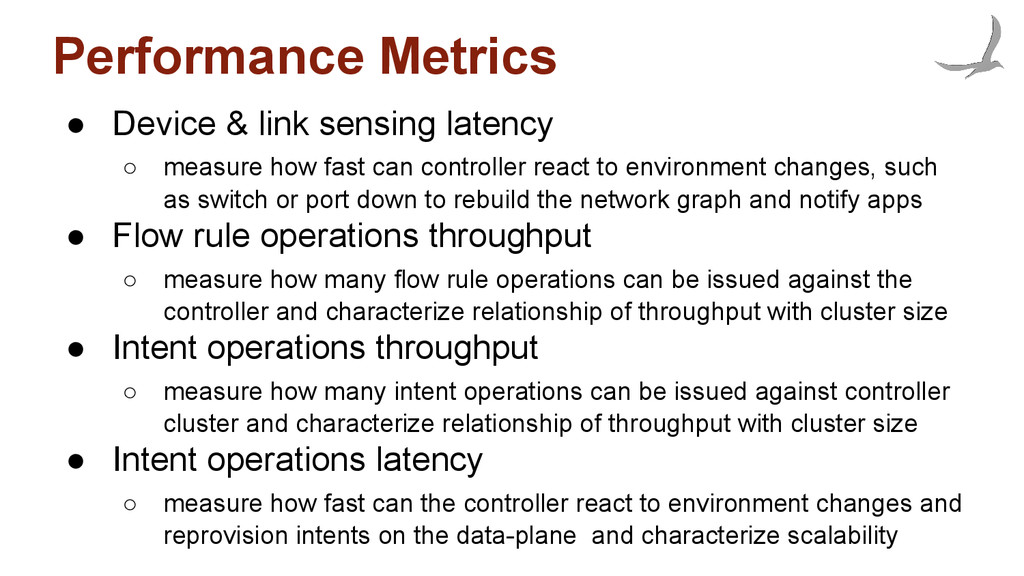
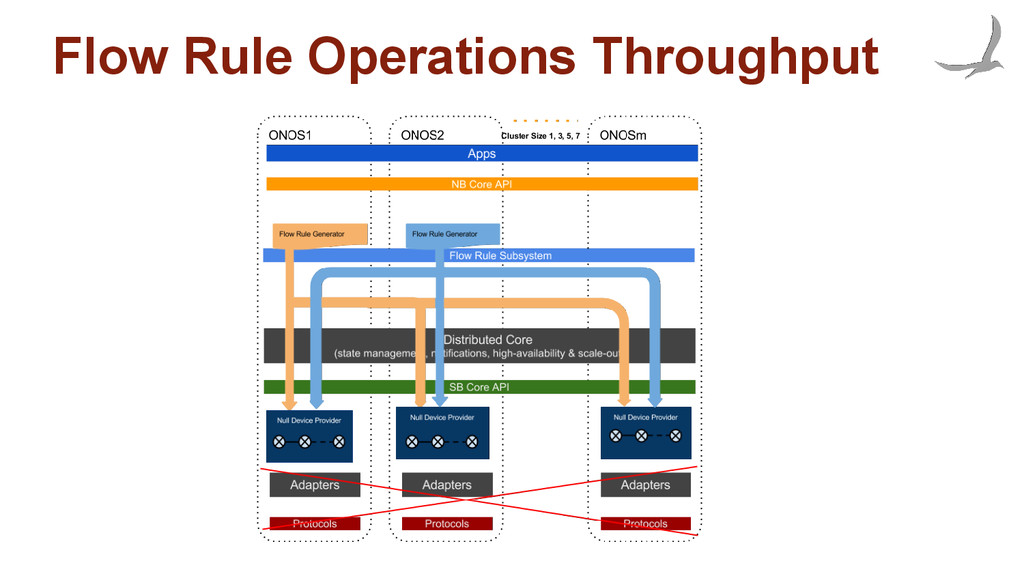
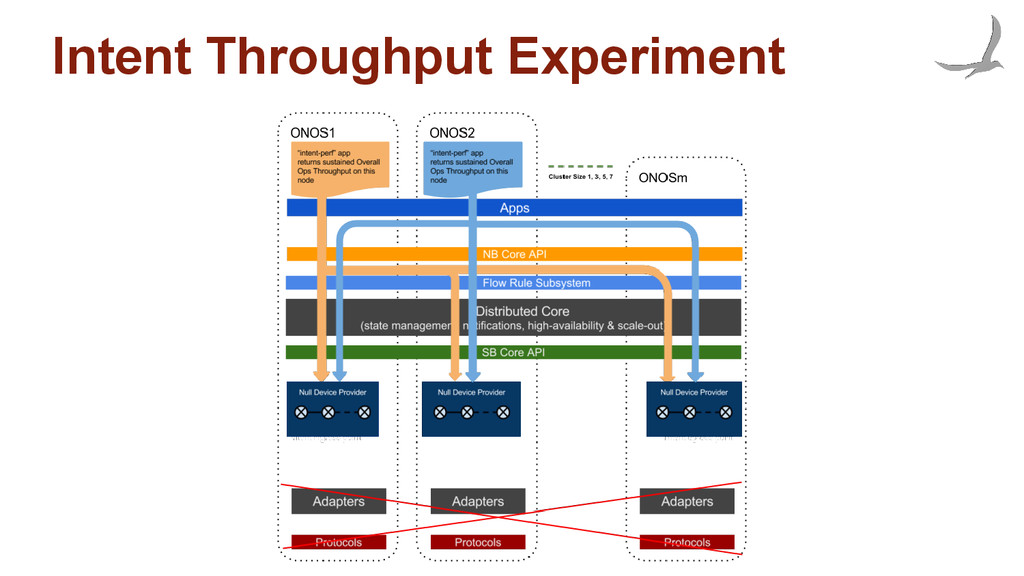
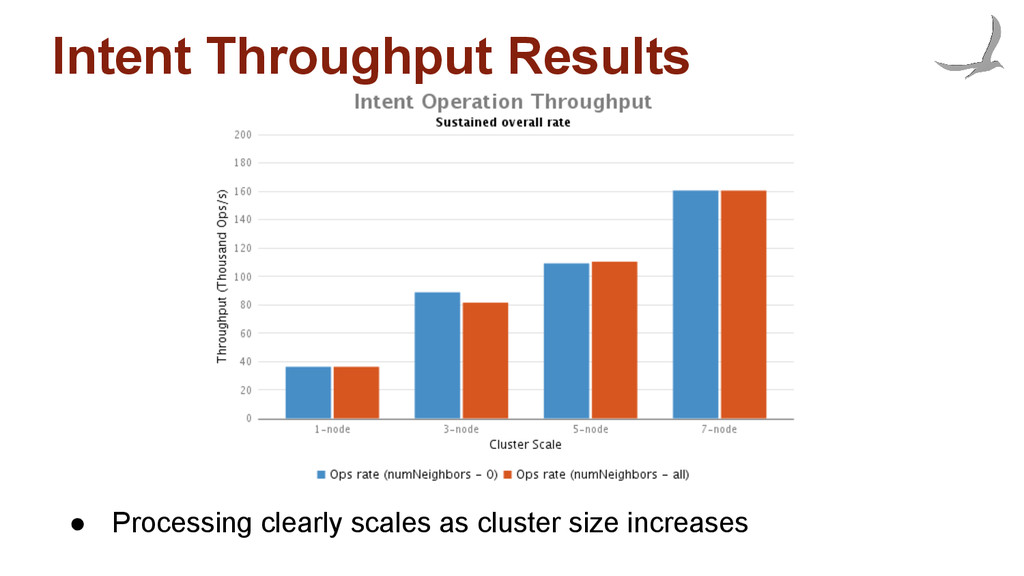
how fast can controller react to environment changes, such as switch or port down to rebuild the network graph and notify apps • Flow rule operations throughput ◦ measure how many flow rule operations can be issued against the controller and characterize relationship of throughput with cluster size • Intent operations throughput ◦ measure how many intent operations can be issued against controller cluster and characterize relationship of throughput with cluster size • Intent operations latency ◦ measure how fast can the controller react to environment changes and reprovision intents on the data-plane and characterize scalability
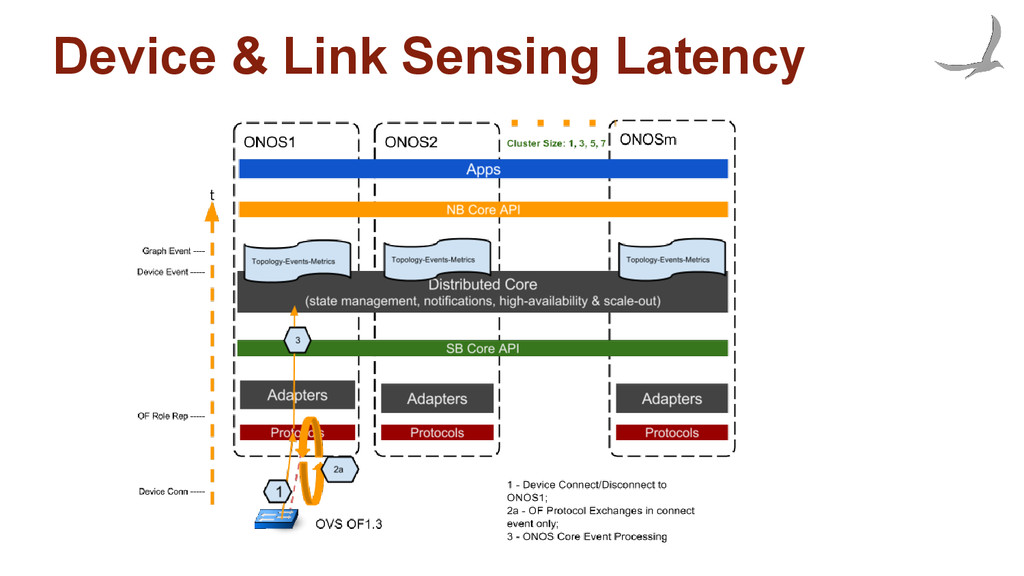
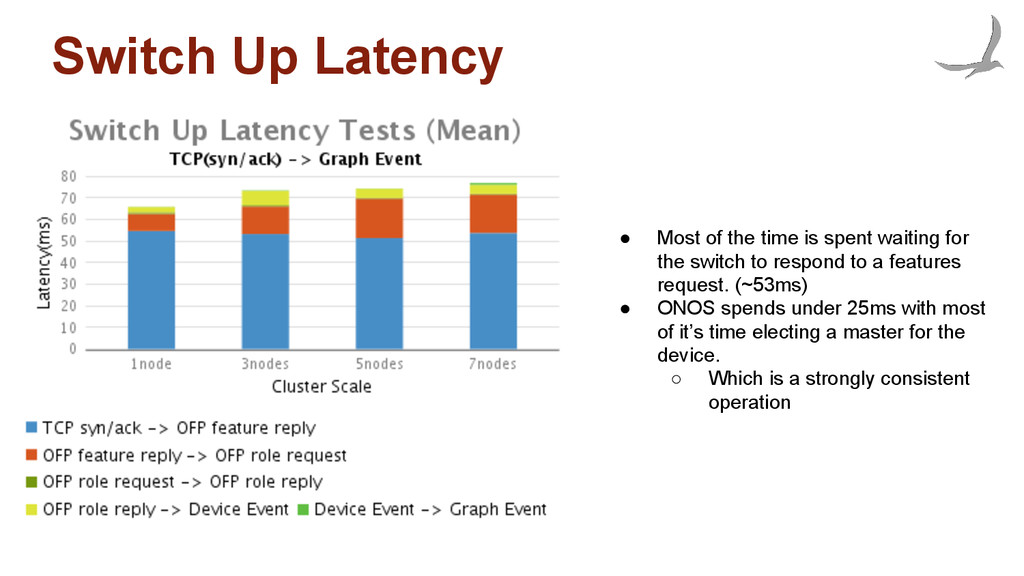
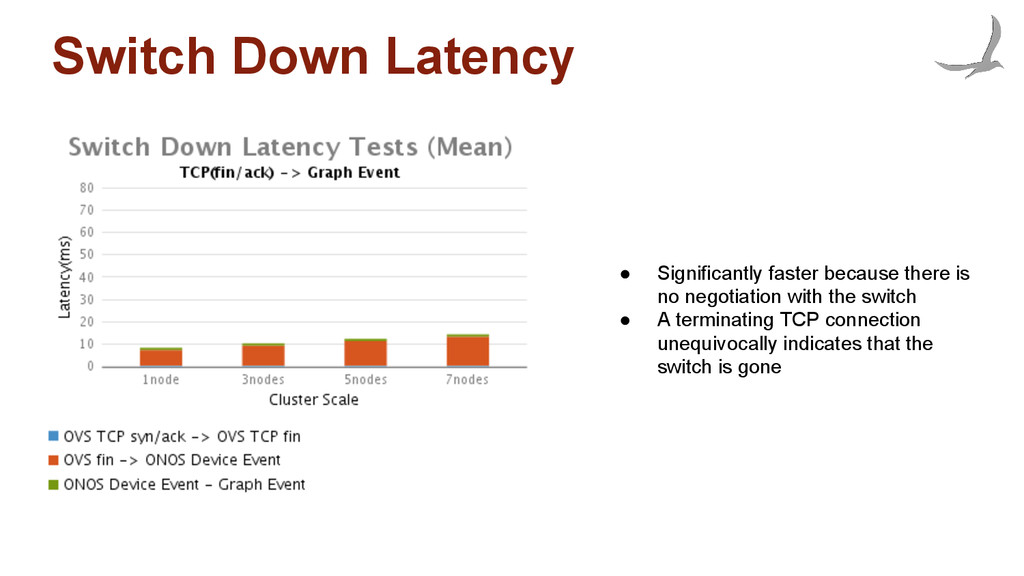
management on latency ◦ react faster to negative events than positive ones • Results consist of multiple parts: ◦ Switch up latency ◦ Switch down latency ◦ Link up/down latency • Experimental setup: ◦ Two OVS switches connected to each other. ◦ Events are generated from the switch ◦ Elapsed time is measured from the switch until ONOS triggers a corresponding topology event
waiting for the switch to respond to a features request. (~53ms) • ONOS spends under 25ms with most of it’s time electing a master for the device. ◦ Which is a strongly consistent operation
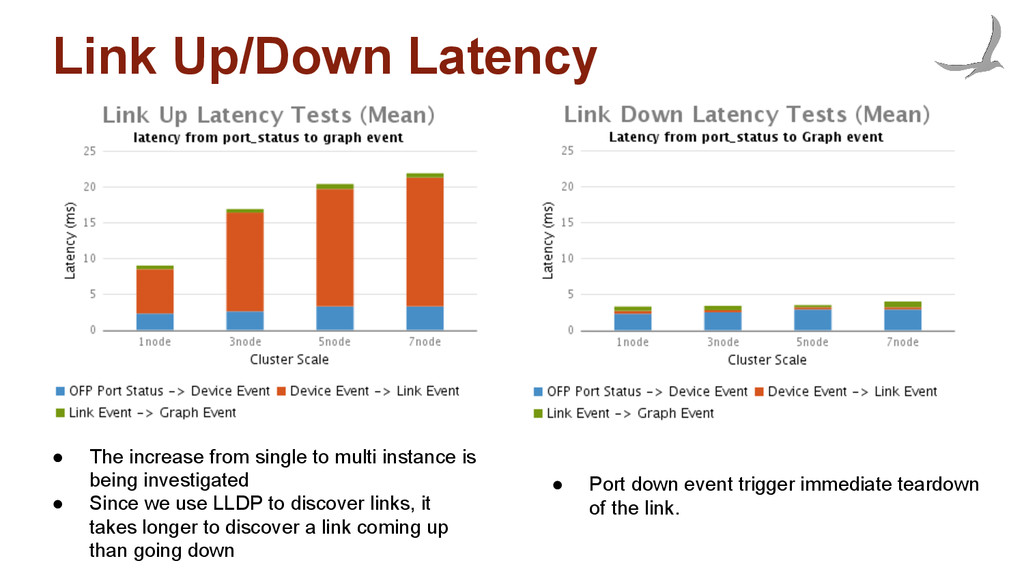
instance is being investigated • Since we use LLDP to discover links, it takes longer to discover a link coming up than going down • Port down event trigger immediate teardown of the link.
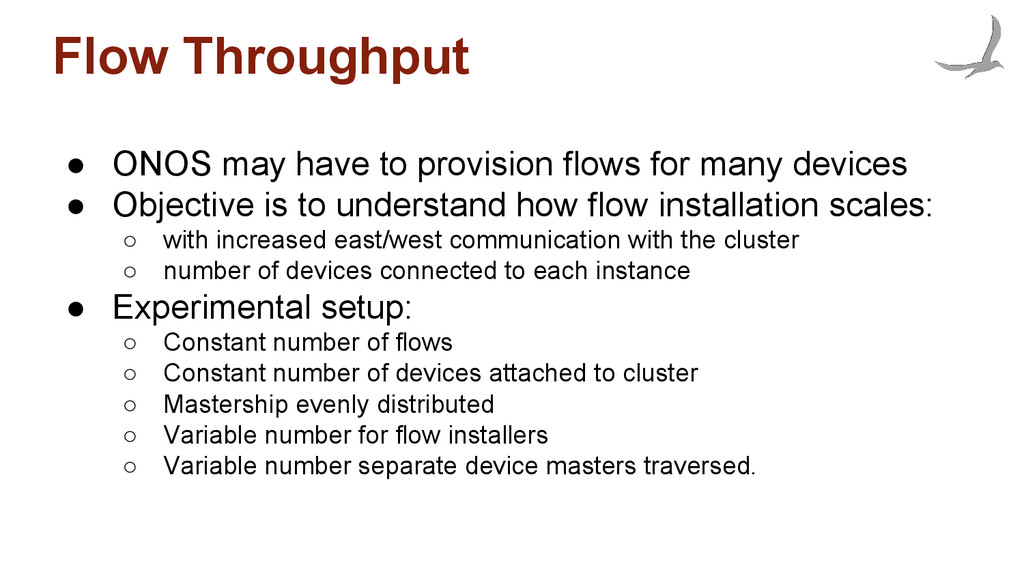
many devices • Objective is to understand how flow installation scales: ◦ with increased east/west communication with the cluster ◦ number of devices connected to each instance • Experimental setup: ◦ Constant number of flows ◦ Constant number of devices attached to cluster ◦ Mastership evenly distributed ◦ Variable number for flow installers ◦ Variable number separate device masters traversed.
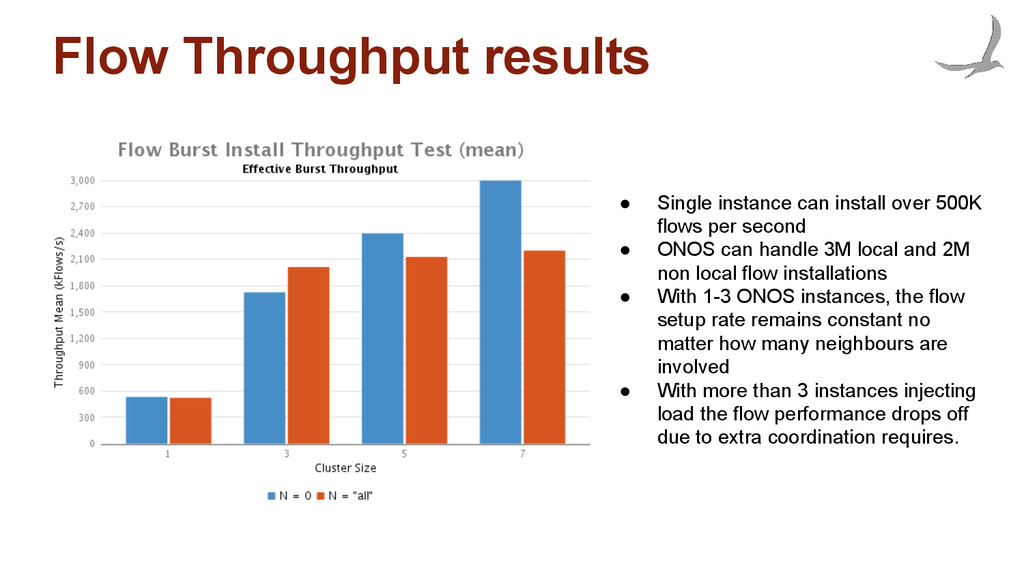
flows per second • ONOS can handle 3M local and 2M non local flow installations • With 1-3 ONOS instances, the flow setup rate remains constant no matter how many neighbours are involved • With more than 3 instances injecting load the flow performance drops off due to extra coordination requires.
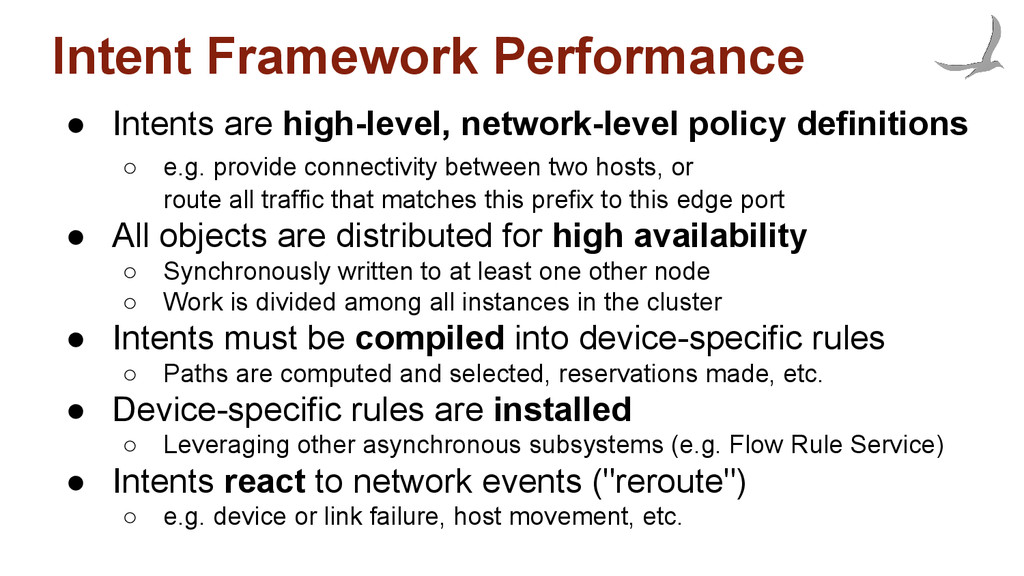
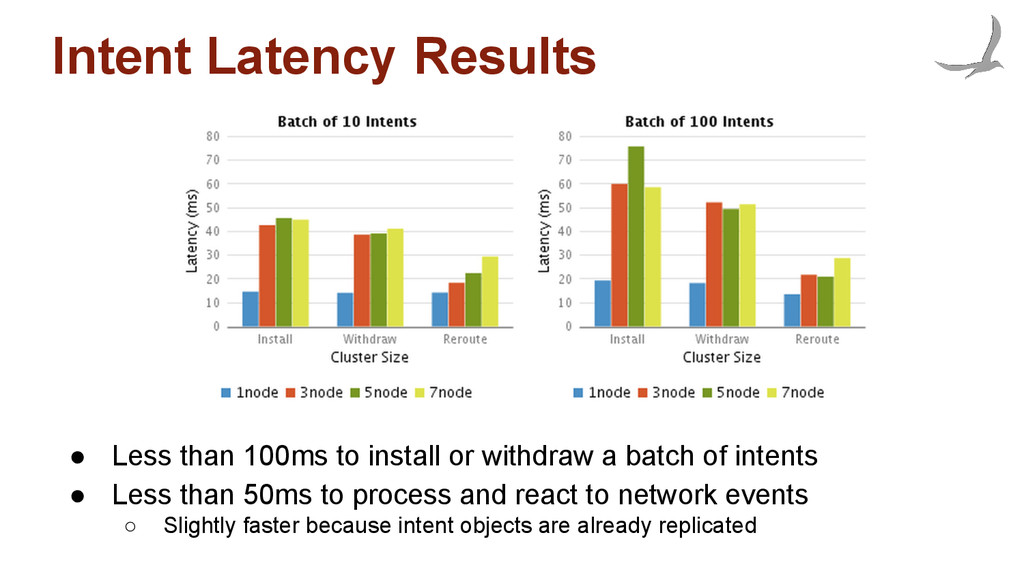
◦ e.g. provide connectivity between two hosts, or route all traffic that matches this prefix to this edge port • All objects are distributed for high availability ◦ Synchronously written to at least one other node ◦ Work is divided among all instances in the cluster • Intents must be compiled into device-specific rules ◦ Paths are computed and selected, reservations made, etc. • Device-specific rules are installed ◦ Leveraging other asynchronous subsystems (e.g. Flow Rule Service) • Intents react to network events ("reroute") ◦ e.g. device or link failure, host movement, etc.
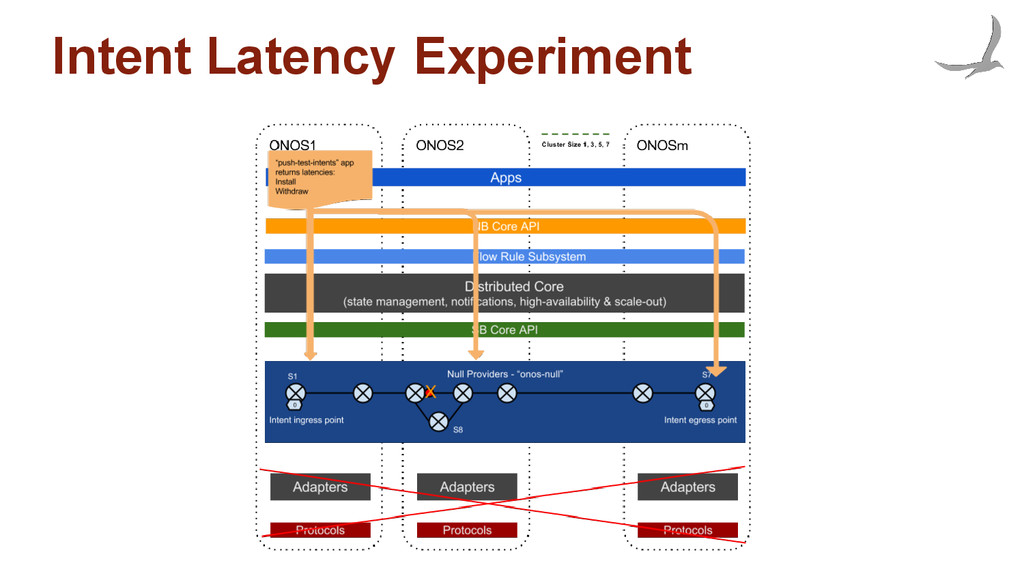
after storing the intent • After an intent has been submitted, the framework starts compiling and installing • An event is generated after the framework confirms that the policy has been written to the devices • Experiment shows how quickly an application's policy can be reflected in the network ("install" and "withdrawn"), as well as how long it takes to react to a network event ("reroute")
(e.g. forwarding decision) on an ongoing basis • Framework needs to be able to cope with a stream of requests and catch-up if it ever falls behind • Capacity needs to scale with growth of the cluster
![ONOS Distributed Core ONOS Performance Madan Jampani [email protected] May 7th,](https://files.speakerdeck.com/presentations/5f14add6bc4a4a7aae559e3ec2ed8a0c/slide_0.jpg)