HISTORIALLISESTI TÄRKEITÄ KOHTEITA. Kaupunki tutuksi mobiilisovelluksen tarkoituksena on kannustaa ihmisiä harrastamaan kulttuuria sekä antaa käyttäjilleen tiedon kaupungissa sijaitsevista nähtävyyksistä, museoista, luontopoluista, muistomerkeistä sekä muista kulttuurisesti tai historiallisesti tärkeistä kohteista.
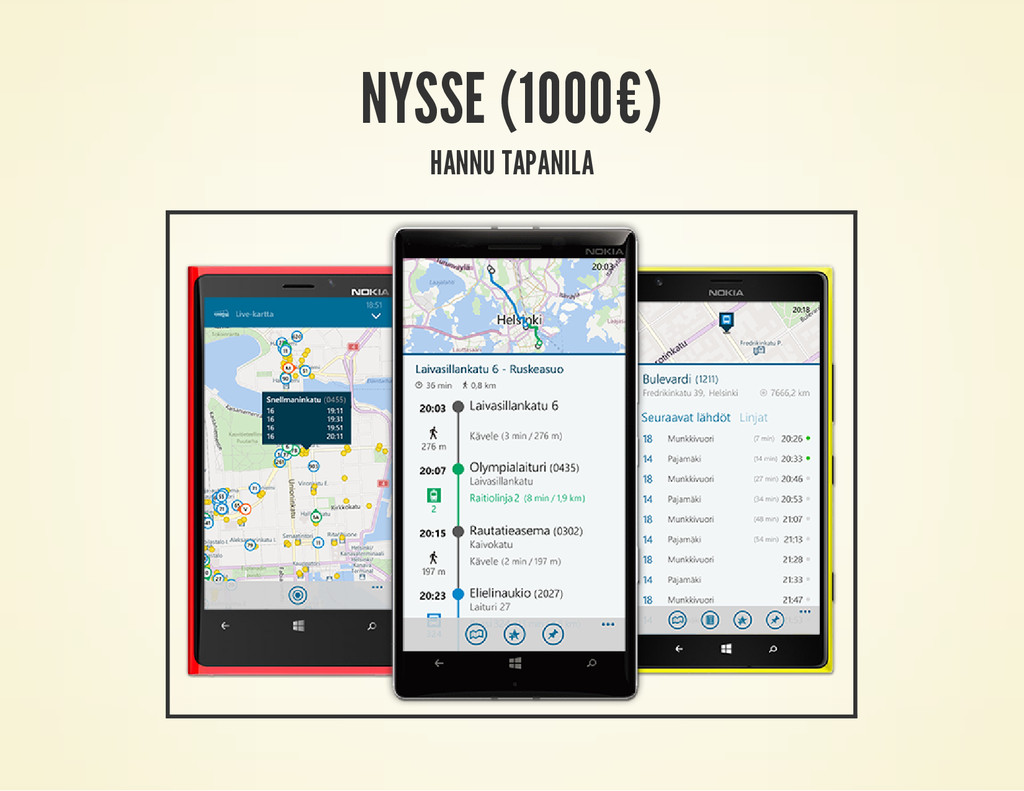
awareness and understanding on the zones, ticket products, prices, etc. 2. How to help to find the right ticket products based on individual traveling needs: home address, age and traveling preferences, but possibly also work place, hobbies, and other special needs 3. How to serve the infrequent travelers, who may not be familiar with route options to certain area 4. How to encourage and attract new customers to blue buses.
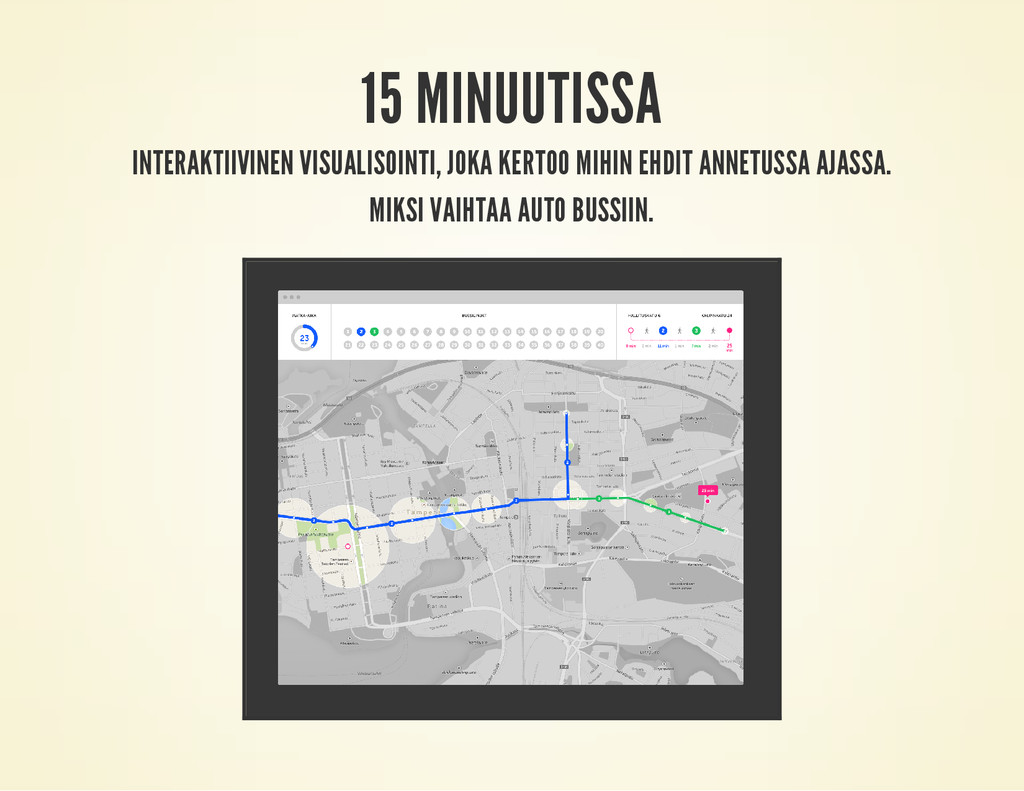
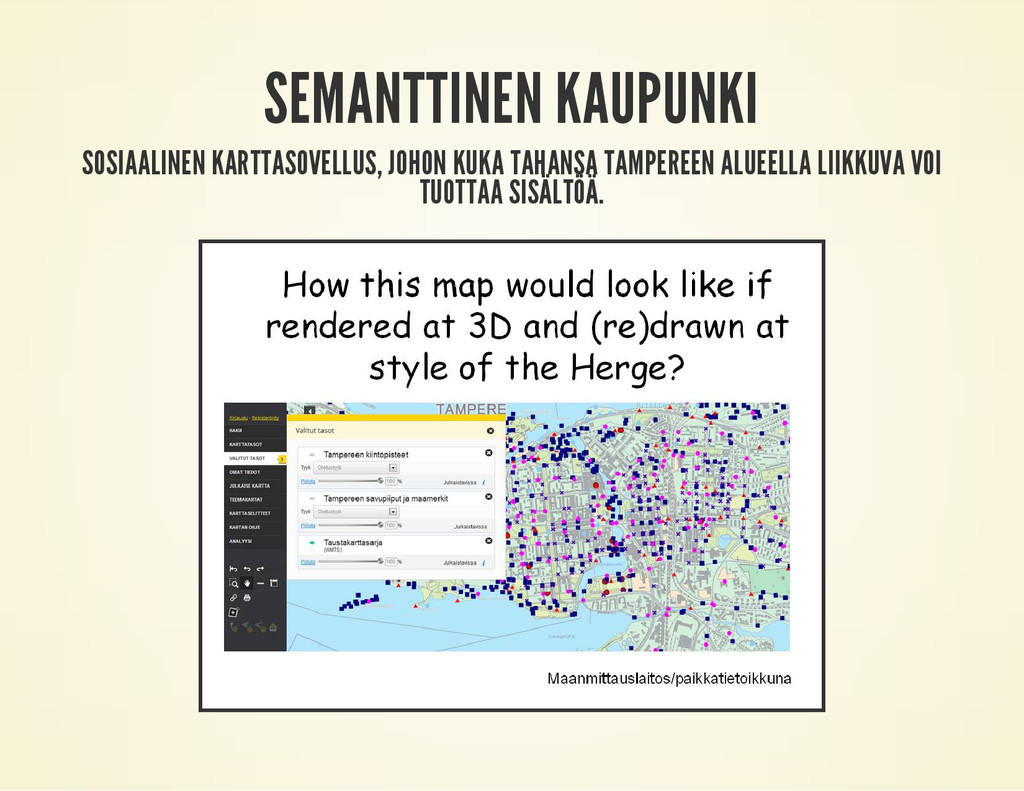
and participation among the Tampere citizens, or tourists visiting Tampere. 2. In addition to being visually appealing, the visualization should also provide with practical and insightful perspective on mobility (car traffic, public transport, people, pedestrians, bicycling, etc.) 3. Uses open data in the city of Tampere or any other available data sources, either public, proprietary or community sourced. 4. Other data sources can be utilized in the visualizations as well.