Upgrade to Pro — share decks privately, control downloads, hide ads and more …

On-Shelf Availability: Discovering Meaning in Guilty Silences

On-Shelf Availability: Discovering Meaning in Guilty Silences

Thursday, May 30, 2013 | 2 p.m. EST | Duration: 1 Hour

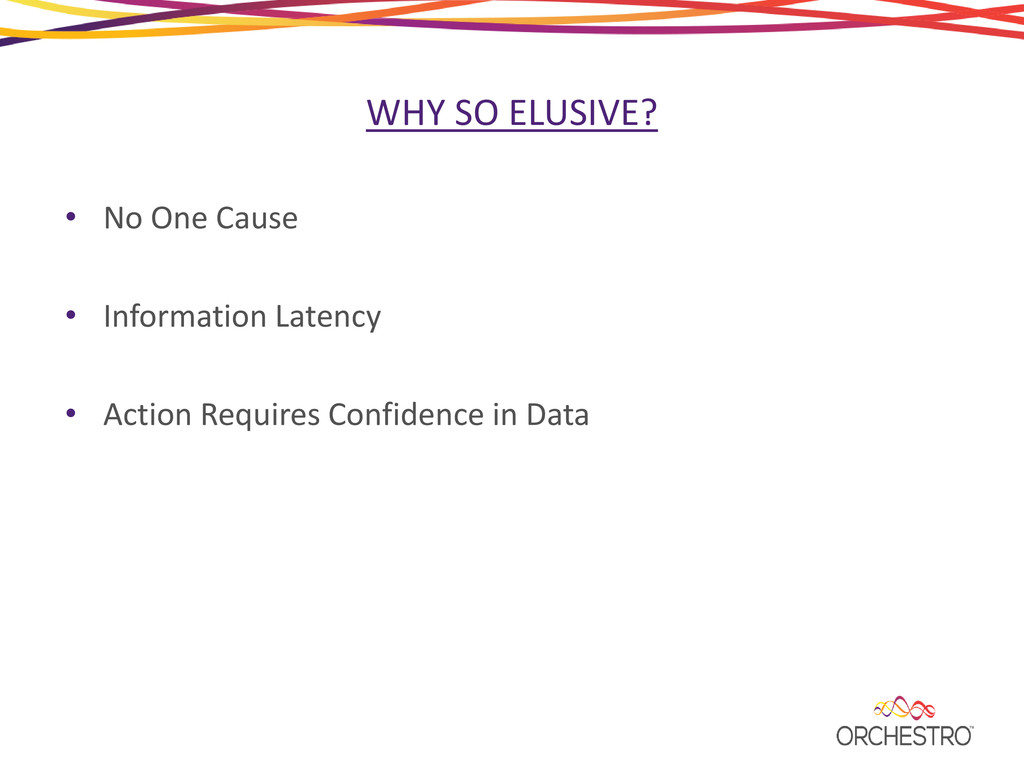
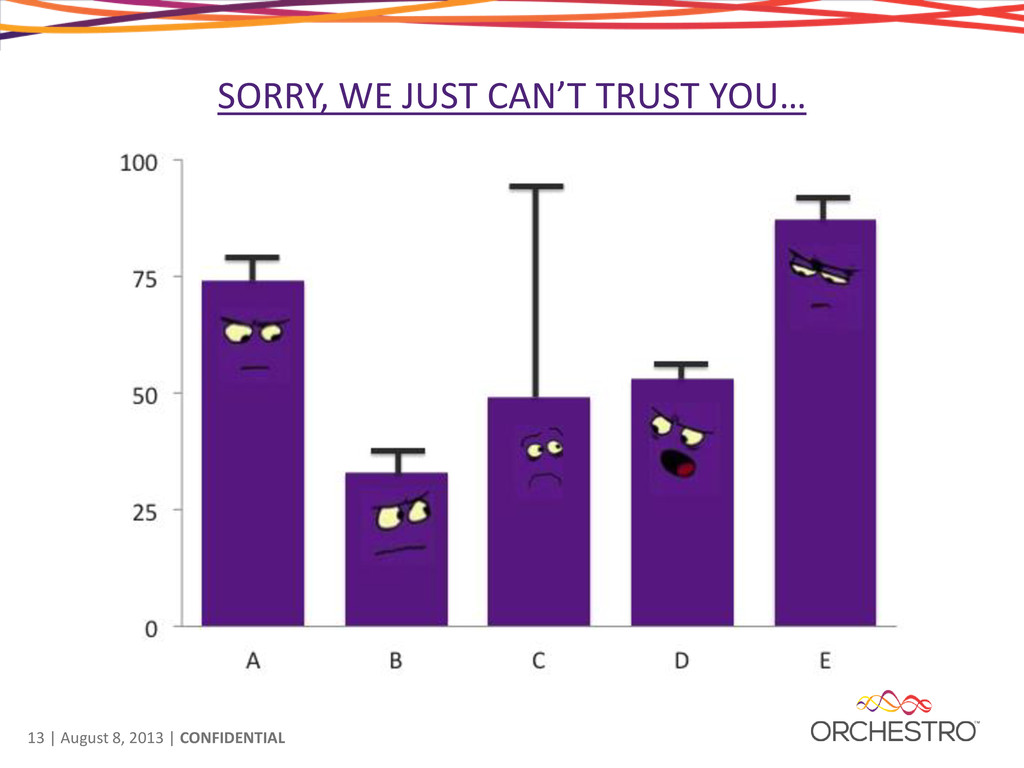
Untapped, Big Data just obscures opportunities. But as any parent knows, the noise shouldn't concern you as much as the guilty silences. The real power of analytics lies in the ability to drive different, faster and better decisions based on pattern anomalies. But traditional predictive analytical approaches have fallen short of delivering the accuracy needed to engender faith to automate execution. Why?

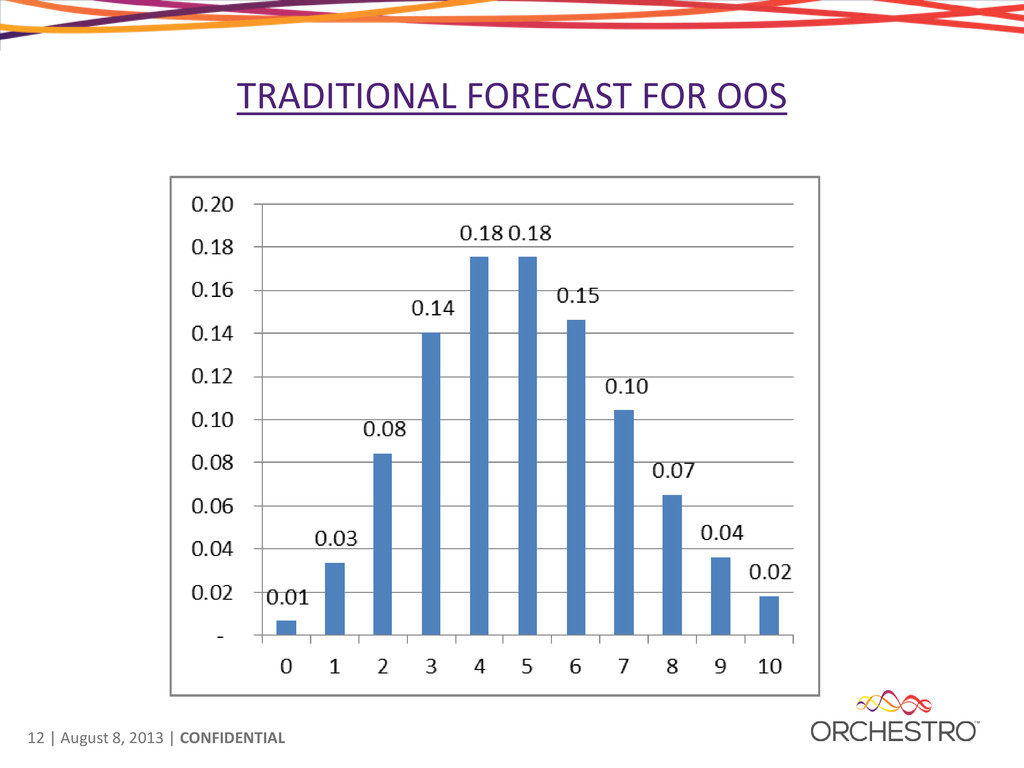
- Demand is neither constant nor consistent. It evolves, or may fluctuate seasonally, by day of the week, or day of the month.
- New products and changes in assortment impact demand for other related and competitive items.
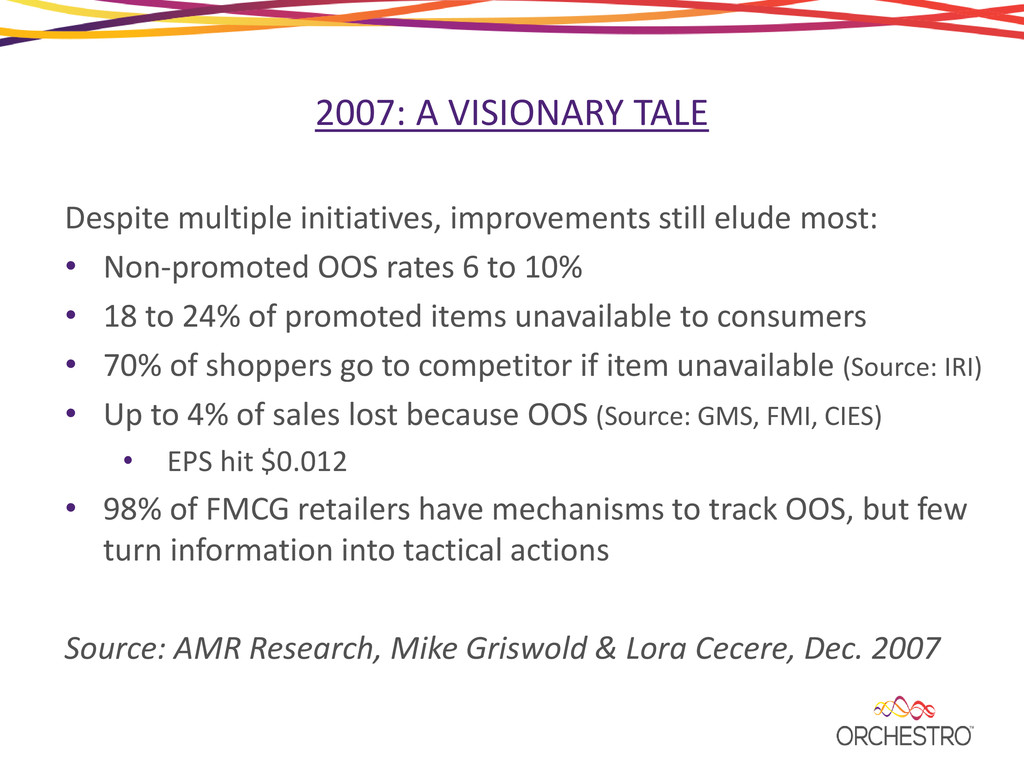
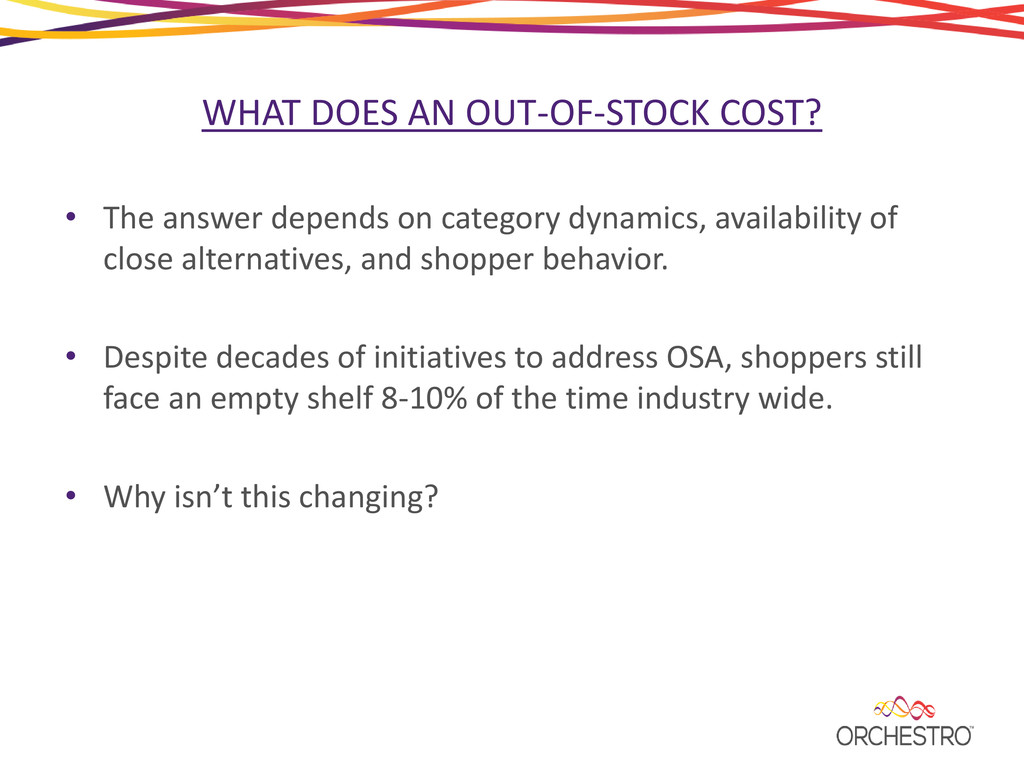
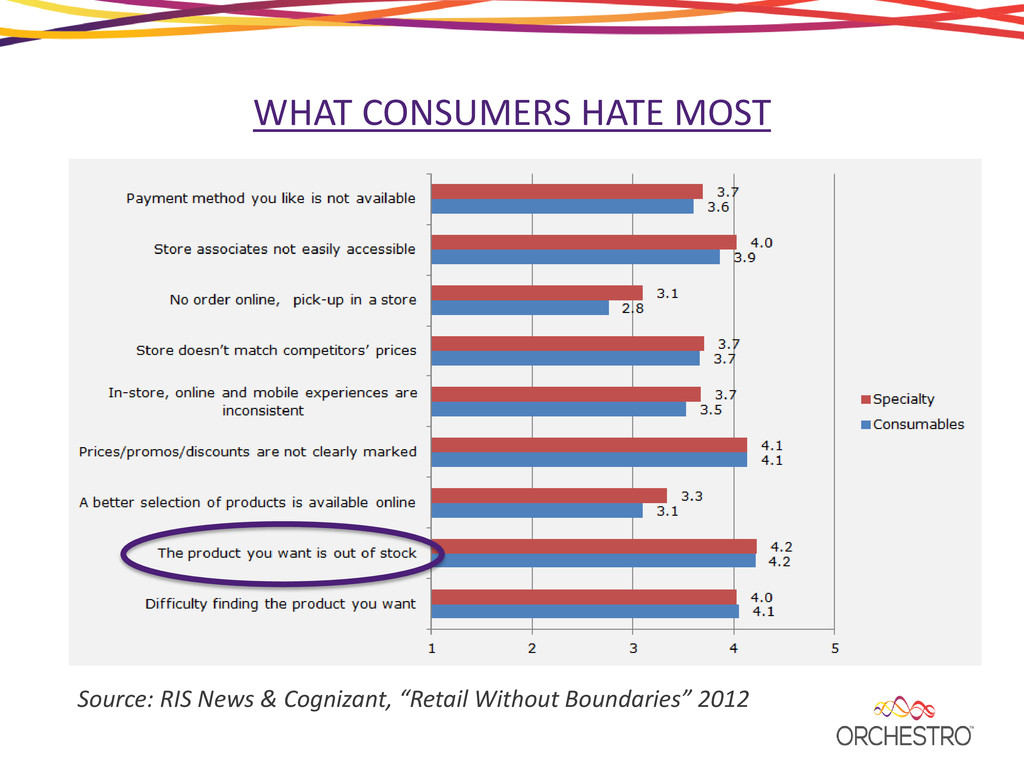
- If out-of-stocks are significant, sales do not reflect true demand. Forecast adjustments to history should incorporate the consumer's reaction - delayed fulfillment or switching behavior?
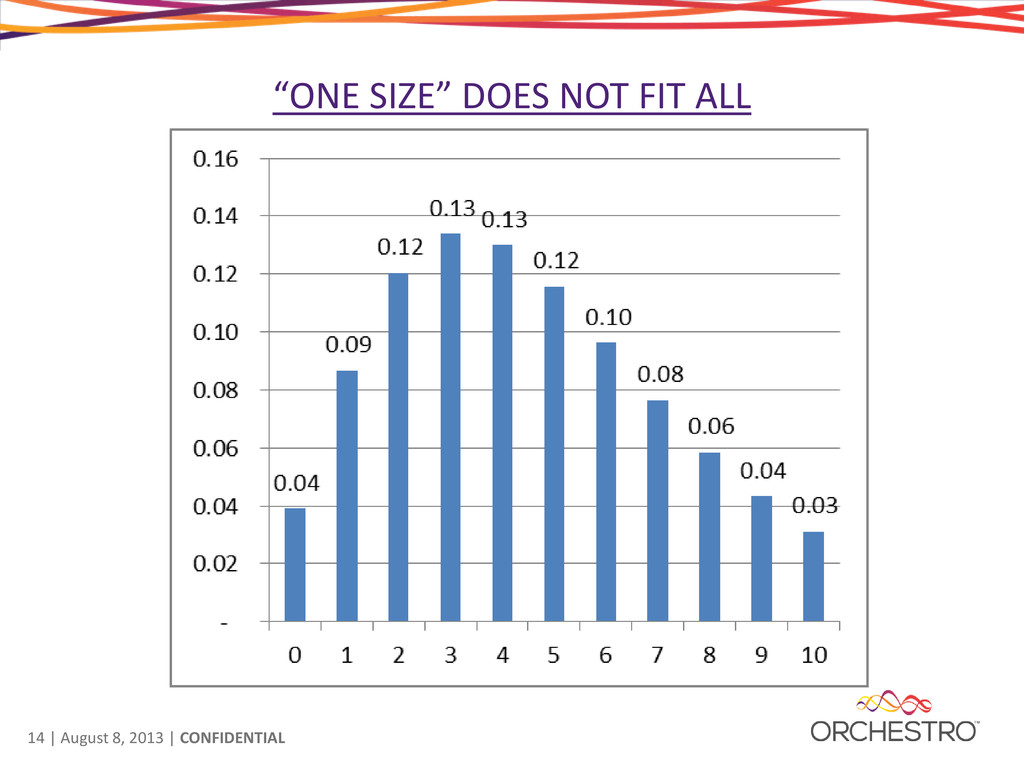
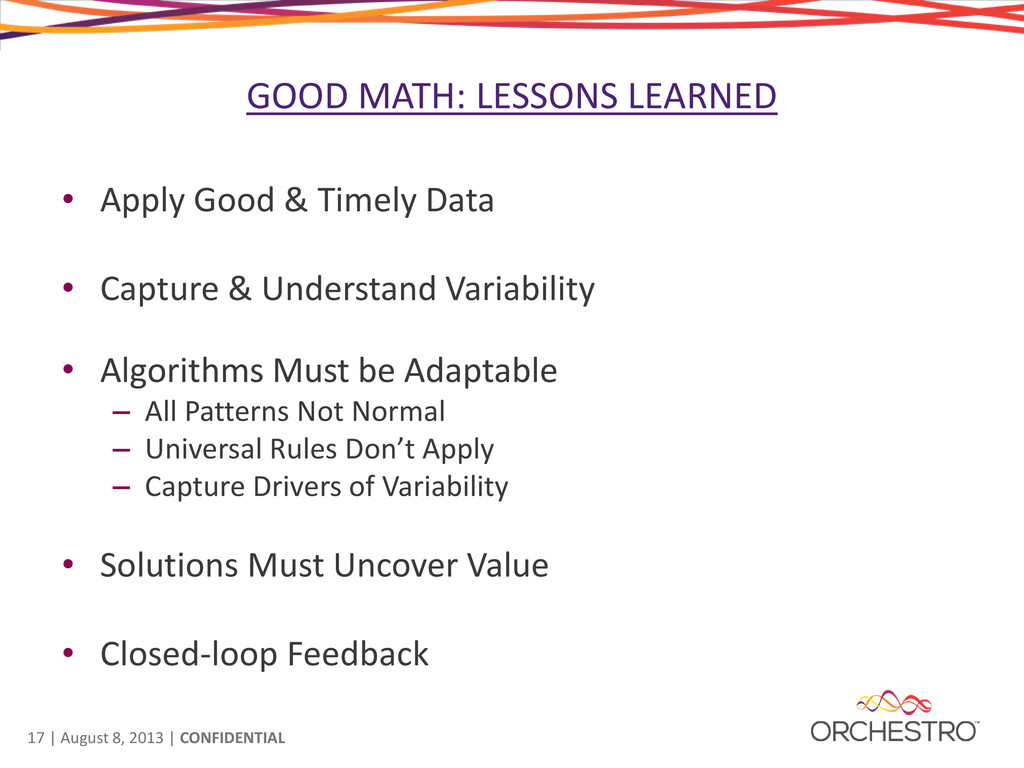
- In most categories, the optimal predictive model changes over time, as does the best approach to isolating various off-shelf availability events.

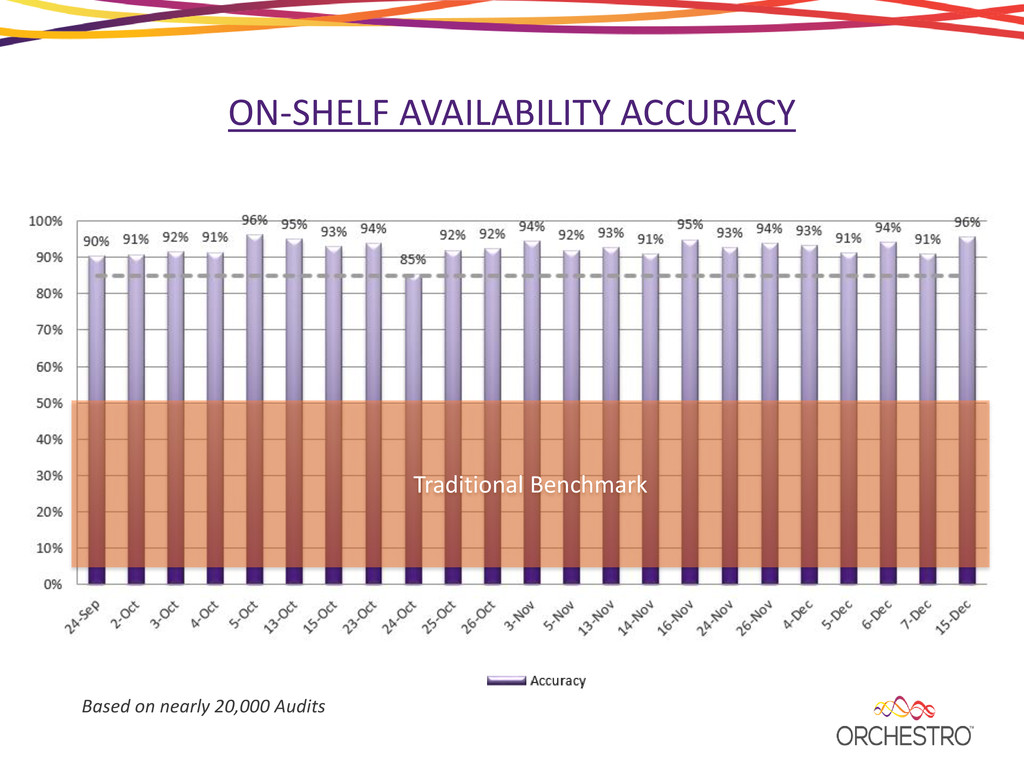
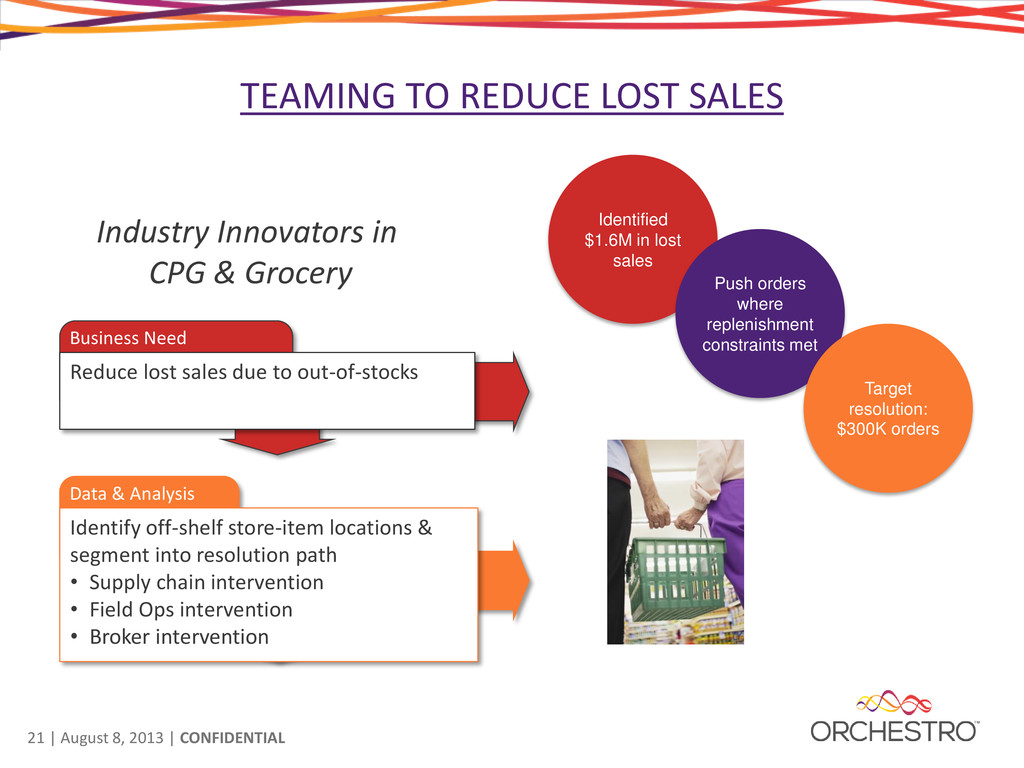
A new adaptive analytical approach is needed to capture the dynamics of the consumer goods supply chain. These concepts will be explored, including a discussion around how a retailer and manufacturer teamed to significantly increase accuracy of the forecast and shelf availability alerts.

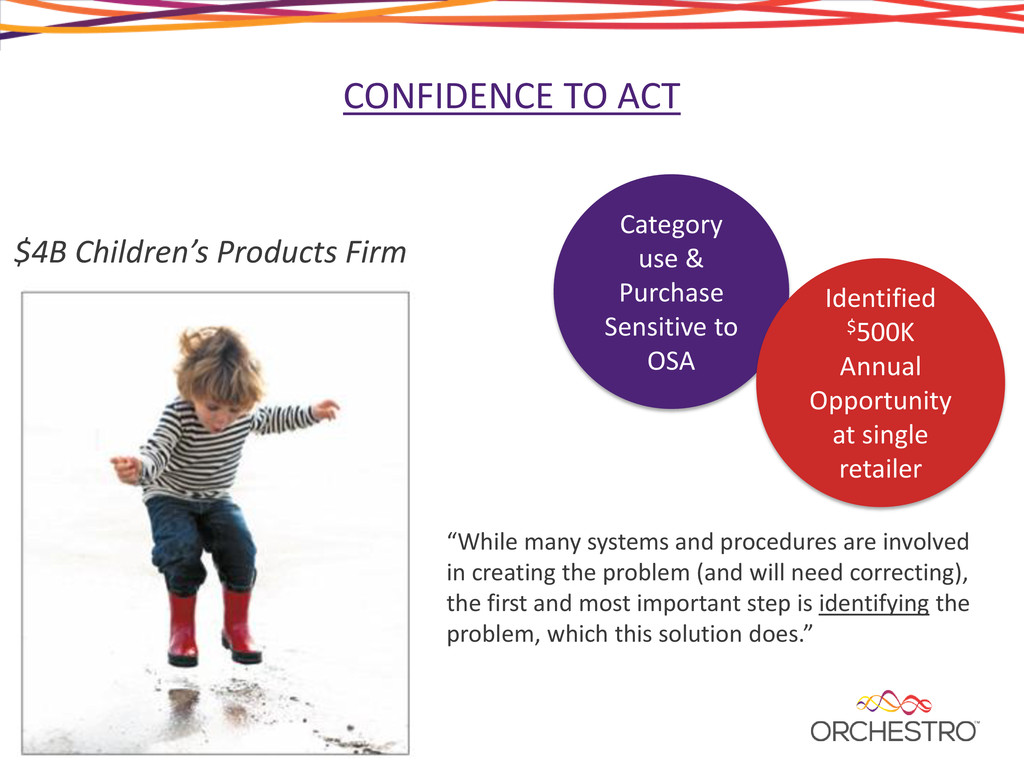
We will also examine how adaptive analytics go beyond traditional pattern recognition techniques to identify the guilty silences, when different data elements fail to intersect as expected; indicating missed sales or ineffective execution.

Orchestro

May 30, 2013
Tweet

More Decks by Orchestro

Other Decks in Technology

Transcript

  1. 2007: A VISIONARY TALE Despite multiple initiatives, improvements still elude

    most: • Non-promoted OOS rates 6 to 10% • 18 to 24% of promoted items unavailable to consumers • 70% of shoppers go to competitor if item unavailable (Source: IRI) • Up to 4% of sales lost because OOS (Source: GMS, FMI, CIES) • EPS hit $0.012 • 98% of FMCG retailers have mechanisms to track OOS, but few turn information into tactical actions Source: AMR Research, Mike Griswold & Lora Cecere, Dec. 2007
  2. WHAT DOES AN OUT-OF-STOCK COST? • The answer depends on

    category dynamics, availability of close alternatives, and shopper behavior. • Despite decades of initiatives to address OSA, shoppers still face an empty shelf 8-10% of the time industry wide. • Why isn’t this changing?
  3. WHY SO ELUSIVE? • No One Cause • Information Latency

    • Action Requires Confidence in Data
  4. 15 | August 8, 2013 | CONFIDENTIAL “BAD” MATH? •

    Data Too Stale • Averages Mask Reality • Broad Assumptions Don’t Hold • Alerts that are not Actionable
  5. 17 | August 8, 2013 | CONFIDENTIAL GOOD MATH: LESSONS

    LEARNED • Apply Good & Timely Data • Capture & Understand Variability • Algorithms Must be Adaptable – All Patterns Not Normal – Universal Rules Don’t Apply – Capture Drivers of Variability • Solutions Must Uncover Value • Closed-loop Feedback
  6. 21 | August 8, 2013 | CONFIDENTIAL TEAMING TO REDUCE

    LOST SALES Industry Innovators in CPG & Grocery Identified $1.6M in lost sales Push orders where replenishment constraints met Target resolution: $300K orders Business Need Reduce lost sales due to out-of-stocks Data & Analysis Identify off-shelf store-item locations & segment into resolution path • Supply chain intervention • Field Ops intervention • Broker intervention
  7. 22 | August 8, 2013 | CONFIDENTIAL CONFIDENCE TO ACT

    Category use & Purchase Sensitive to OSA Identified $500K Annual Opportunity at single retailer “While many systems and procedures are involved in creating the problem (and will need correcting), the first and most important step is identifying the problem, which this solution does.” $4B Children’s Products Firm
  8. 23 | August 8, 2013 | CONFIDENTIAL CONFIDENCE TO ACT

    Slashed Off-Shelf Duration by 70% Reduced Lost Sales by over 60% Fortune 500 Beverage Firm Implemented with daily in-store merchandising
  9. WHAT DOES THIS MEAN FOR YOU • On average, a

    3-Point improvement in OSA is yielding a 1-Point improvement in Revenue Growth. • For companies with organic growth in the 3-4 Point range, a 1-Point improvement in revenue growth is highly significant. "Organizations are realizing that, without a demand signal repository (DSR) investment, they are challenged to measure on-shelf availability (OSA), and engage and collaborate with customers to increase revenue.” Source: Gartner, Inc., Steven Steutermann, April 2013 “How to Differentiate Your CP Supply Chain With Metrics”