Upgrade to Pro — share decks privately, control downloads, hide ads and more …

標示方法與註解參考

Avatar for Pikas Pikas
July 04, 2021

 標示方法與註解參考

標示方法與註解參考

Avatar for Pikas

Pikas

July 04, 2021

Other Decks in Education

Transcript

  1. ઍ༿େֶେֶӃࣗવՊֶݚڀՊ म࢜࿦จ Is green light ineffective for Is green light

    ineffective for Is green light ineffective for Is green light ineffective for the growth of plug seedlings? the growth of plug seedlings? the growth of plug seedlings? the growth of plug seedlings? ฏ੒ 10 ೥ 2 ݄ఏग़ ੜ෺ࢿݯՊֶઐ߈ ؀ڥௐઅ޻ֶݚڀࣨ WATCHARRA CHINTAKOVID
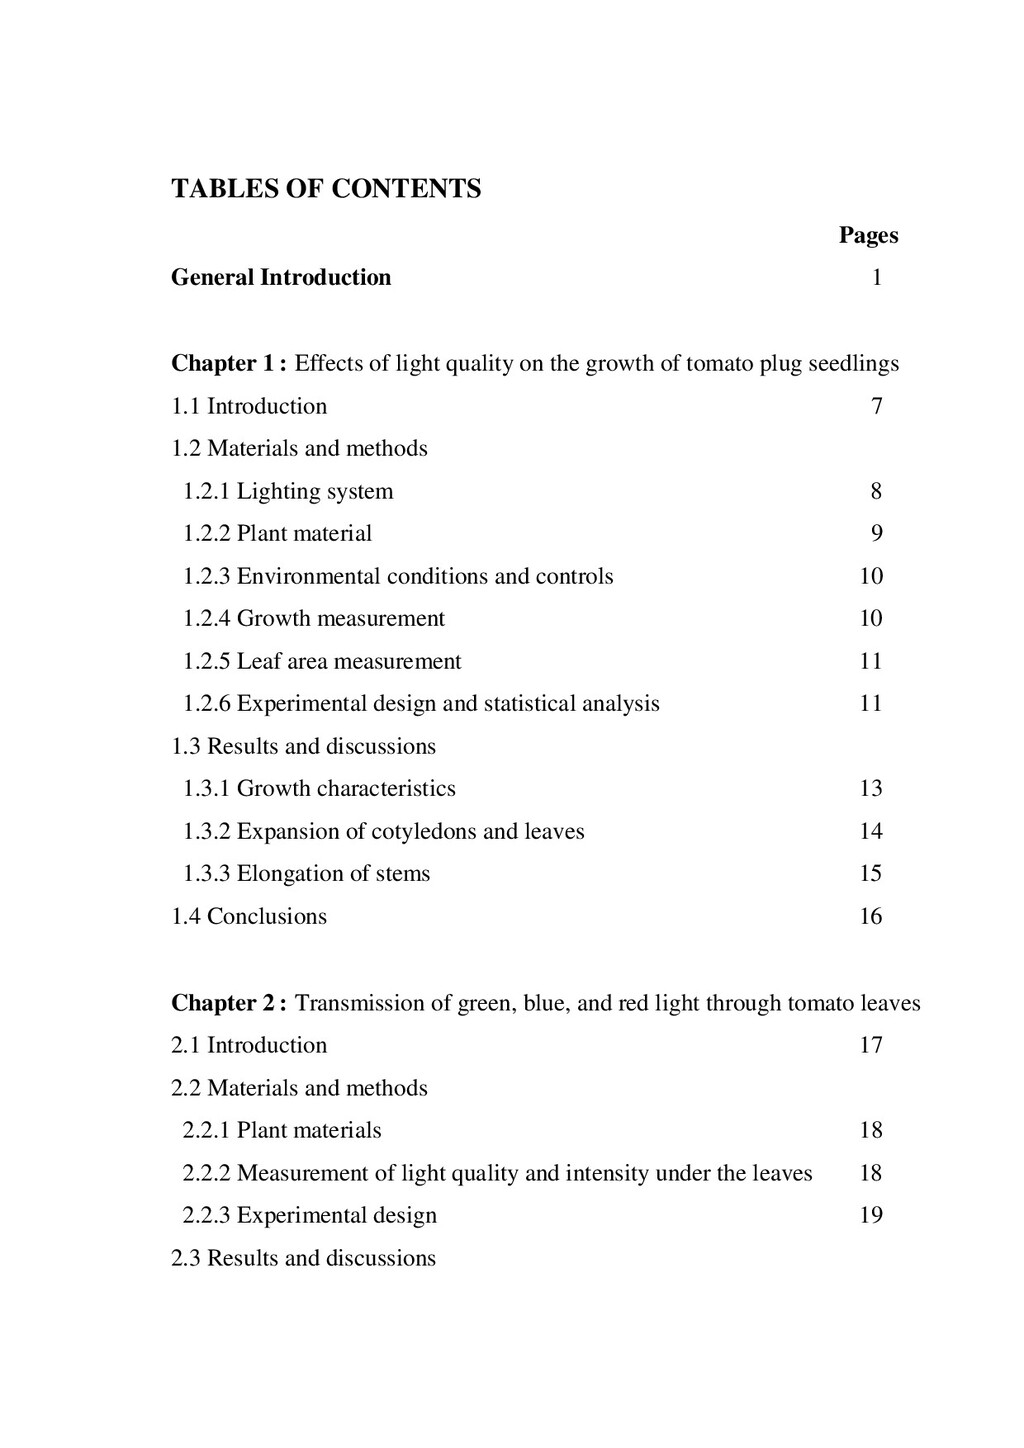
  2. TABLES OF CONTENTS Pages General Introduction 1 Chapter 1 :

    Effects of light quality on the growth of tomato plug seedlings 1.1 Introduction 7 1.2 Materials and methods 1.2.1 Lighting system 8 1.2.2 Plant material 9 1.2.3 Environmental conditions and controls 10 1.2.4 Growth measurement 10 1.2.5 Leaf area measurement 11 1.2.6 Experimental design and statistical analysis 11 1.3 Results and discussions 1.3.1 Growth characteristics 13 1.3.2 Expansion of cotyledons and leaves 14 1.3.3 Elongation of stems 15 1.4 Conclusions 16 Chapter 2 : Transmission of green, blue, and red light through tomato leaves 2.1 Introduction 17 2.2 Materials and methods 2.2.1 Plant materials 18 2.2.2 Measurement of light quality and intensity under the leaves 18 2.2.3 Experimental design 19 2.3 Results and discussions
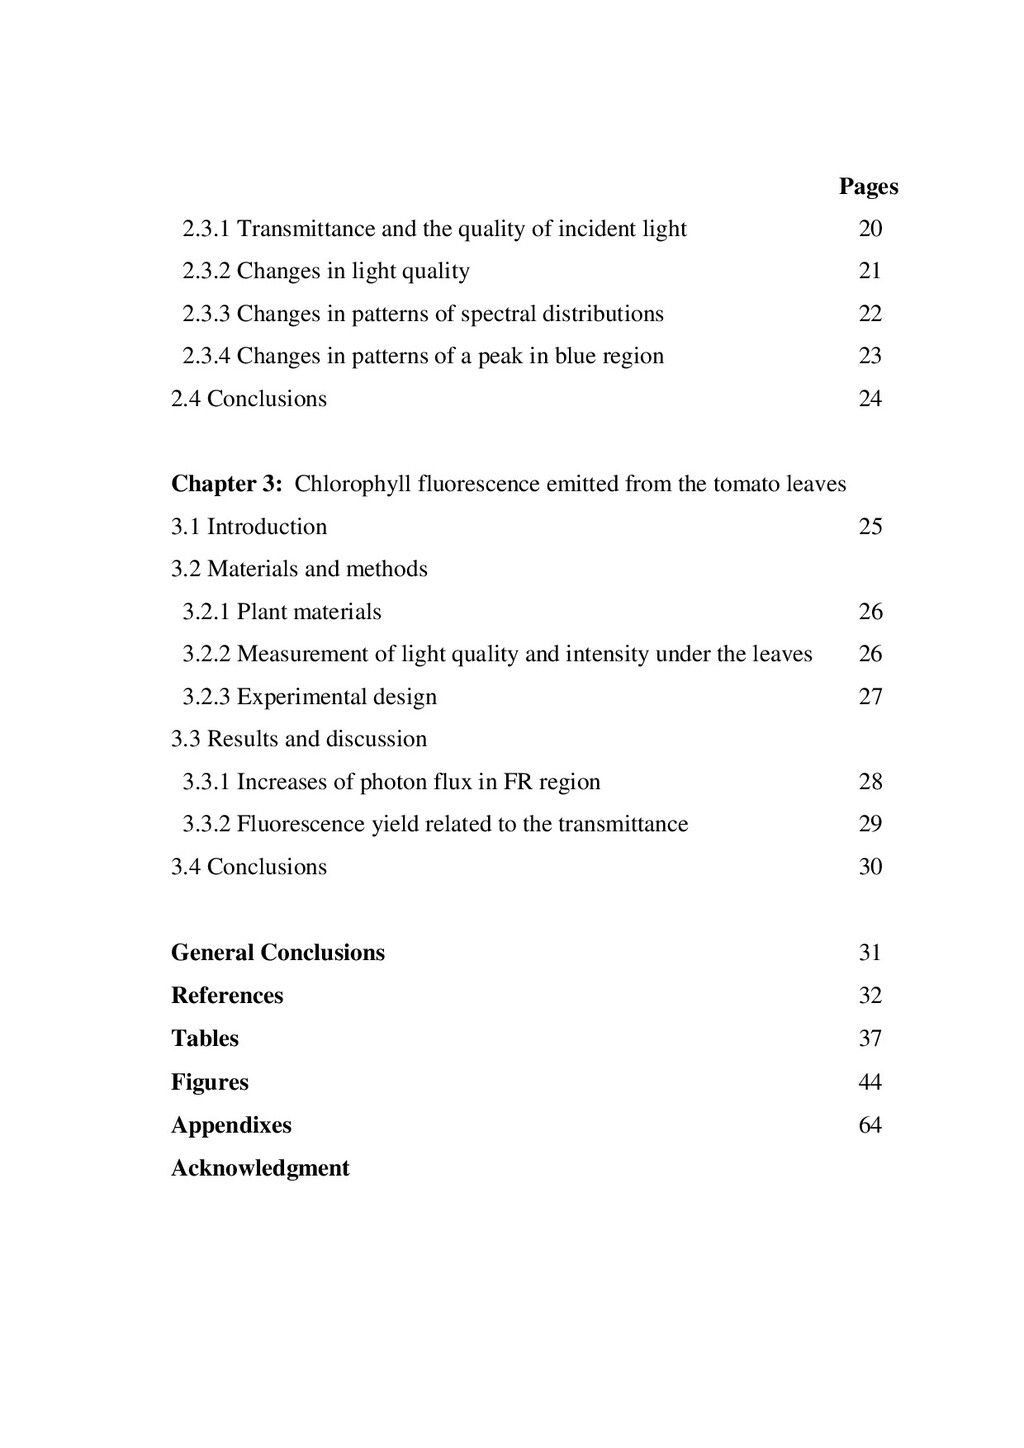
  3. Pages 2.3.1 Transmittance and the quality of incident light 20

    2.3.2 Changes in light quality 21 2.3.3 Changes in patterns of spectral distributions 22 2.3.4 Changes in patterns of a peak in blue region 23 2.4 Conclusions 24 Chapter 3: Chlorophyll fluorescence emitted from the tomato leaves 3.1 Introduction 25 3.2 Materials and methods 3.2.1 Plant materials 26 3.2.2 Measurement of light quality and intensity under the leaves 26 3.2.3 Experimental design 27 3.3 Results and discussion 3.3.1 Increases of photon flux in FR region 28 3.3.2 Fluorescence yield related to the transmittance 29 3.4 Conclusions 30 General Conclusions 31 References 32 Tables 37 Figures 44 Appendixes 64 Acknowledgment
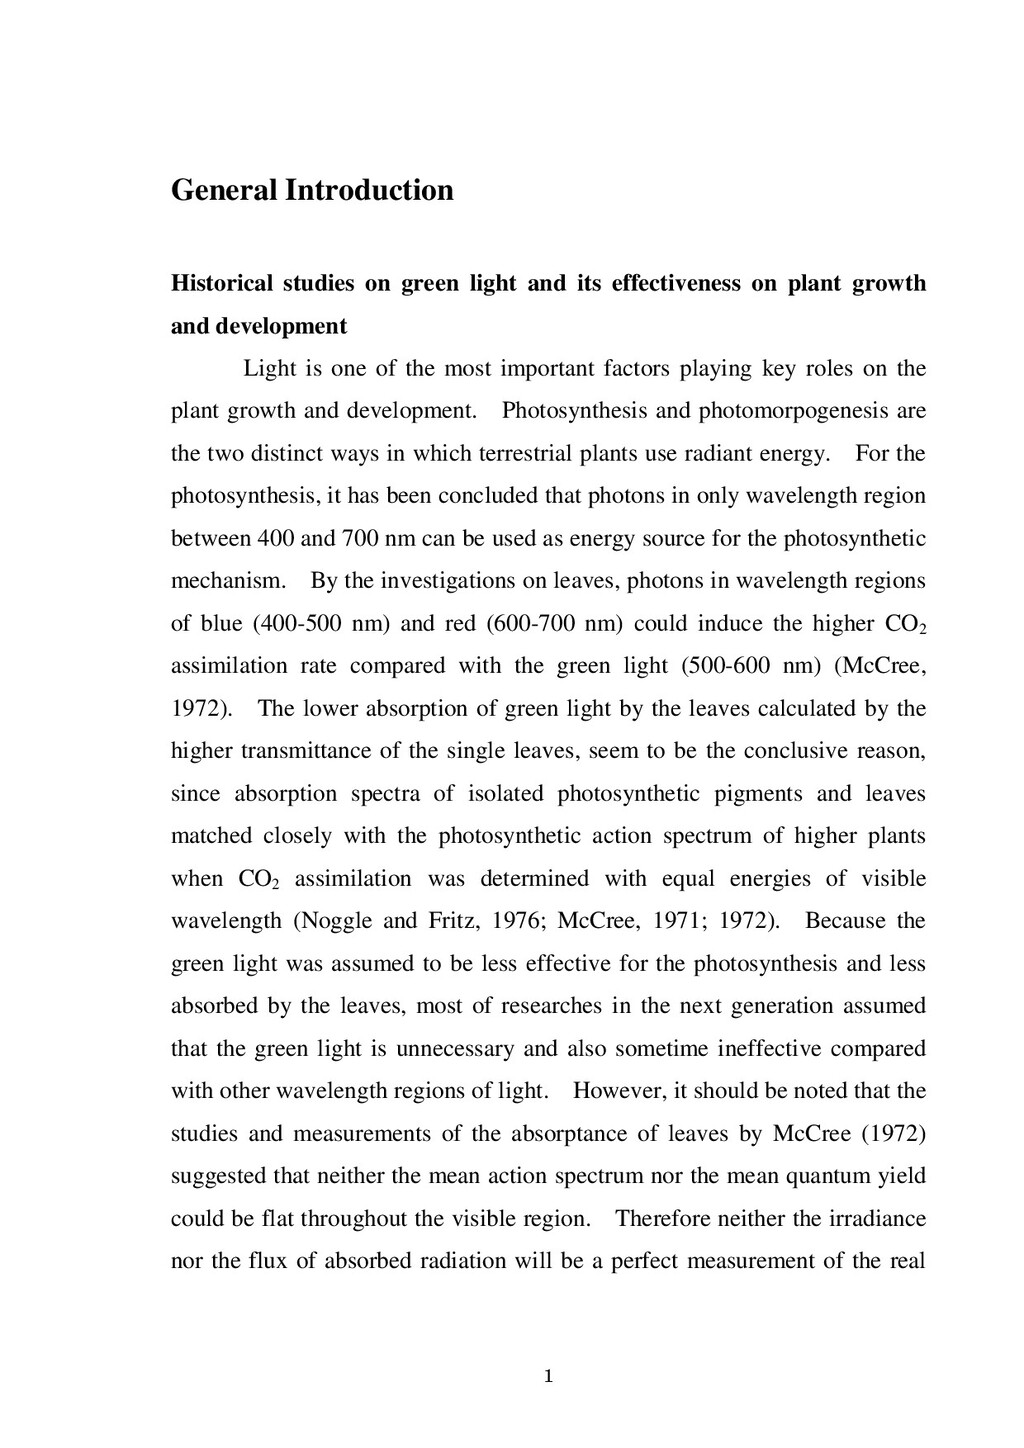
  4. 1 General Introduction Historical studies on green light and its

    effectiveness on plant growth and development Light is one of the most important factors playing key roles on the plant growth and development. Photosynthesis and photomorpogenesis are the two distinct ways in which terrestrial plants use radiant energy. For the photosynthesis, it has been concluded that photons in only wavelength region between 400 and 700 nm can be used as energy source for the photosynthetic mechanism. By the investigations on leaves, photons in wavelength regions of blue (400-500 nm) and red (600-700 nm) could induce the higher CO2 assimilation rate compared with the green light (500-600 nm) (McCree, 1972). The lower absorption of green light by the leaves calculated by the higher transmittance of the single leaves, seem to be the conclusive reason, since absorption spectra of isolated photosynthetic pigments and leaves matched closely with the photosynthetic action spectrum of higher plants when CO2 assimilation was determined with equal energies of visible wavelength (Noggle and Fritz, 1976; McCree, 1971; 1972). Because the green light was assumed to be less effective for the photosynthesis and less absorbed by the leaves, most of researches in the next generation assumed that the green light is unnecessary and also sometime ineffective compared with other wavelength regions of light. However, it should be noted that the studies and measurements of the absorptance of leaves by McCree (1972) suggested that neither the mean action spectrum nor the mean quantum yield could be flat throughout the visible region. Therefore neither the irradiance nor the flux of absorbed radiation will be a perfect measurement of the real
  5. 2 photosynthetically active radiation, while the irradiance is overestimating more

    than the photon flux. Also, Duysen (1952, 1956, 1957), who is the first to apply the measurement of changes of absorption induced by illumination to the study of photosynthesis, suggested that even a properly measured absorption spectrum may not be identical to that of the same pigments in solution, if the pigments are contained in particles that have a non-negligible absorption (flattening effects). Amesz (1996) reviewed that the absorption spectra of rather poor quality are being published occasionally even today, and this is mainly due to the fact that the commercial apparatus normally used are not designed for scattering materials. If the light scattering is not properly corrected, not only causes an upward shift and distortion of the absorption spectrum, but it may also decrease the amplitude of absorption bands (Amesz et al., 1961; Latimer and Eubanks, 1962) and the additional distortion may occur due to the selective scattering near the absorption bands (Latimer, 1959). Therefore, many methods have been suggested for the higher accuracy in measurement such as using the sphere-shape chamber connected to the photo-sensor required for collecting all the radiation reflected from the surface of leaves, and the chamber needs the strong direct beam of light to minimize the scattering and spreading of radiation. In contrast, for the transmission, it has been suggested that the errors of measurement can be minimized by collecting the transmitted light over a relatively large angle (Amesz, 1996). Nevertheless, there were other difficulties in choosing the samples, and the high variation due to many factors such as the containing materials, age, physiological structure, growth status of the photosynthetic materials or leaves. The size of error depends on the spectral quality of the
  6. 3 light source (McCree, 1972). Also the investigation under various

    percent green light has not been determined. Therefore, the above statements suggested that the clear explanation for effectiveness of light in wavelength region of green (500-600 nm) is still necessary. Thus in parts of this study also includes attempts to measure transmitted light by using light source providing relatively narrow wavelength region of light. Advantages of artificial light in intensive study of plant response Artificial light provides more controllability compared with the natural light. Light environment including intensity, duration, quantity and quality plays important roles on plant growth and development. To determine those responses, the uncontrollability of solar radiation limits its application for intensive studies of plant responses. Therefore, the artificial light is considered advantage for the intensive study of plant responses. Increasing light quantity is a simple way to promote the growth of plants because it can theoretically increase the photosynthesis of plants. However, the over increased light intensity can cause stress to the plants and also may be resulted in the shut down of photosynthesis, i.e., photoinhibition (Styer and Koranski, 1997). Also, it should be noted that either increase of light intensity, duration, or quantity resulted in the higher electrical energy consumption and production cost in plant production. Therefore, optimizing growth with the increased light intensity has been emphasized in several researches. By using various kinds of lamps as the light sources, quality of light has been proved to be effective on controlling plant morphogenesis. Even
  7. 4 though, the broad spectra of light provided by those

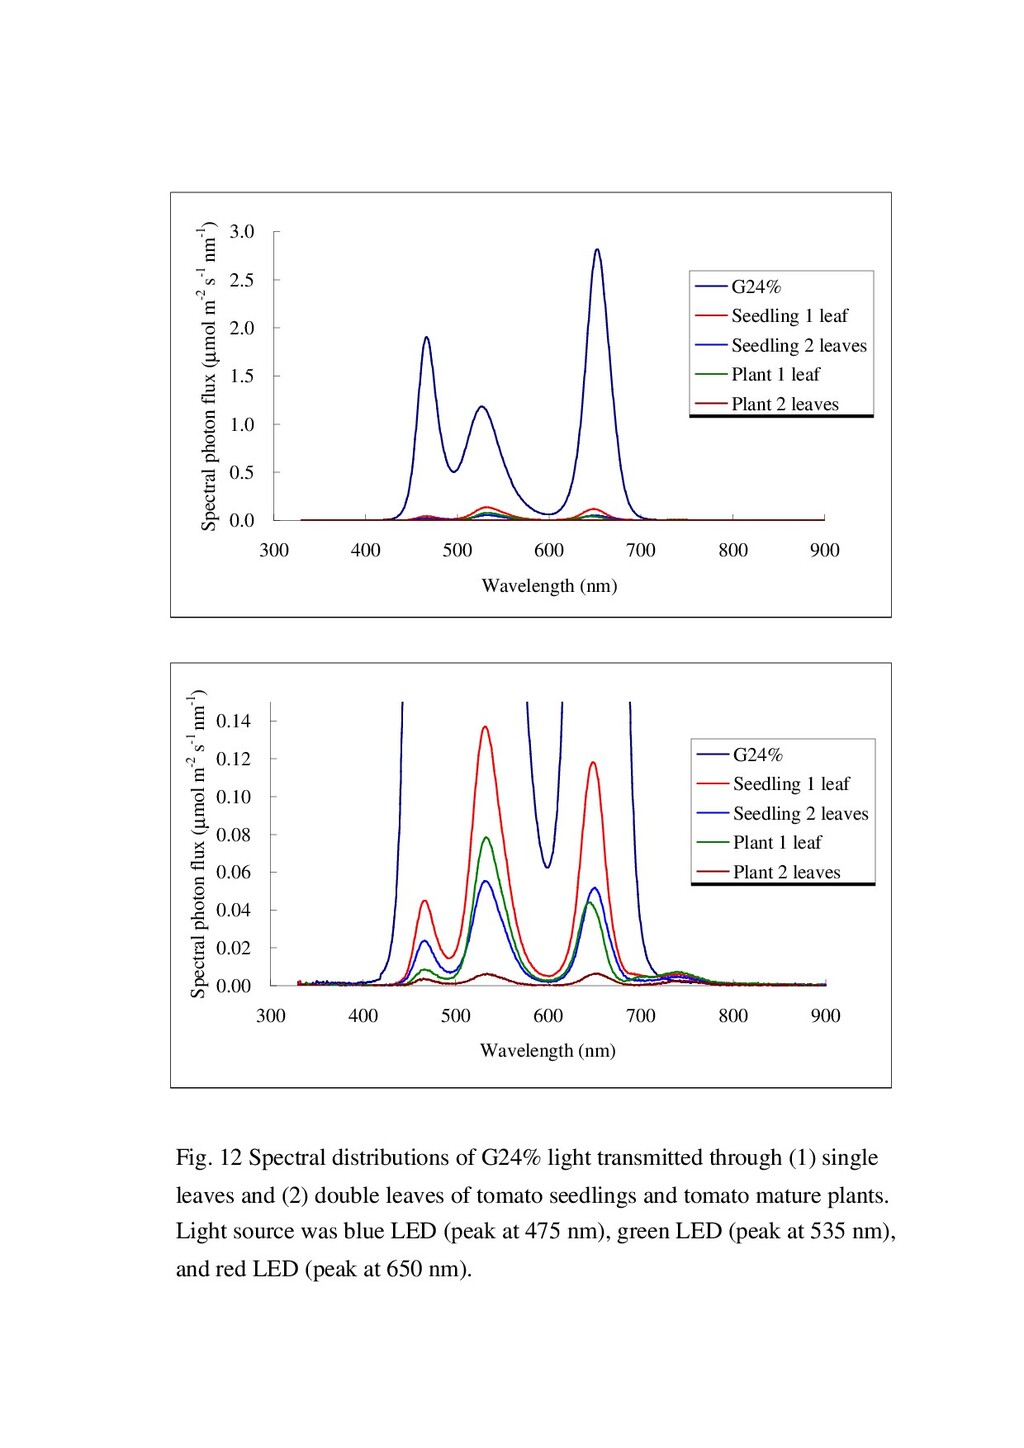
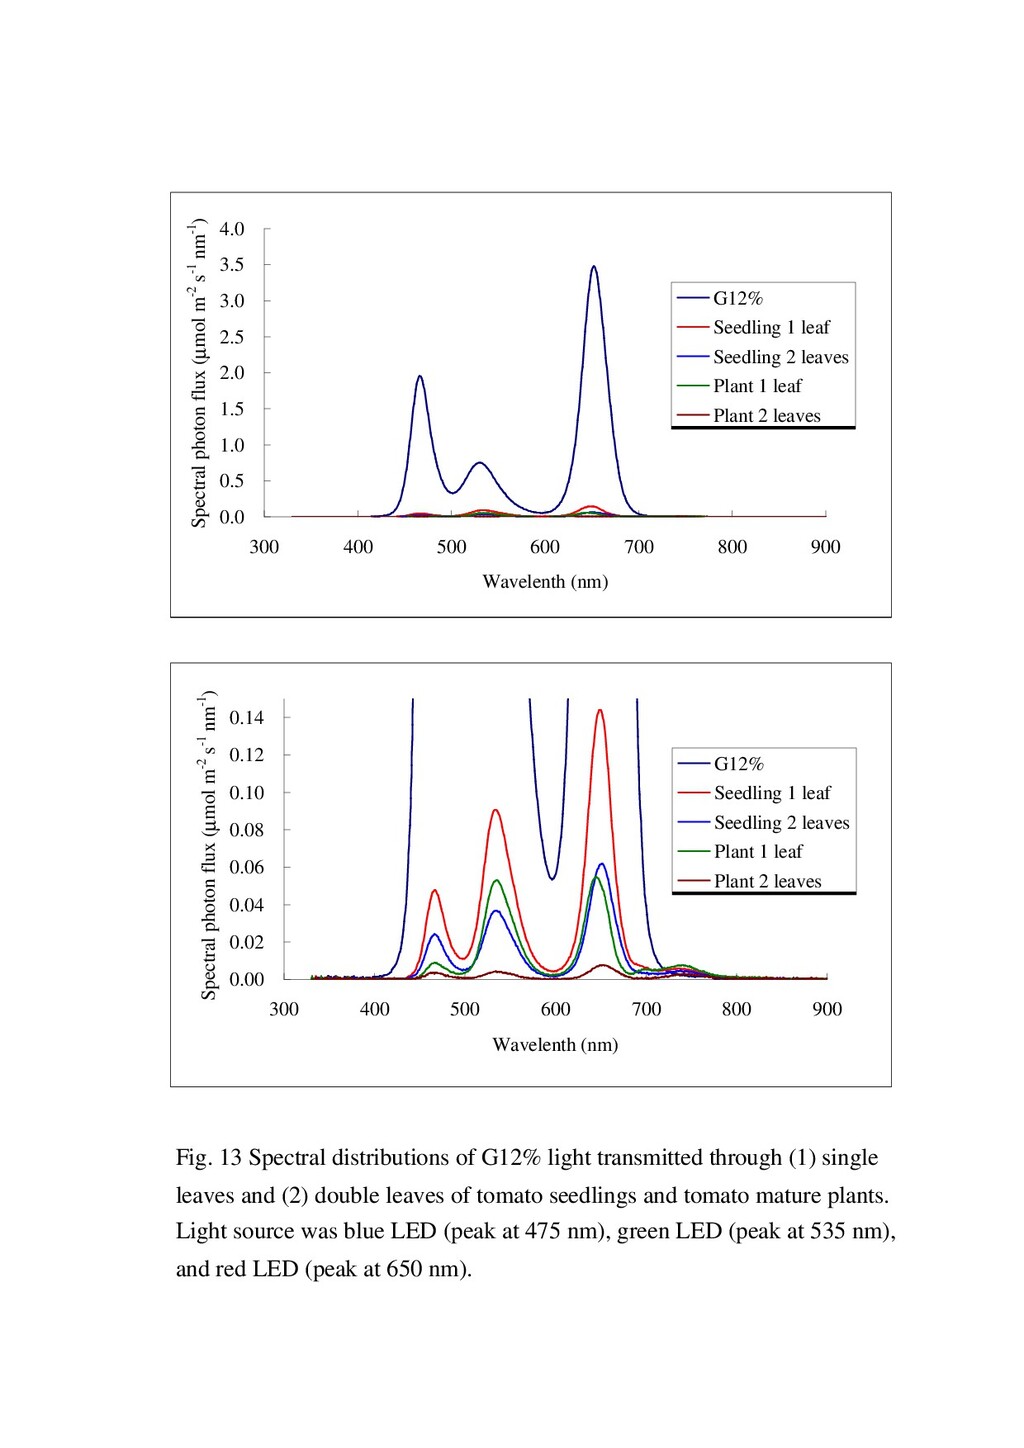
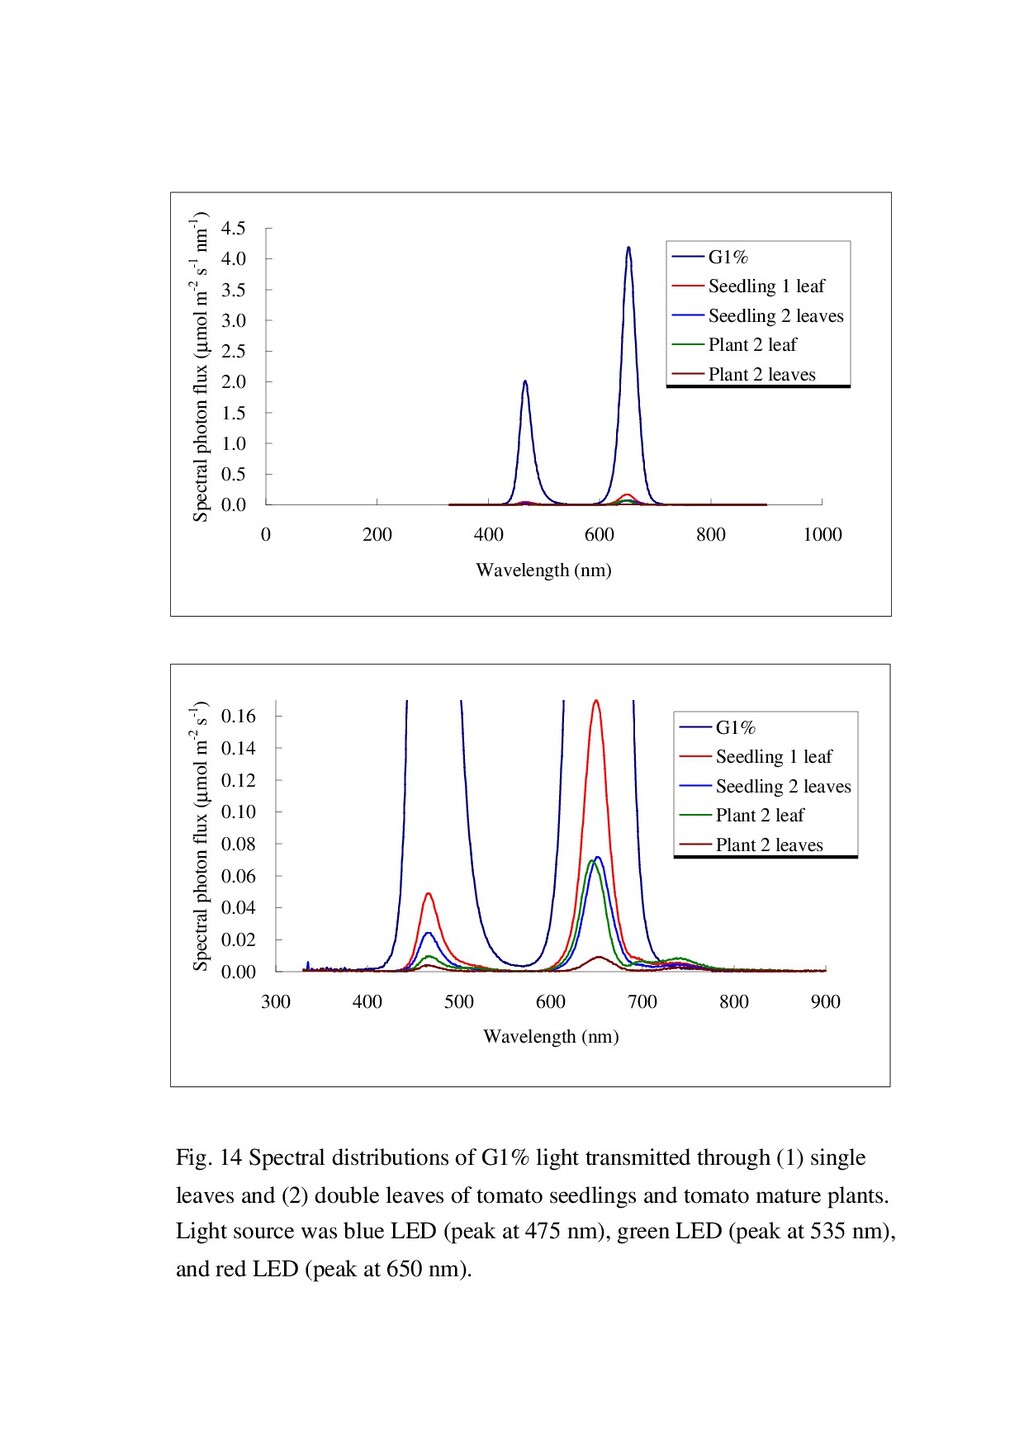
    light sources limited the efficiency of investigations. Thus, interference filters have been applied to eliminate the excessive wavelength regions. Red and blue lights are known to be effective for the photosynthesis and growth of individual plants mainly because the leaves have high absorption of light in blue and red regions. The peaks of leaf absorption spectra measured in many plant species are at red region between 655 and 665 nm and blue region between 445 and 455 nm (McCree, 1972). In addition, Shull (1929) reported that maximum reflectance of broad leaves is at green region between 540 and 560 nm. Also, the different effectiveness of light in different wavelength regions on photosynthesis indicated the influences of the light quality on photosynthesis of plants. Thus, the manipulation of light quality should be considered one effective way to promote the growth and development of plants, but does not increase the energy consumption, however, it will increase the capital cost for changing the lighting system, which is the same amount as when renewing the light source. During the last decades, light emitting diodes (LEDs) have been developed for provide relatively narrow wavelength regions of light (Williams and Hall, 1978; etc.). LED has been broadly used and its most popular applications are as indicators or optoelectronic switches for electrical appliances. Several recent advances in the LED technology improved the practical use of LEDs for applications in the fields that require a high photon flux, such as for the lighting system for plant productions. In addition, several types of LEDs were also developed for providing the specific light compositions and they can be the useful light sources for the study of light responses on the plants (Bula et al., 1991; Bula et al., 1994).
  8. 5 Importance of plug seedling use Plug is known as

    a containerized transplant which has many advantages over bare-root seedlings or conventional seedlings. There are many advantages of plug seedlings such as: - Less time and labor to transplant - More uniform growth after transplanting - Increased production per area - Can be held or delayed before transplanting - Less chance for disease to spread Therefore, plug seedlings have been introduced and used especially in the large-scale plant productions. However, the commercial use of plug seedlings has been limited because of some disadvantages such as: - Require skillful labor to produce high quality plug seedlings - Longer time to produce plug seedlings compared with seedling bed - High initial cost for the production of plug seedlings, greenhouse The quality of transplants is one of the most important factors to be critically emphasized in plant productions. Therefore the plug seedlings are suitable for the growers who recognized benefit of using high quality transplants (e.g., Styer and Koranski, 1997). For plug seedlings, or high planting density crops, the shading responses that caused by the near-by seedlings and the canopy of leaves greatly influence the growth and habits of those seedlings or crops (e.g., Styer and Koranski, 1997; Papadopoulos and Pararajasingham, 1997). The crop photosynthesis is not only dependent on the distribution of the PPF among the layers, but also on the total amount of photosynthetic photons (PP) absorbed by the canopy (Duncan, 1971; Norman, 1980). Manipulation of
  9. 6 planting density (or planting space) to optimize the PPF

    interception is one possible strategy for increasing yields of tomato (Papadopoulos and Pararajasingham, 1997), soy bean (Shibles and Weber, 1965), cereals (Gallagher and Biscoe, 1978) and orchard crops (Jackon, 1980). The radiation can be absorbed, reflected by and transmitted through the leaves depending on their wavelength regions, therefore, the spectral distribution of the solar radiation (both diffuse sky and direct beam) also changes inside the canopies. It was found that the canopy structure, including the distribution of gaps and surface orientation inside the canopy, the scattering processes in the canopy and also phytoelements inside the canopies directly affect changes in the spectral irradiance with depth and varying orientation in the canopy (Coombe, 1957; Federer and Tanner, 1966; Robertson, 1966; Vezina and Boulter, 1966; Kinerson, 1973; Goodfellow and Barkham, 1974; Holmes and Smith, 1977; Tasker and Smith, 1977; Turnbull and Yates, 1993; Grant, 1997). Therefore, consideration of only light intensity at the top of canopy level is not enough anymore. The further investigation of seedling growth in high planting density crops is necessary and should be determined. Objective of the present study The present study was conducted to examine the effects of green light on the growth of plug seedlings. Firstly, the growth of tomato plug seedlings under three various percentages of green PF at a given PPF level was compared using LED light source. Secondly, the transmissions of green, blue, and red light through the tomato leaves were investigated. Thirdly, the fluorescence emitted from the tomato leaves was observed and its relation to the transmittance was compared under various light qualities.
  10. 7 Chapter 1 Effects of percent green PF on the

    growth of tomato plug seedlings 1.1 Introduction Blue and red lights are effective in the photosynthesis of leaves, and also play many important roles on plant growth and development. On the other hand, only a few reports characterized the effects of green light on plant responses since the green light was found to be less effective in photosynthesis and less absorptance of the individual leaves compared with blue and red light. However, the growth of seedlings under various percent green photon flux (percent green PF) at a given photosynthetic photon flux (PPF) has not been investigated, especially for growth of canopy seedlings. During the last decades, LEDs have been developed for providing relatively narrow wavelength regions of light. By using the combinations of LEDs, it becomes more practical to make the various specific light qualities (e.g., William and Hall, 1978). Blue, red and far-red LEDs have been successfully used in the investigation on plant responses as affected by the light in the specific wavelength regions. With the advanced technology in LED, the green LED has been developed, but its applications on the studies of plant responses are rarely found. The present experiment was conducted to examine the effects of percent green PF on the growth of tomato plug seedlings by using green, blue, and red LEDs as light sources.
  11. 8 1.2 Materials and methods 1.2.1 Lighting system Green (1188

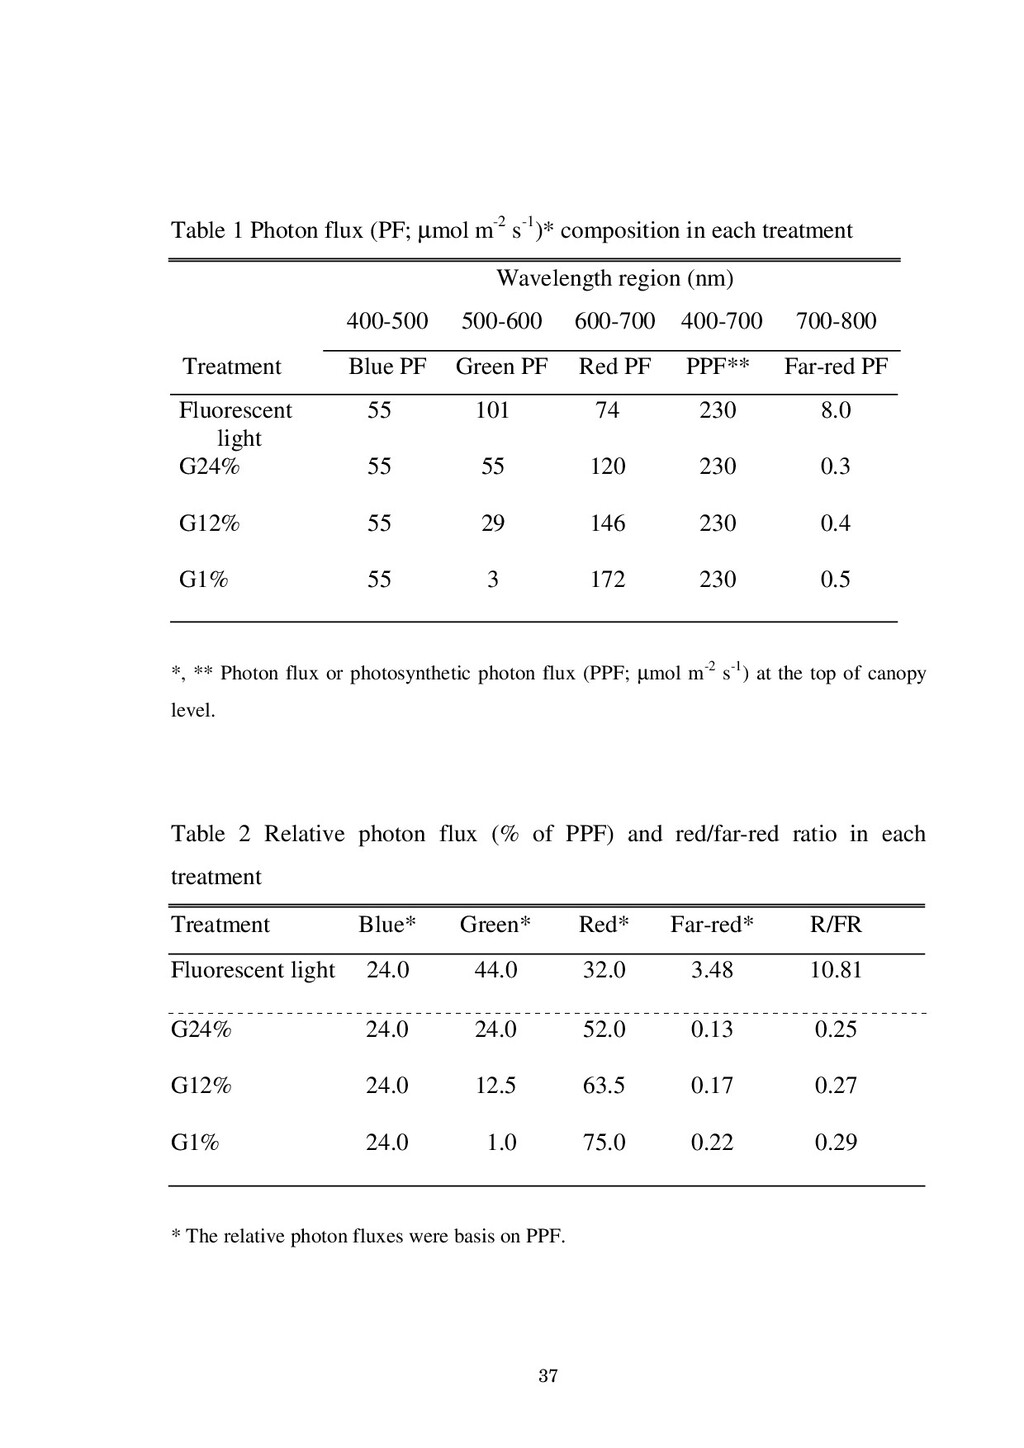
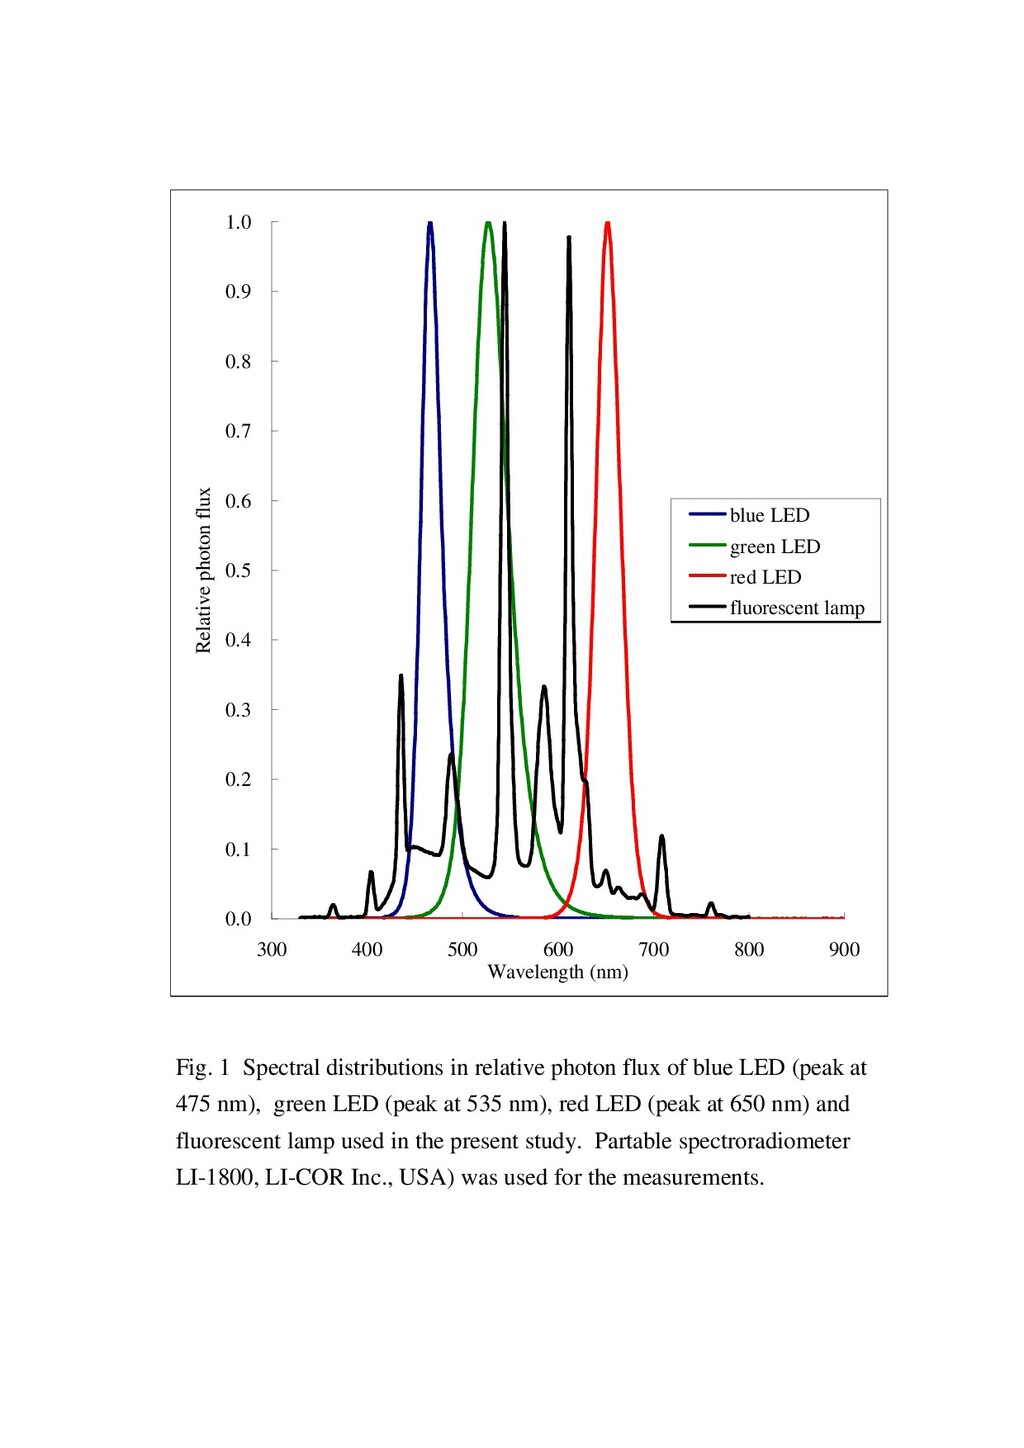
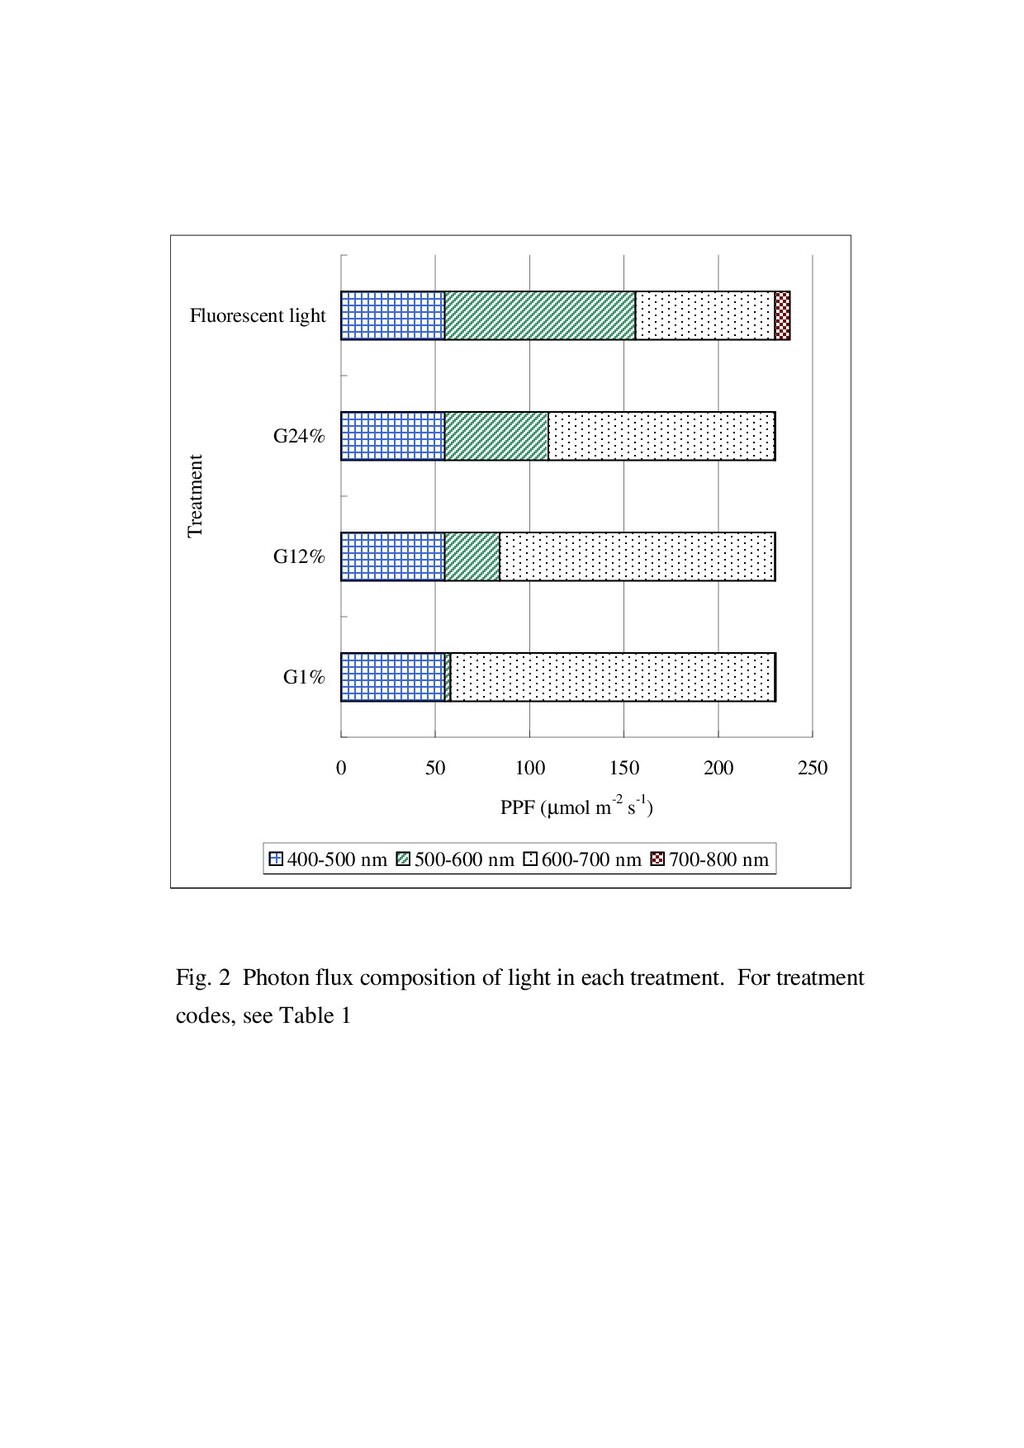
    lamps, peak at 535 nm, serial No.: NSPG300A; Nichia Chemical Co. Ltd., Japan), blue (1188 lamps, peak at 475 nm, serial No.:NSPB300A; Nichia Chemical Co. Ltd., Japan) and red (2376 lamps, peak at 650 nm, serial No.: HLMP8103; Hewlett Packard Co. Ltd., Japan) LEDs were systematically arranged in an LED panel. The LED panel was set over a specially designed box (i.e. LED box), used for providing green, blue and red light. Light intensity output of green, blue and red LEDs can be adjusted independently by using the electric current controller. For the study of various percent green light using only one LED box, a panel of fluorescent lamps (FLR40S EX-N/M-X-36; National Co. Ltd., Japan) set above a separate box (i.e. fluorescent lamp box) was used for the references repeated at each time of experiments conducted. Spectral photon flux of the green, blue, red LEDs and fluorescent lamp were measured by using a portable spectroradiometer (LI-1800; LI-COR Inc., USA). The spectral distributions in relative spectral photon flux are shown in Fig. 1. Characteristic and maximum output of each color of LEDs were used in consideration of treatments. The photosynthetic photon flux (PPF) and blue (termed B; 400-500 nm) photon flux at the top of canopy level were needed to be the same for all the treatments. The green (termed G; 500-600 nm) PF varied for three percent green PF of 24%, 12% and 1% treatments and red (termed R; 600-700 nm) also varied to maintain the same PPF for all the treatments. Photoperiod was 16 h d-1 for all the treatments. The photon flux component in photon flux and in percentage of PPF and the
  12. 9 spectral distributions of each treatment are shown in Table

    1, Table 2 and Fig. 2, respectively. It should be noted that the far-red (termed FR; 700-800 nm) PF was greatest in fluorescent lamps compared with the LED. 1.2.2 Plant material Tomato (Lycopersicon esculentum Mill., cv. Momotaro; Takii seed Co. Ltd., Japan) plug seedlings were grown in cells (H 49 mmʷW 29 mmʷ L 31 mm; 25 ml in volume) of plug tray (2x4 cells per tray; 64 mmʷ124 mm). The cells were filled with commercial soil mixture (Yanmar Co. Ltd., Japan). Seeds were sown into the soil mixture and then the plug trays were covered with white paper for two days. After germinating under the dark, seedlings continued growing under the treatment of light for another one week. Then, the uniform healthy seedlings were selected to make uniform canopies of seedlings. The cells were separated from each other and rearranged into another connected plug tray to prevent from the stress that might occur during the selection with the maintained planting density after selecting. Then, the seedlings continued growing at the same environmental conditions for the remaining of experimental period.
  13. 10 1.2.3 Environmental conditions and controls Both LED box and

    fluorescent lamp box were placed inside the growth room with controlled environmental conditions of 26ˆ/22ˆ air temperature (photo-/dark period), and 65% relative humidity. Data of temperature and relative humidity inside the growth room and inside the both boxes were collected by using a data logger (21X; Campbell Co. Ltd., USA). Heaters and fans were set up inside the two boxes and they were controlled by using signal output from the programmed data logger and a personal computer. Relative humidity inside the growth room was controlled by using a humidifier connected to the relative humidity controller (Humid-eye; Saginomiya seisakusho Inc., Japan). In order to give the uniform environmental conditions inside the boxes for all the seedlings, the position of plug trays were rearranged everyday. Jacks were used for maintaining the distance between the light source and seedlings when height of seedlings increased. 1.2.4 Growth measurement On day 15 after sowing, the growth of the seedlings was determined by measuring total fresh weight, leaf fresh weight, cotyledon fresh weight, petiole fresh weight, root fresh weight, and stem length. Shoot fresh weight was calculated by the sum of leaf, cotyledon, petiole and stem fresh weight. Dry weight was measured after drying the samples in a hot air oven at 60ˆ for one week.
  14. 11 1.2.5 Leaf area measurement Images of leaf blades from

    each tomato seedlings were photocopied immediately after excising. By using an image scanner (GT-8500; Seiko Epson Corp., Japan), the images of leaf blades were converted to computer files. Then, the area of the images was measured and calculated by using a measuring program (Fujitsu engineering Co. Ltd., Japan). 1.2.6 Experimental design and statistical analysis Because there was only one LED box for comparing three different percent green PF, three experiments were separately conducted. The similar experiments under fluorescent lamps were repeated at the same time. Average value from eight seedlings was used as one replication. There were eight replications in each treatment. Statistical analysis by t-test at Ћ=0.05 was used for comparing the growth of seedlings in each treatment under LED to those of the seedlings under fluorescent lamp conducted during the same time. As the cooling system of the growth room was not functioning optimally during the experiments, temperature fluctuations may have influenced the experimental data. However, the average temperatures were the same among the treatment, and the same pairs of treatments conducted together would have the same environmental conditions. The three parts of this study were done separately, so the differences of environmental conditions occurred during the experiments might affect the growth of plug seedlings. Therefore, the absolute values of growth may not be able to use in comparisons among treatments. There were two methods to compare the growth of seedlings under G24%, G12% and G1%.
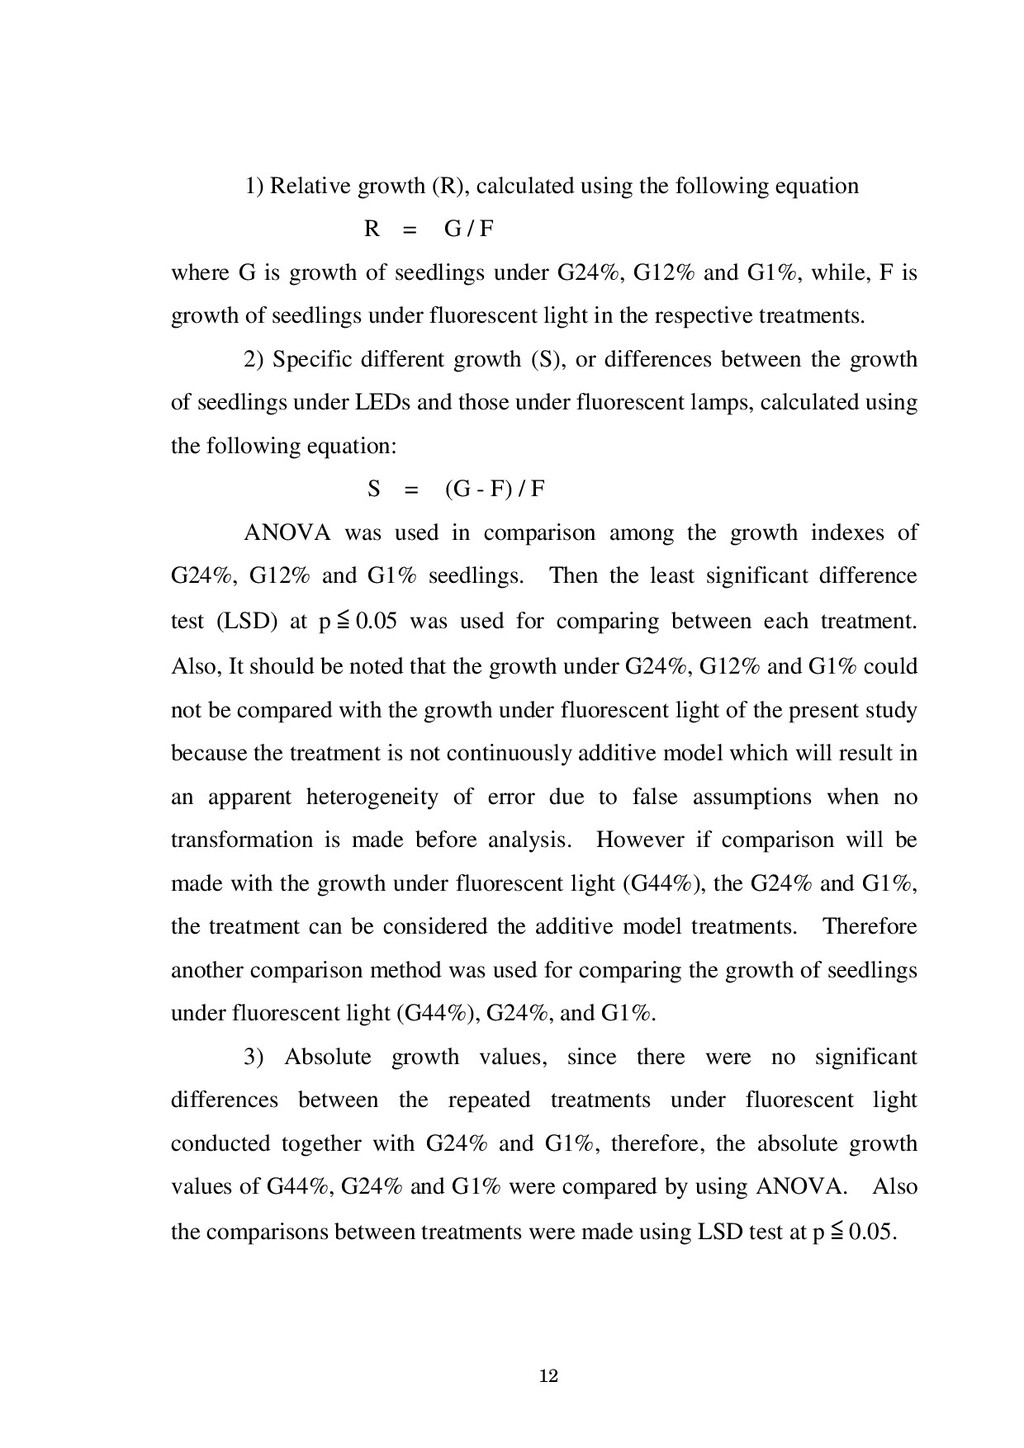
  15. 12 1) Relative growth (R), calculated using the following equation

    R = G / F where G is growth of seedlings under G24%, G12% and G1%, while, F is growth of seedlings under fluorescent light in the respective treatments. 2) Specific different growth (S), or differences between the growth of seedlings under LEDs and those under fluorescent lamps, calculated using the following equation: S = (G - F) / F ANOVA was used in comparison among the growth indexes of G24%, G12% and G1% seedlings. Then the least significant difference test (LSD) at pʽ0.05 was used for comparing between each treatment. Also, It should be noted that the growth under G24%, G12% and G1% could not be compared with the growth under fluorescent light of the present study because the treatment is not continuously additive model which will result in an apparent heterogeneity of error due to false assumptions when no transformation is made before analysis. However if comparison will be made with the growth under fluorescent light (G44%), the G24% and G1%, the treatment can be considered the additive model treatments. Therefore another comparison method was used for comparing the growth of seedlings under fluorescent light (G44%), G24%, and G1%. 3) Absolute growth values, since there were no significant differences between the repeated treatments under fluorescent light conducted together with G24% and G1%, therefore, the absolute growth values of G44%, G24% and G1% were compared by using ANOVA. Also the comparisons between treatments were made using LSD test at pʽ0.05.
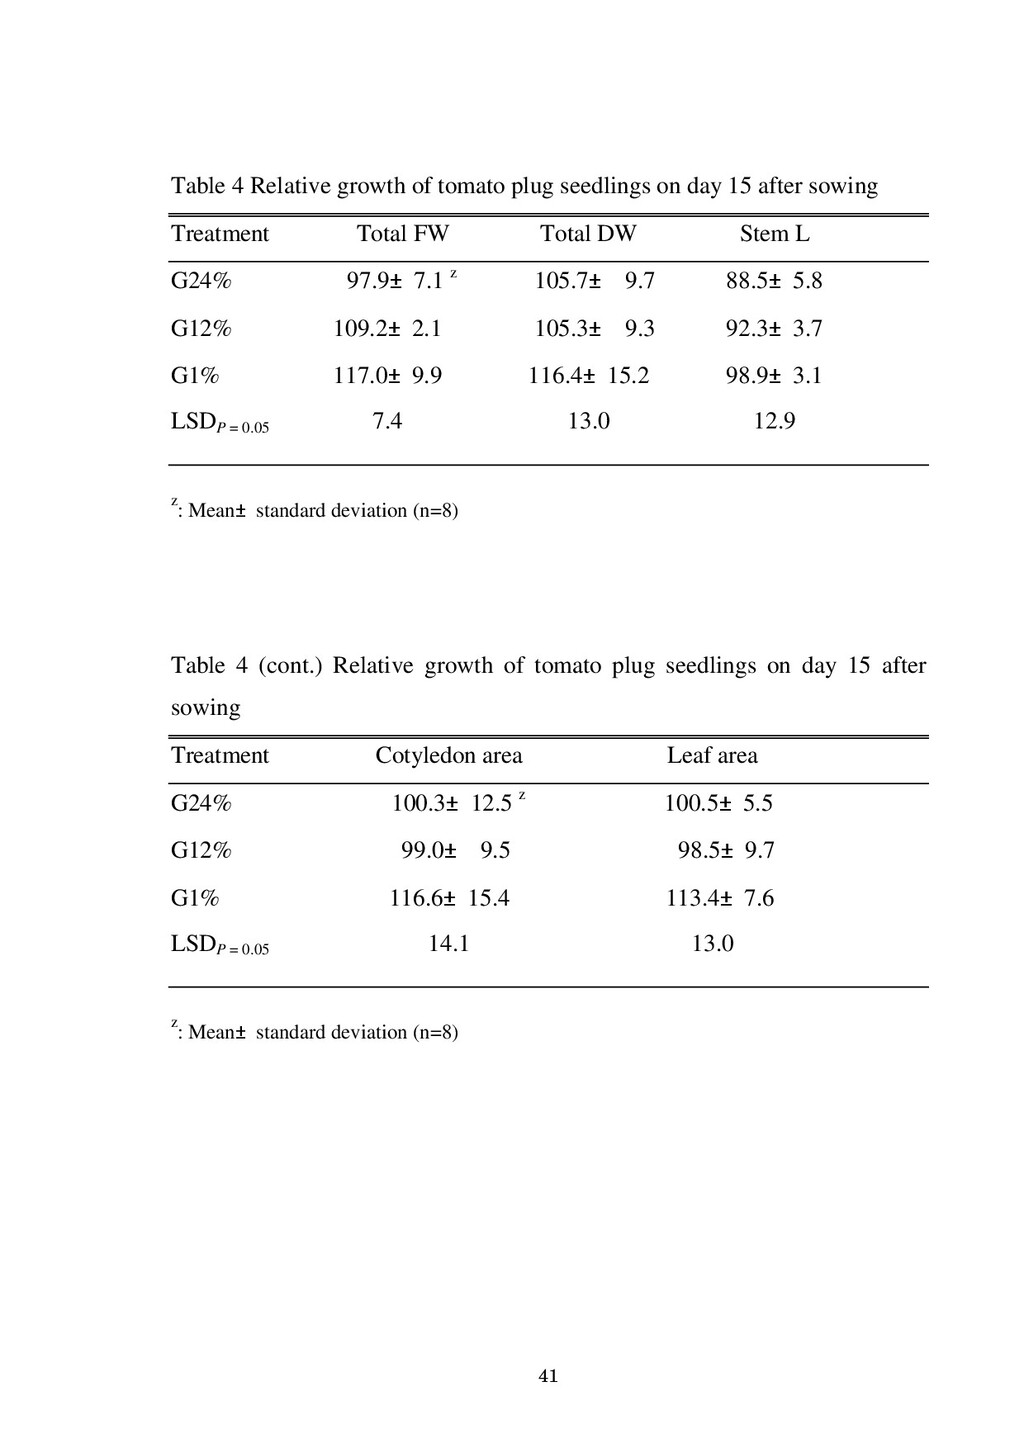
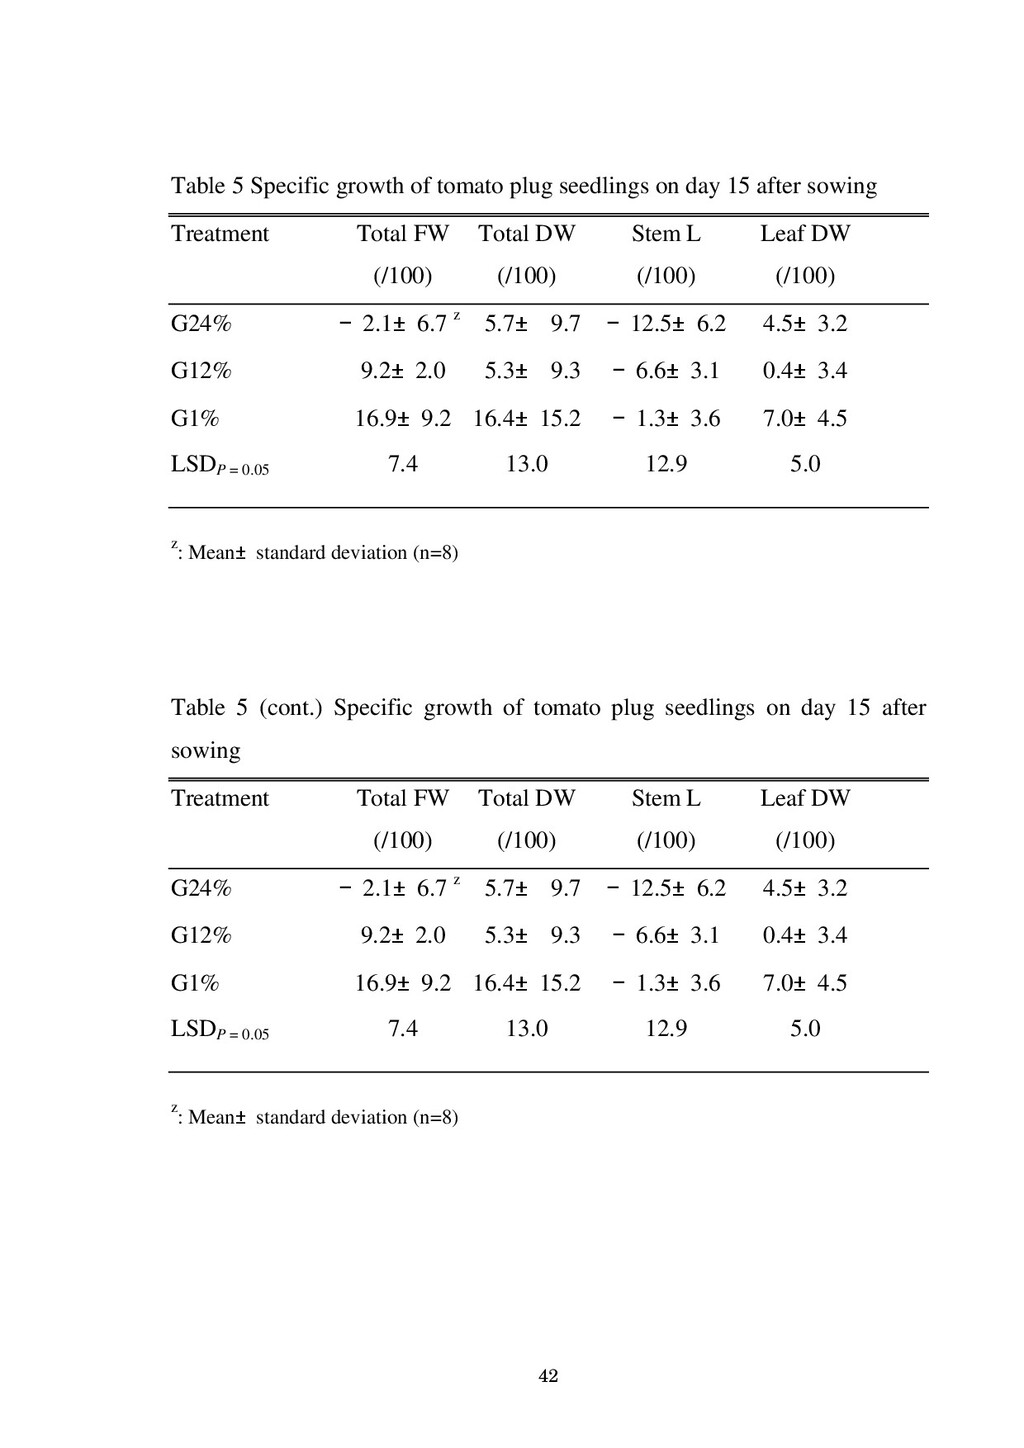
  16. 13 1.3 Results and discussions 1.3.1 Growth characteristics The absolute

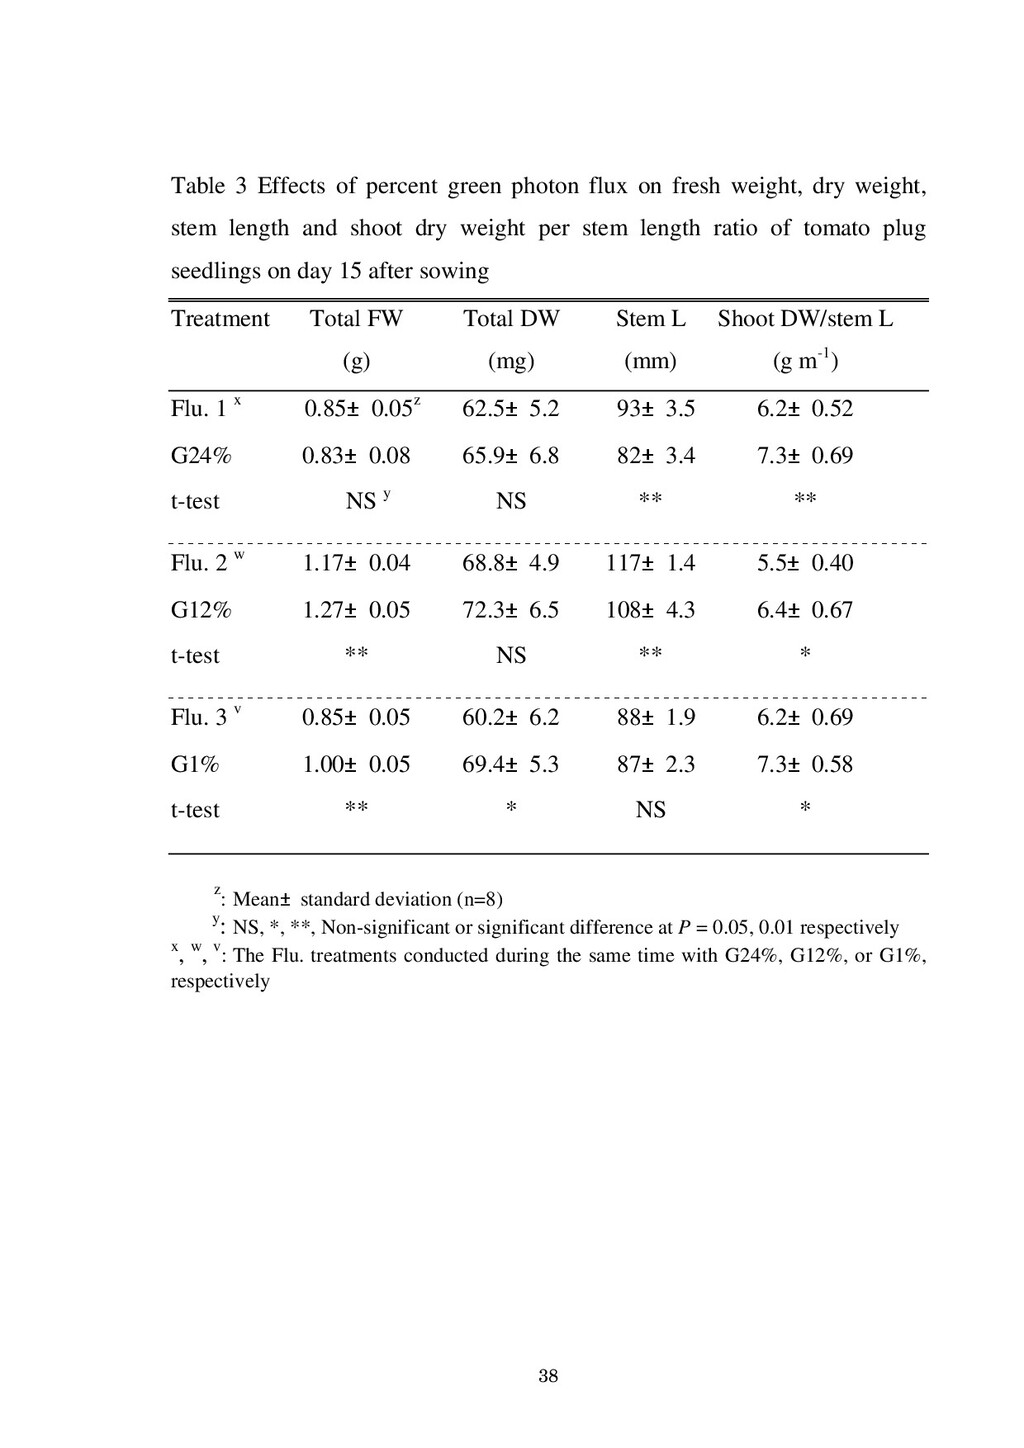
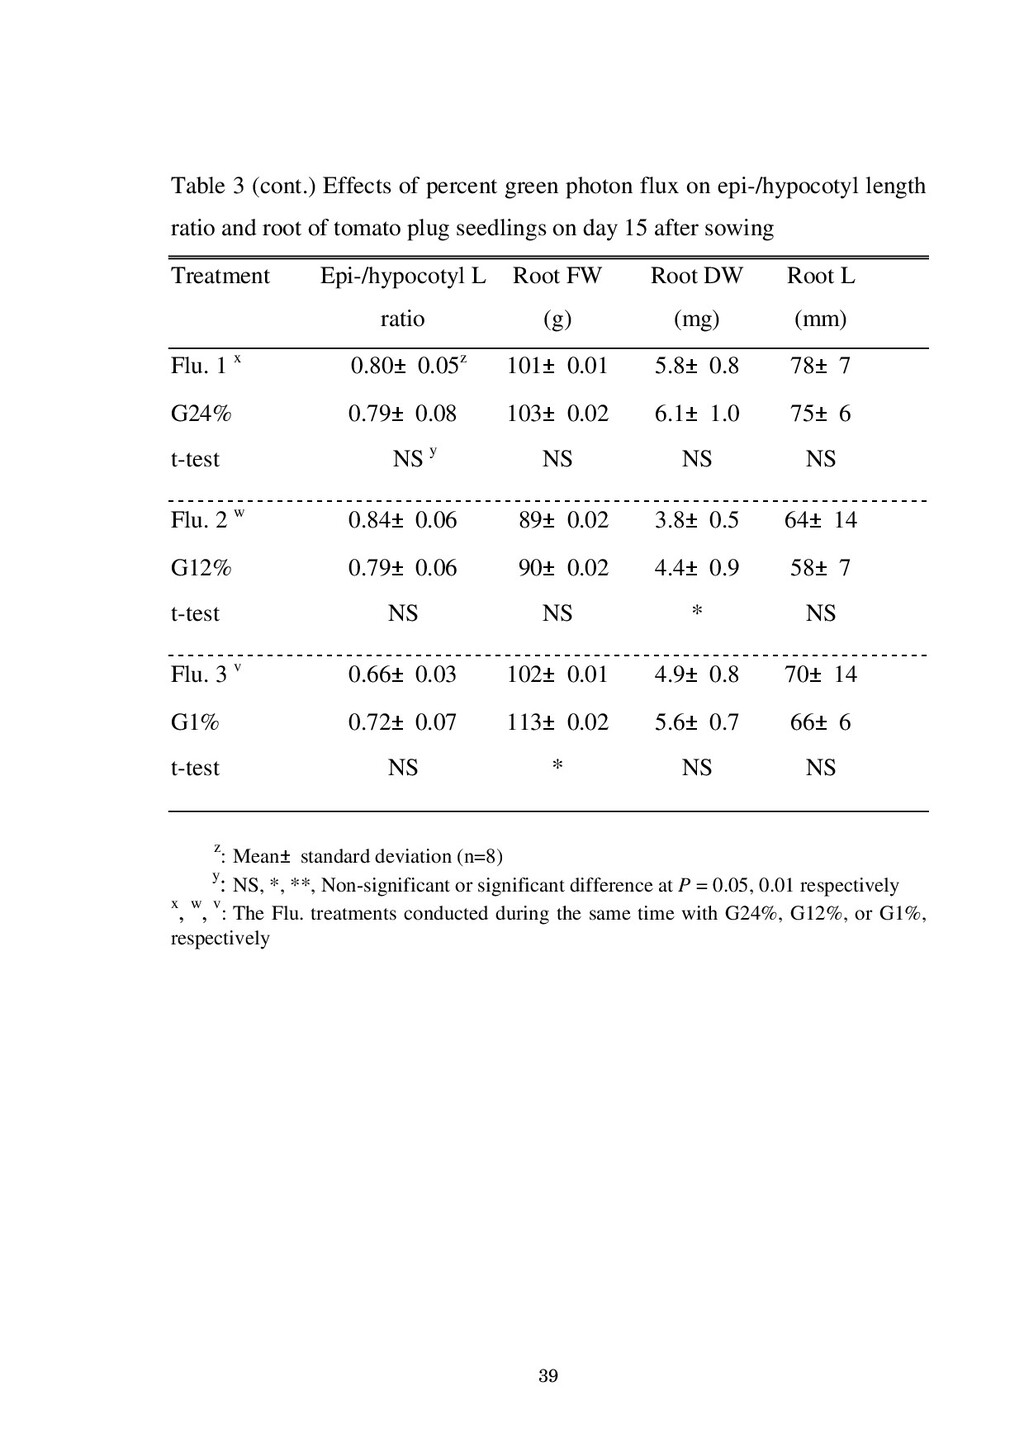
    growth of tomato plug seedlings on day 15 after sowing is shown in Table 3. The relative growth and specific growth of seedlings are shown in Table 4 and Table 5, respectively. For the fresh weight, there was no significant difference between the total fresh weight of G24% seedlings and that of the seedlings under fluorescent light, while the total fresh weight of G12% and G1% seedlings were significantly greater than those of seedlings under fluorescent light. In other words, total fresh weight of the seedlings increased with decreasing green PF. For the dry weight, only the total dry weight of G1% seedlings was greater compared with those of seedlings under fluorescent light. However, there was also no significant difference in the relative total dry weight and specific total dry weight among all the treatments. The slightly increased dry weight might be attributed to the leaf expansion as affected by the red PF, data as shown the next section. However, Papadopoulos and Ormrod (1988) reported that the net photosynthesis of the upper part was 1.43 times higher than that of the lower parts at 23 cm spacing, while they were nearly the same at 45 cm spacing. Therefore, since the plug seedlings were grown in a high planting density, the interception of light within the canopy could be also considered a factor influenced the increasing of dry weight. However, when comparing the absolute total dry weight of tomato plug seedlings under G1%, G24% and fluorescent light, there was also no significant difference among the total dry weight of those seedlings.
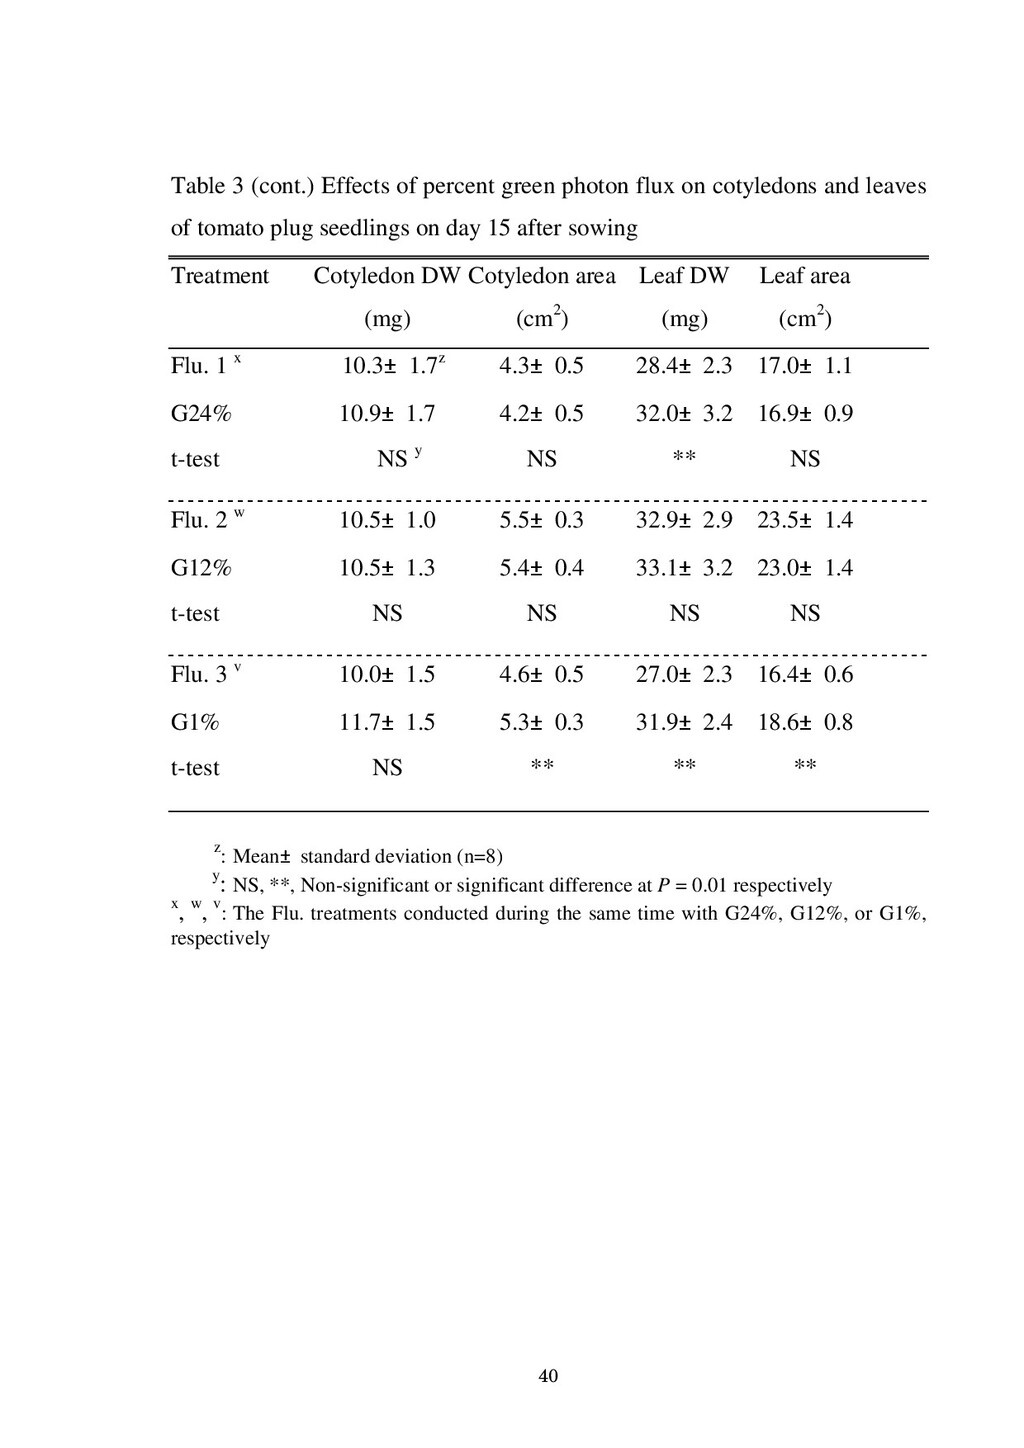
  17. 14 1.3.2 Expansion of cotyledons and leaves Area, relative area,

    and specific area of cotyledons and leaves are shown in Table 3, Table 4, and Table 5, respectively. The results showed that only cotyledons and leaves of G1% seedlings were larger than those of seedlings under respective fluorescent light and also were the largest among treatments of 3 various percent green PF. Fukuda et al. (1996) has previously reported on tomato plants, grown by hydroponics using color lamps as the light sources. Red (600-700 nm) and yellow (550-600 nm) lights affected the expansion of leaves, while green (500-550 nm) and blue (400-500 nm) light resulted in reducing the leaf size. From the results of the present study, however, it can be concluded that the green light (500-600 nm) suppressed the expansion of tomato seedling cotyledons and leaves because even the G1% containing a given blue PF, the enlargement of leaves could be observed. In addition, the response was the same in cotyledons. Thus, the expansion of cotyledons and leaves may attribute to the increasing dry weight and fresh weight of G1% seedlings.
  18. 15 1.3.3 Elongation of stem The relative stem length of

    G24% and G12% seedlings were shorter compared with that of G1% seedlings, respectively. In other words, the stem length of seedlings was significantly decreased with the increasing percent green PF. However, there was no significant difference between stem length of G1% seedlings and that of seedlings under fluorescent light. In addition, since the decreasing height, as affected by increasing percent green PF, of seedlings grown under fluorescent light could not be clearly shown, it might be explained by the effects of FR light that influenced the response of seedlings against green light. However, the ratio of shoot dry weight to stem length of seedlings grown under LED light was about 20% greater than that of seedlings grown under the fluorescent light, while, there was no significant difference among seedlings grown under LED light. These results also confirmed that the stem elongation of seedlings under fluorescent light was affected by the far-red PF, which was also the highest in the fluorescent light. (Downs et al., 1957; Decoteau and Friend, 1990; Miyashita, 1994; Kirdmanee et al., 1996). Moreover, the results suggested that the effects of light quality on both hypocotyl and epicotyl elongation were the similar since there were no significant difference in the ratios of epicotyl/ hypocotyl length of those seedlings.
  19. 16 1.4 Conclusions Total fresh weight of tomato plug seedlings

    decreased with increasing percent green PF of the light source. However, the changed percent green PF and percent red PF with maintaining PPF level did not affect the total dry weight of plug seedlings. In other words, green light is as effective as red light on growth of plug seedlings in term of dry weight. The various percent green PF did not directly affect the growth of plug seedlings without the process of photomorphogenesis. The expansion of cotyledons and leaves could increase dry weight of seedlings, but the difference was not significant. This might be caused by the overlapping leaves, which is difficult for light to intercept the seedlings inside the canopy. The light quality shows the effects on leaf and cotyledon area, stem height and compactness of plug seedlings. Therefore, it means that the quality of seedlings could be improved by the mean of light quality manipulation. The plug seedling growth has close relationship with the seedling height, since the leaf canopy get closer to the light source. The vertical level adjustment should be recommended for the precise study of light responses at a given light intensity on the canopy level.
  20. 17 Chapter 2 Transmission of blue, green, and red through

    tomato leaves 2.1 Introduction A canopy structure mainly influences its own microenvironment and the light interception by surrounded leaves (Nobel et al., 1993). The growth of plug seedlings mainly depends on the intensity of light incident upon the leaves, however, unexpected appearances of plug seedlings like necrotic leaves, uneven growth etc. may occur under the over increase of light intensity (Styer and Koranski, 1997). That is because the upper leaves received almost of the light incident upon them, and thus the seedlings inside the canopy will be elongated due to the shading responses. Attempts to increase planting density has been continuously studied in order to increase the utilization of space and to decrease the production cost per plant. However, dramatic decrease in the growth of plug seedlings with the increasing planting density has not been overcome. Thus, the ideal light which can be evenly absorbed by leaves in vertical orientation is necessary. The objective of this experiment was to investigate the quality and intensity of light under the layers of tomato leaves under various percent green photon flux and under the green, blue or red light of LEDs. Differences in characteristics of the light under the leaves of seedlings and that of mature tomato plants from a field were also studied.
  21. 18 2.2 Materials and methods 2.2.1 Plant materials Intact unfolded

    leaves were obtained from tomato plug seedlings grown in the culture room at 230 µmol m-2 s-1 PPF and 16 h d-1 photoperiod provided by white fluorescent lamps (FLR40S EX-N/M-X-36, National Co. Ltd., Japan), 26ʶ2ˆ/ 22ʶ2ˆ air temperature (photo-/ dark period) and 70 ʶ10% relative humidity. For the comparative study, intact leaves were also obtained from mature tomato plants cultivated in the field (Chiba, Japan; July-August 1997). 2.2.2 Measurement of light quality and intensity under the leaves Blue (1188 lamps, peak at 475 nm; Nichea Chemical Co. Ltd., Japan), green (1188 lamps, peak at 535 nm; Nichea Chemical Co. Ltd., Japan) and red (2376 lamps, peak at 650 nm; Hewlett Packard Co. Ltd., Japan) LEDs or the fluorescent lamps (FLR40S EX-N/M-X-36; National Co. Ltd., Japan) were used as light sources. Spectral distributions of light under the intact leaves of tomatoes were investigated under the different qualities of light sources. A photo-sensor (remote-cosine receptor, LI 1800-1; LICOR Inc., USA) of the portable spectroradiometer (LI-1800; LICOR Inc., USA) was fixed on the stand. Then, the leaf samples were placed over the photo-sensor, and fixed by white paper with a hole in the middle. From the preliminary observations, the continuous measurements did not cause any significant differences, but changes in the measuring points caused significant differences between each time of measurements. Thus, the same samples were used for the measurements under every light quality. The
  22. 19 spectral photon flux was investigated in wavelength region between

    330 and 1100 nm. It took about one minute to complete one cycle of measurement by the spectroradiometer and another one minute to prepare the proper light quality by manually adjusting the electric current output of the LEDs. The measurements were conducted at 23ʶ1ˆ air temperature, and 60% relative humidity. The transmittance, an index to determine transmission, was calculated from the ratio of photon flux of light transmitted through the layer of leaf samples to the photon flux reading without any leaf samples. 2.2.3 Experimental design There were two factors, light quality and number of leaves, in the experiment. The factor of light quality included three complementary colors, blue, green and red light, and also their combinations, as used in Chapter 1. The number of leaves was one (single) and two (double) leaves.
  23. 20 2.3 Results and discussions 2.3.1 Transmittance and the quality

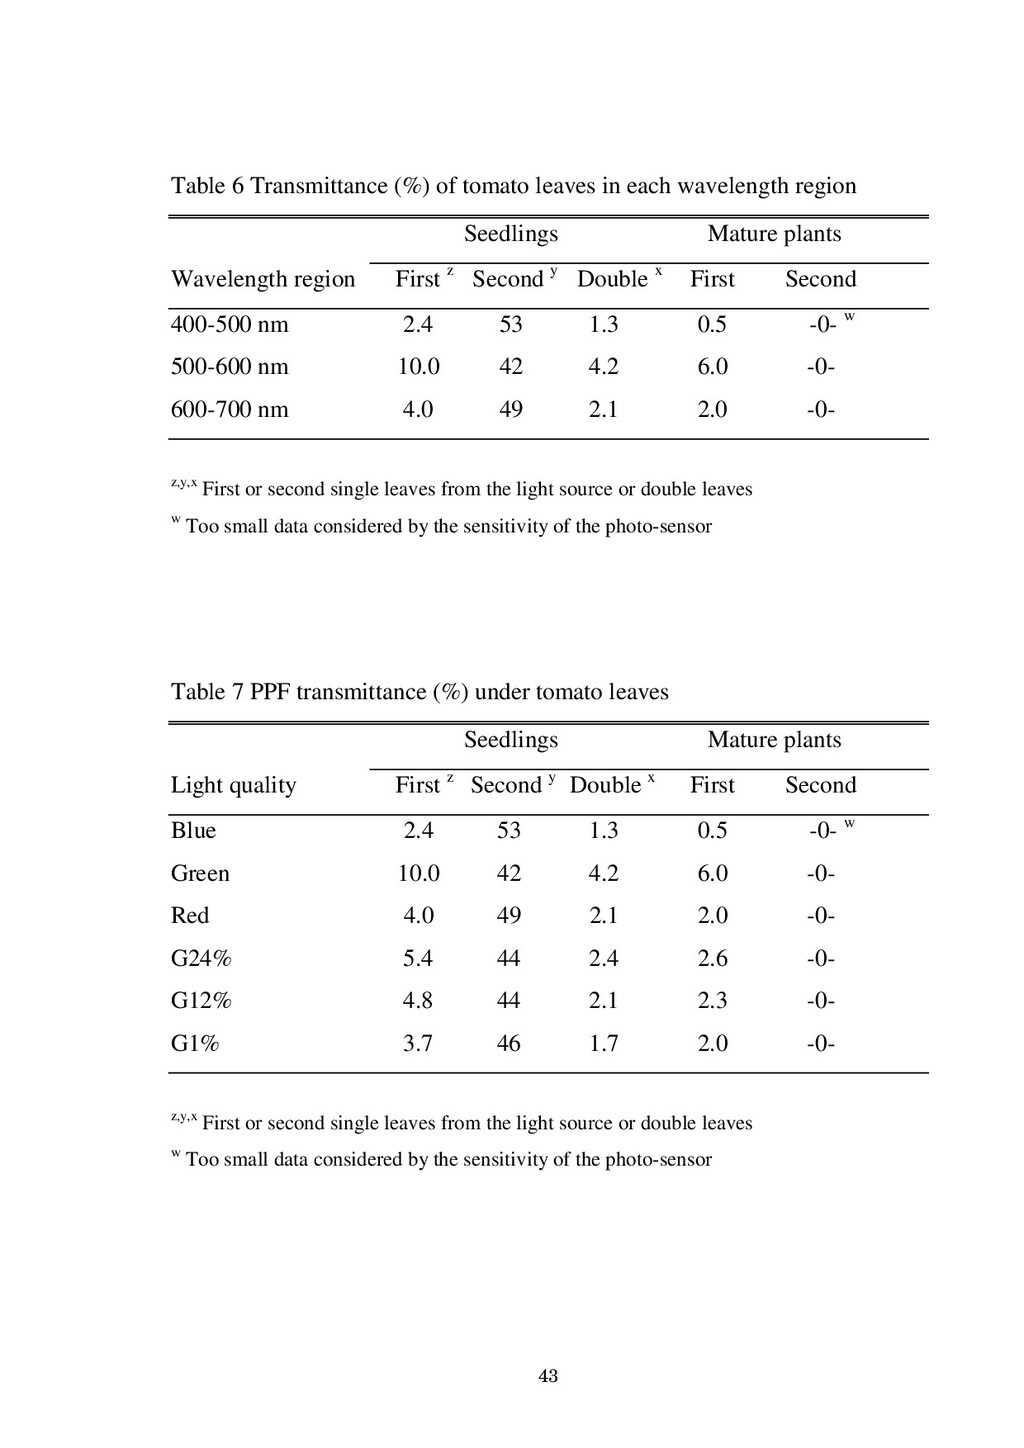
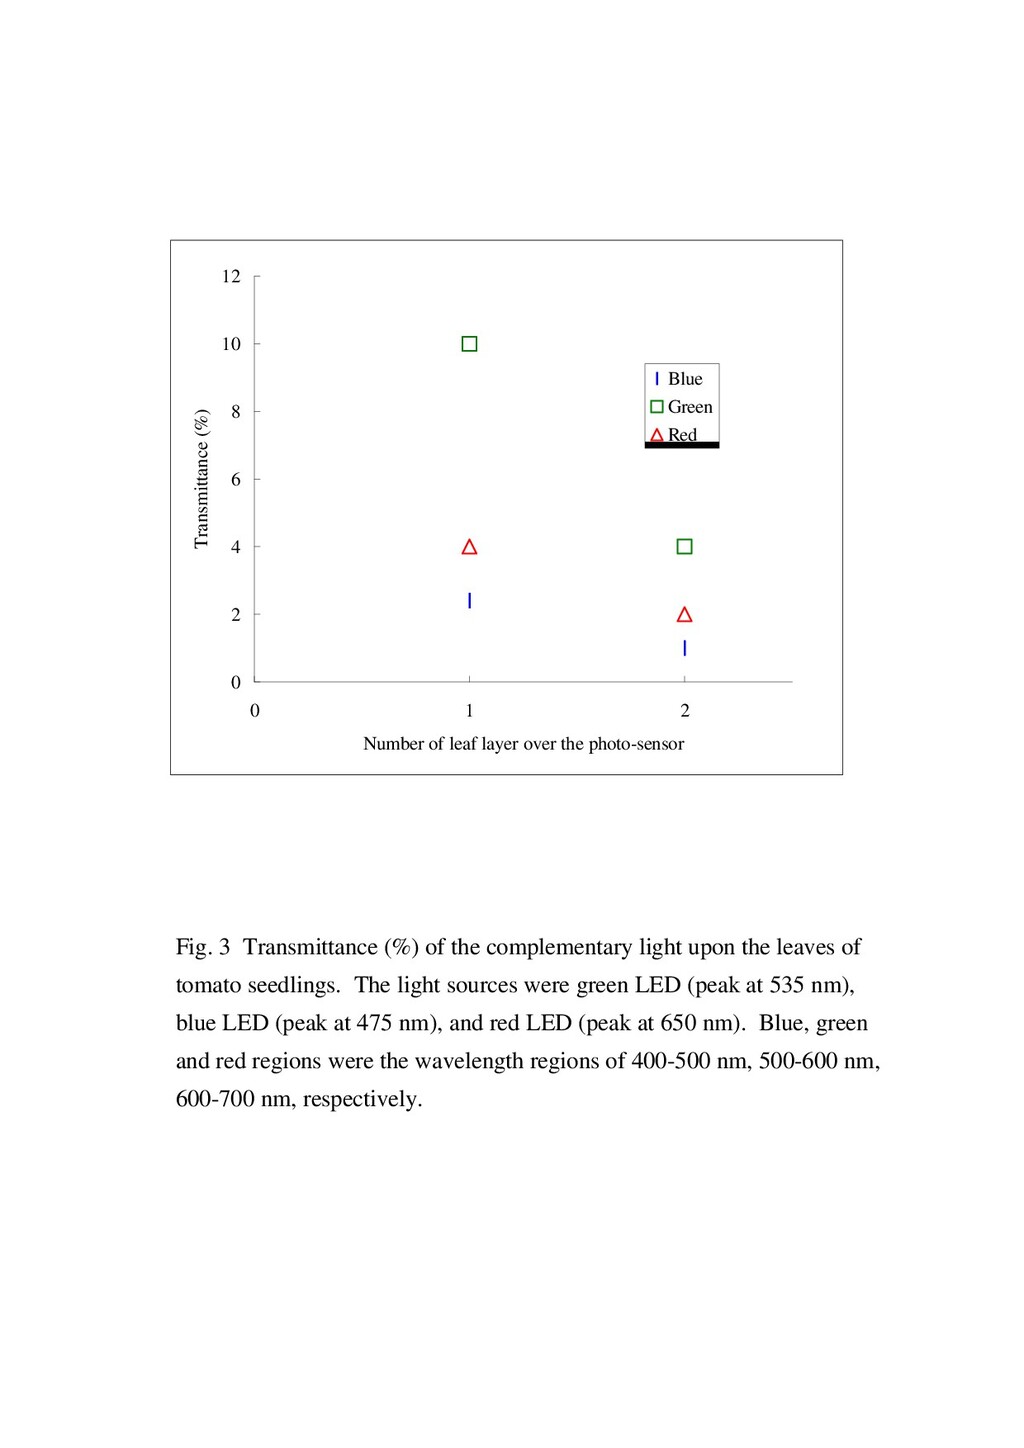
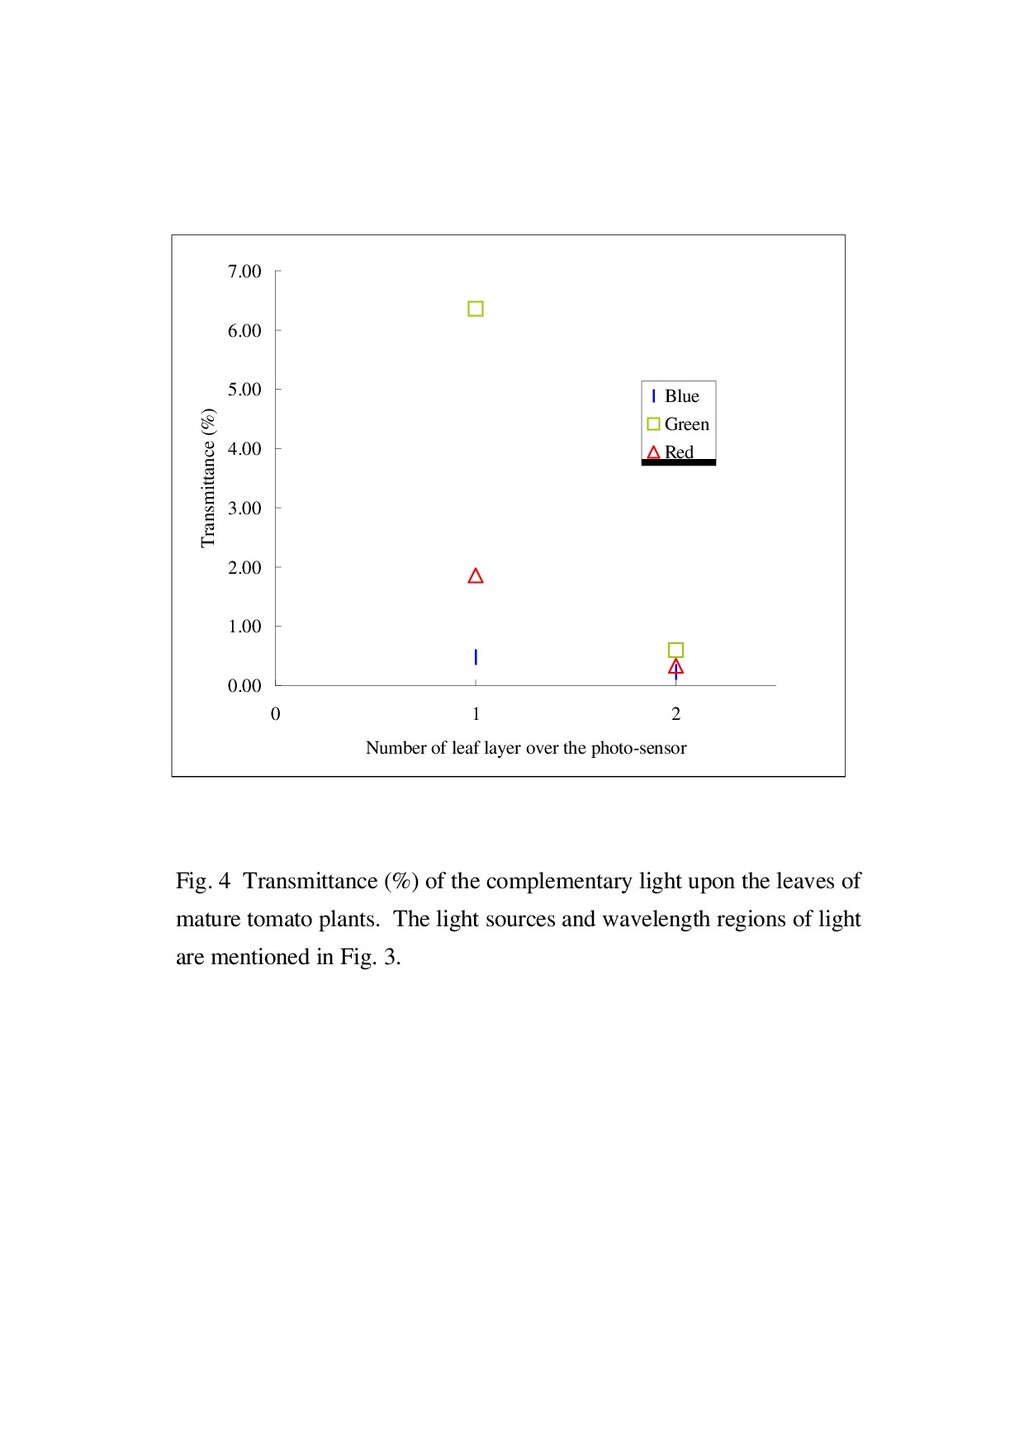
    of incident light As shown in Fig. 3, Fig. 4 and Table 6, the transmittance of green light was larger compared with those of and red light, respectively. Therefore it could be assumed that the light with more green PF could effectively penetrate more layers of tomato leaves. In other words, the PPF detected inside the canopy should be higher under the light of higher green PF. Also, the transmittance of light with higher green ratio was greater than that of light with lower green ratio (Table 7). Under the second layer of leaves, however, the light intensities were nearly the same among those light qualities. Most of the PF might be absorbed at the second layer of leaves before it can be detected by the photo-sensor. Thus, it can be concluded that the light transmitted through the first layer of leaves can be absorbed by the second layer of leaves, and the green light is considered evenly absorbed by the layers of leaves. However, it should be noted that the leaves in nature are not perfectly overlapped, therefore not only the transmitted light but also reflected light and scattered light through the canopies should be get into consideration.
  24. 21 2.3.2 Changes in light quality From the spectral distributions

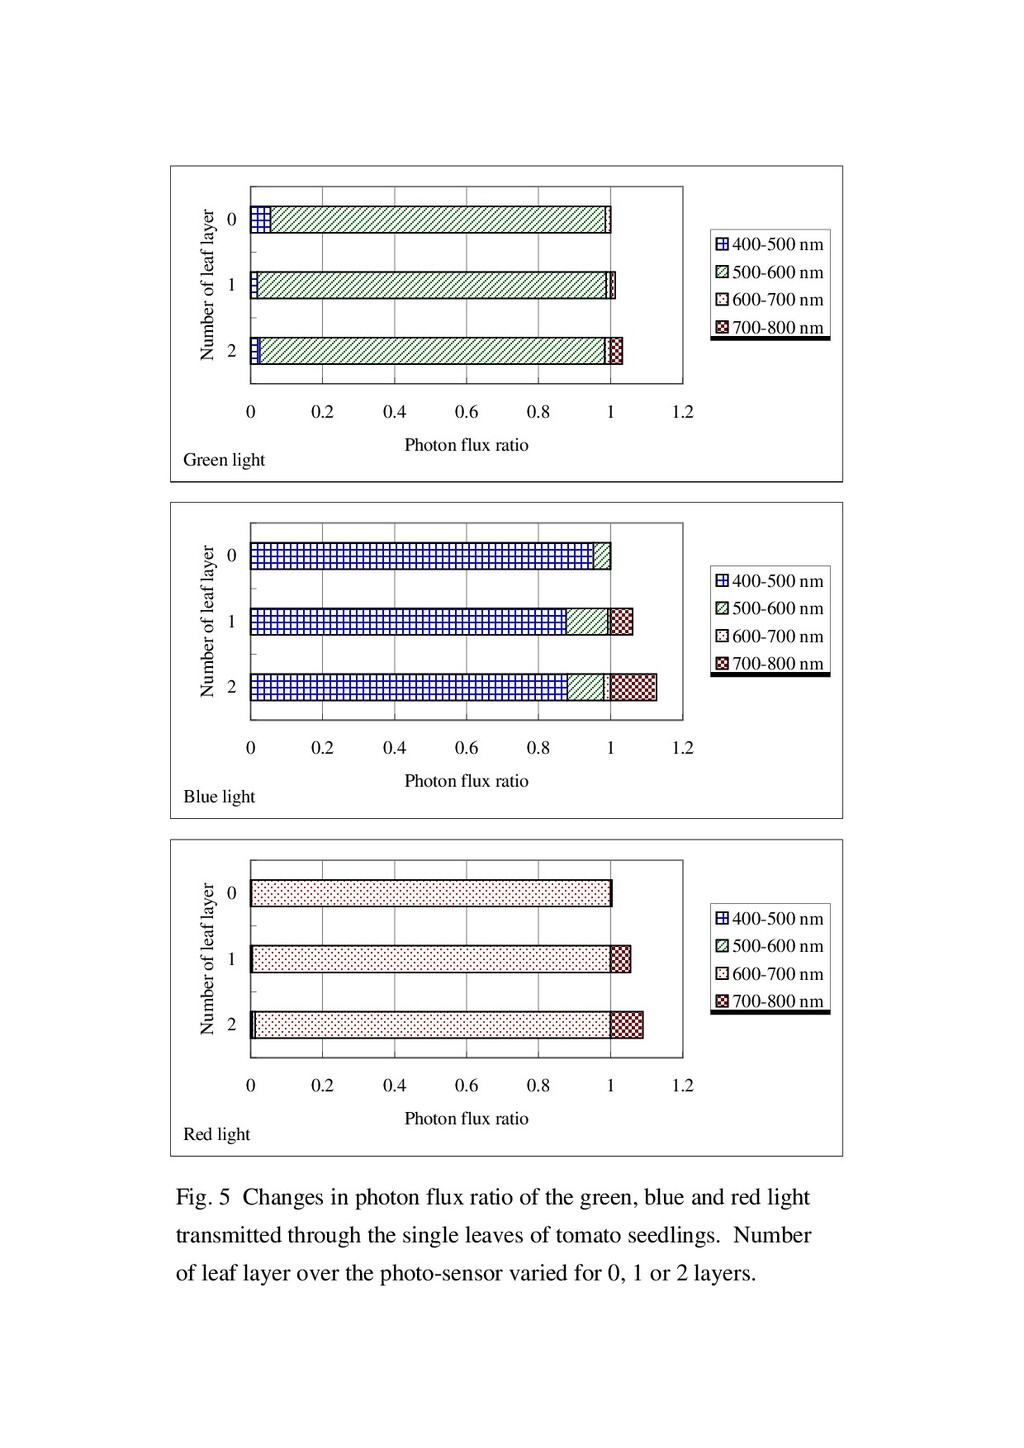
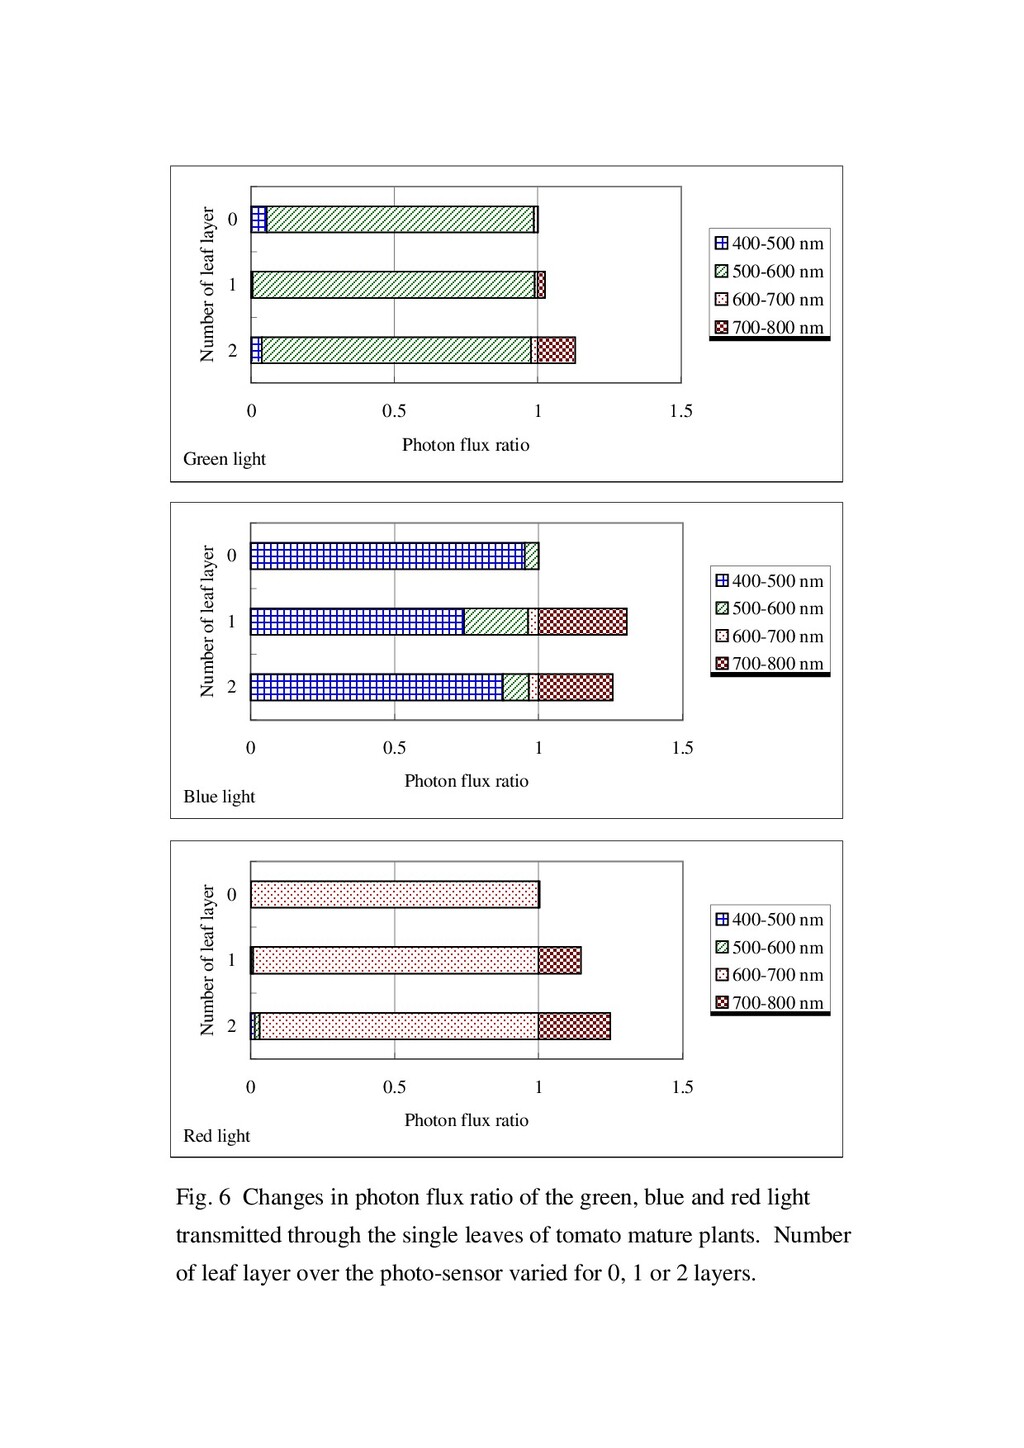
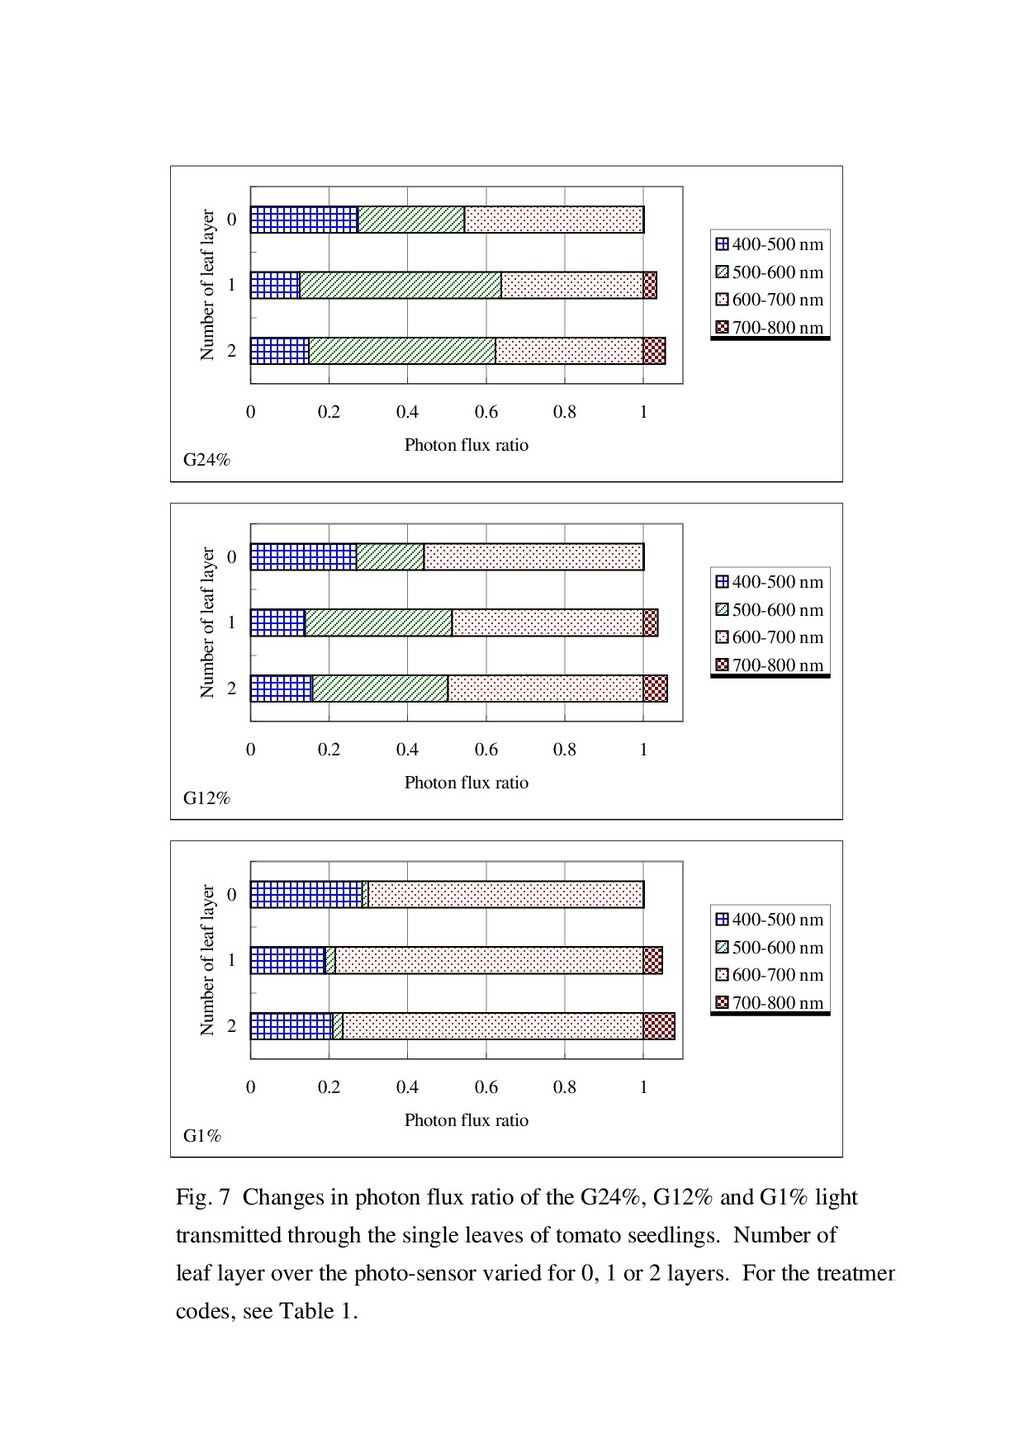
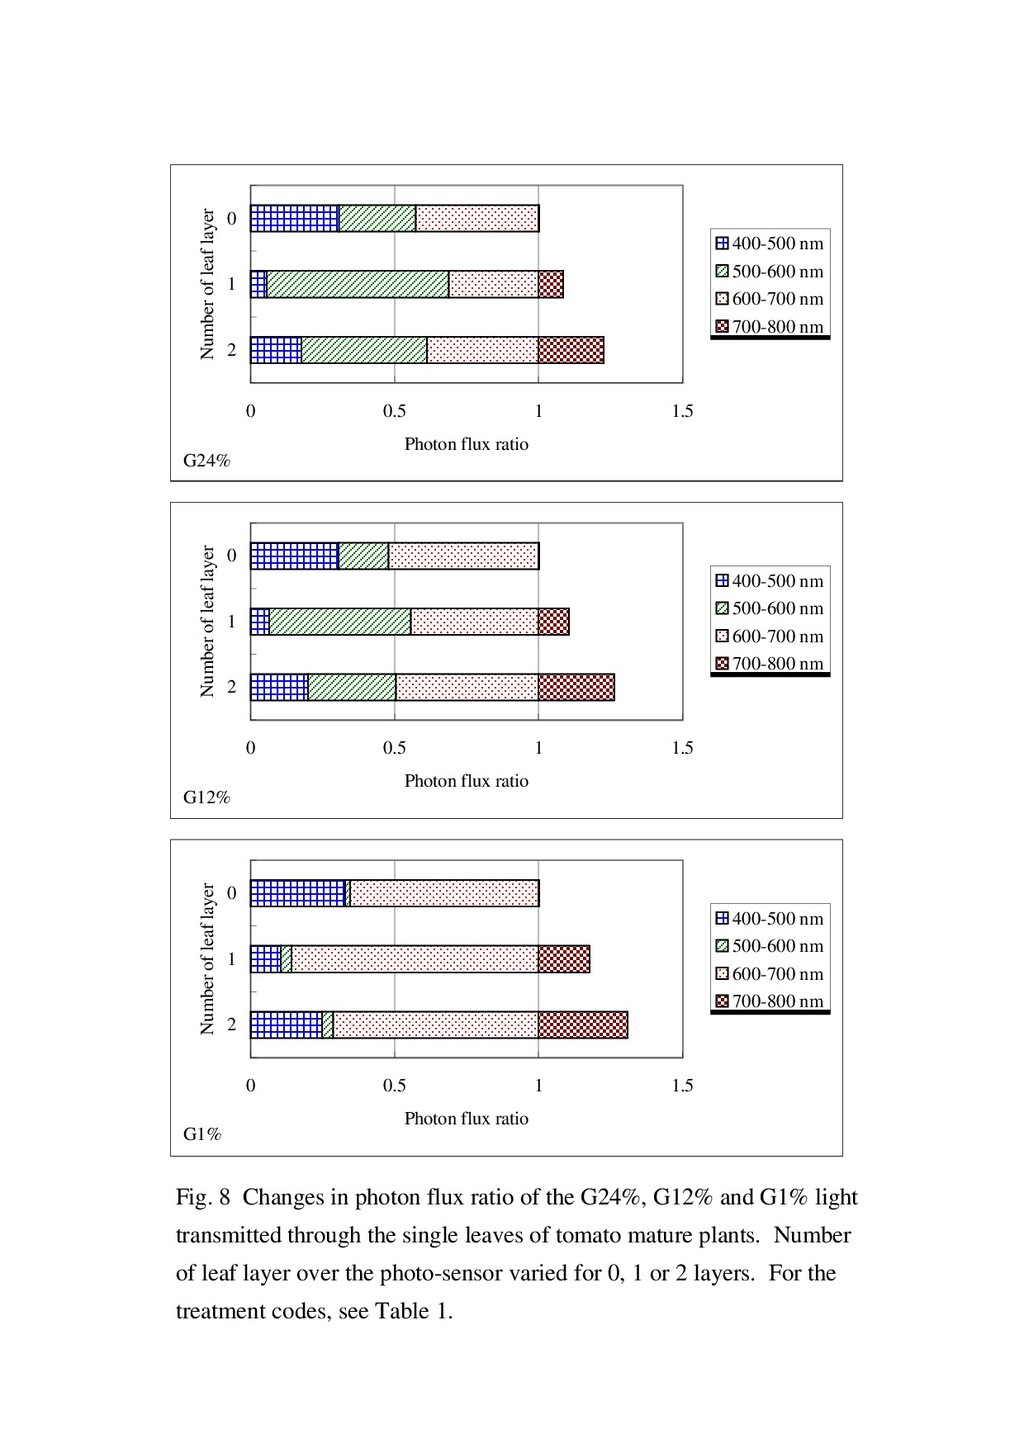
    of light under the tomato leaves, not only the intensity but also the quality of light reached to the lower layers of leaves were also changed, as shown in Fig. 5, Fig. 6, Fig. 7 and Fig. 8. Within the PPF region, green ratio of light was increased after transmitting through the first layer of leaves, while blue and red ratios were decreased. The increased percent green ratio of transmitted light might be attributed to the higher transmittance of wavelength regions of green than that of other wavelength regions. When considering the PPF with FR region, the ratio of PPF:FRPF was decreased, and the PF ratios of B:FR, G:FR, and R:FR were also decreased with the increasing number of leaf layers that the light penetrated, while the decreasing rate was variable dependent upon the qualities of incident light. The phenomenon was the same as in the leaves of tomato mature plants. It might be attributed to the different transmitting rate of green, blue and red light through tomato leaves, as shown in Fig. 6, Fig. 8 and Table 6. The discussion about the increasing FR ratio will be discussed in Chapter 3.
  25. 22 2.3.3 Changes in patterns of spectral distributions For the

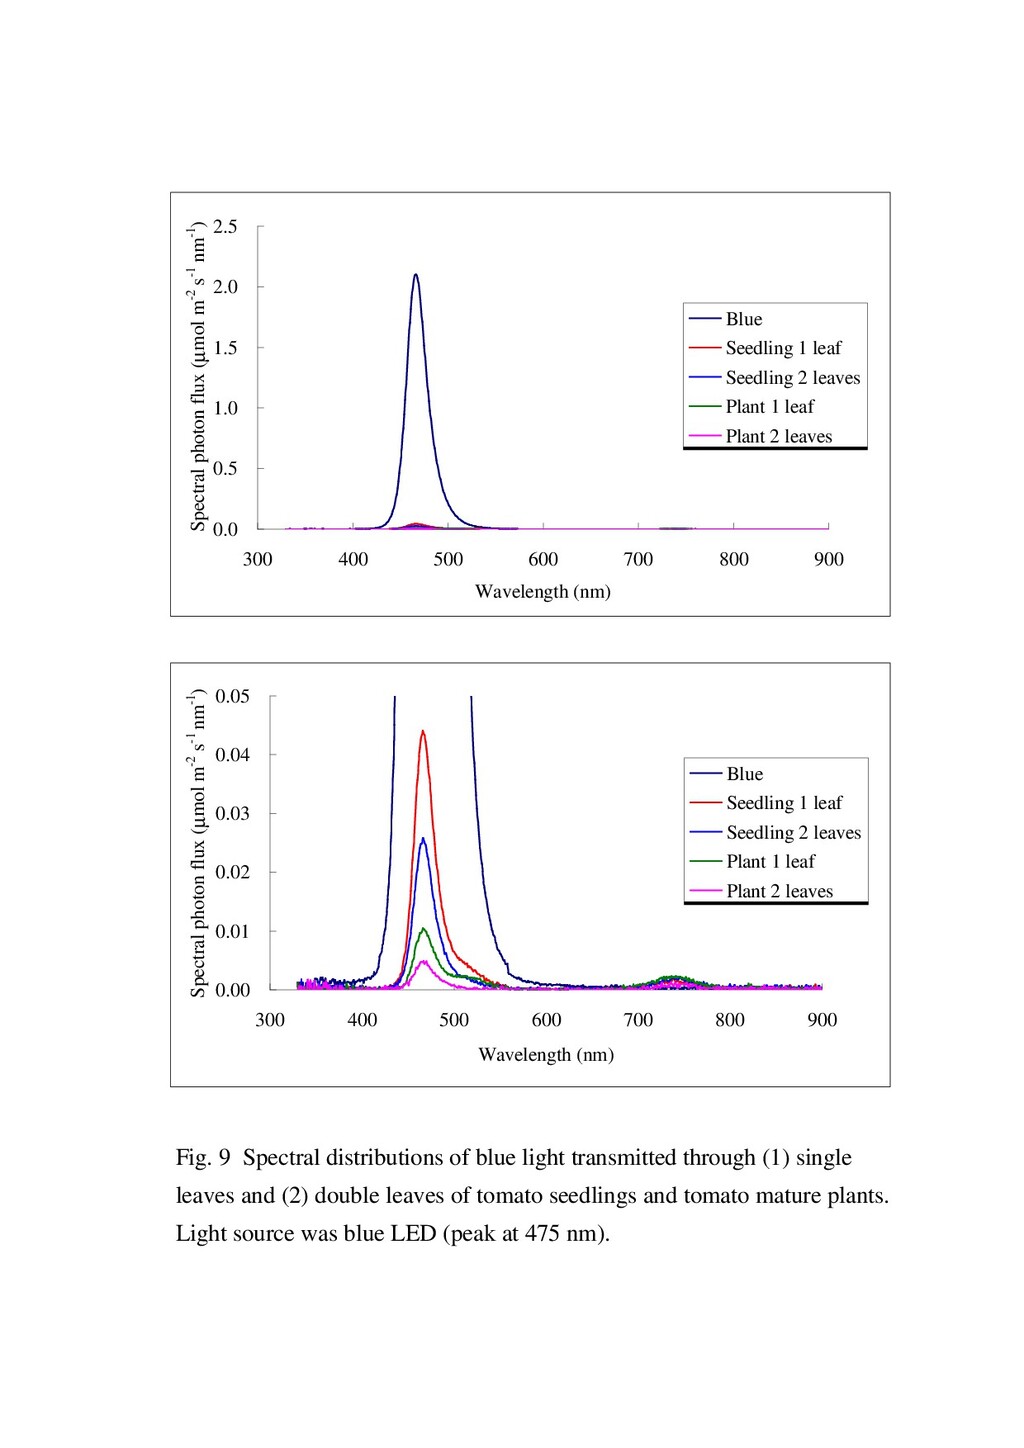
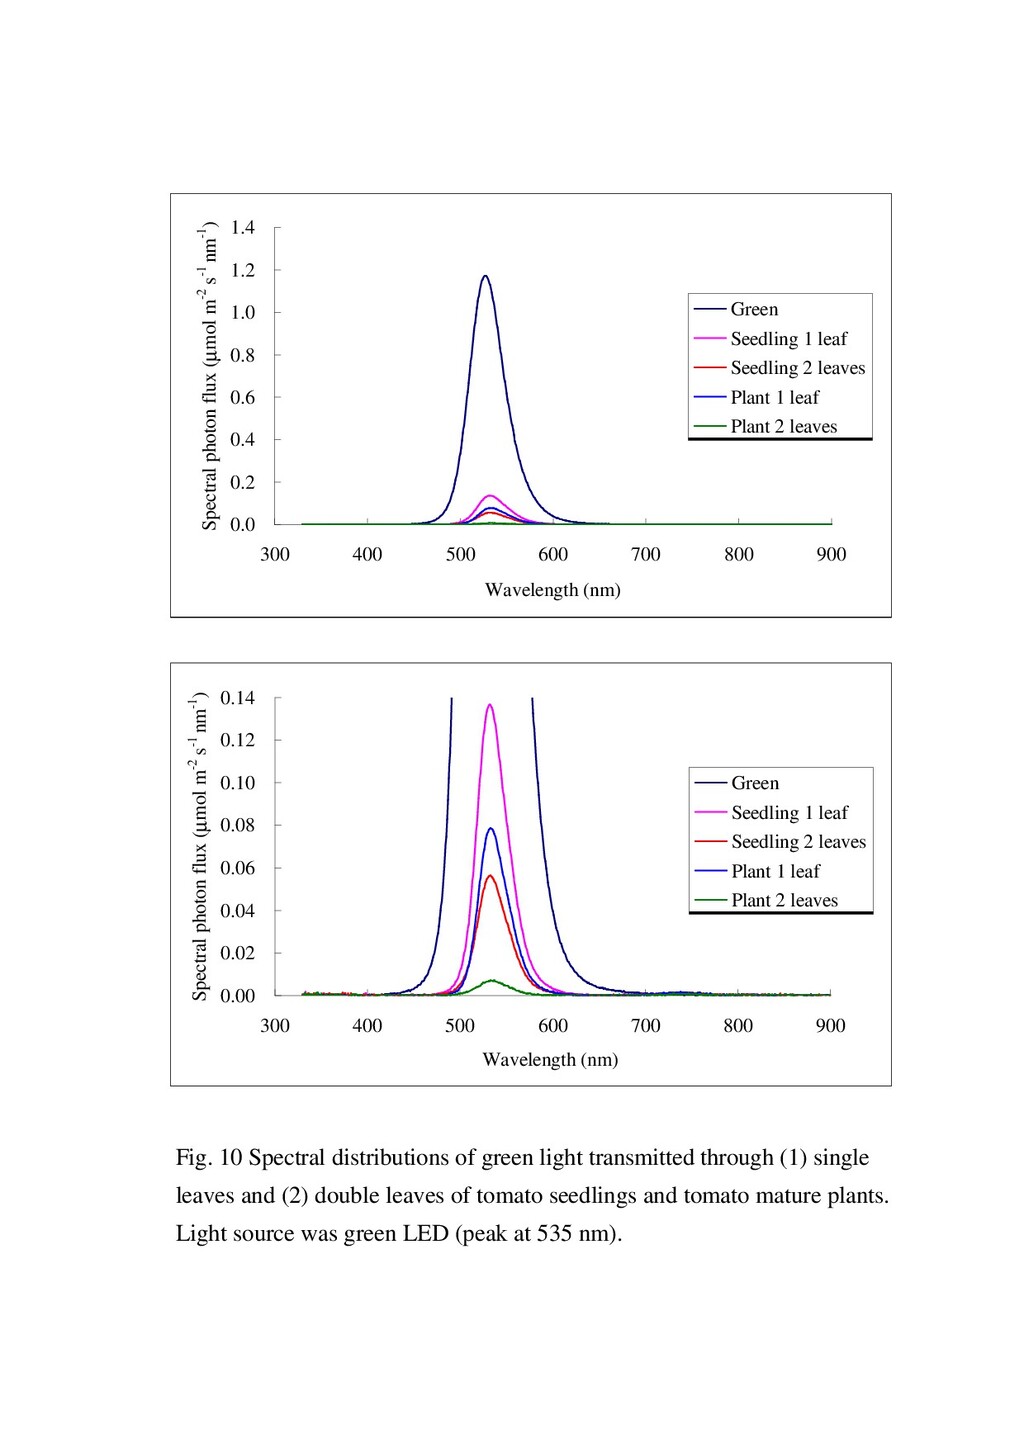
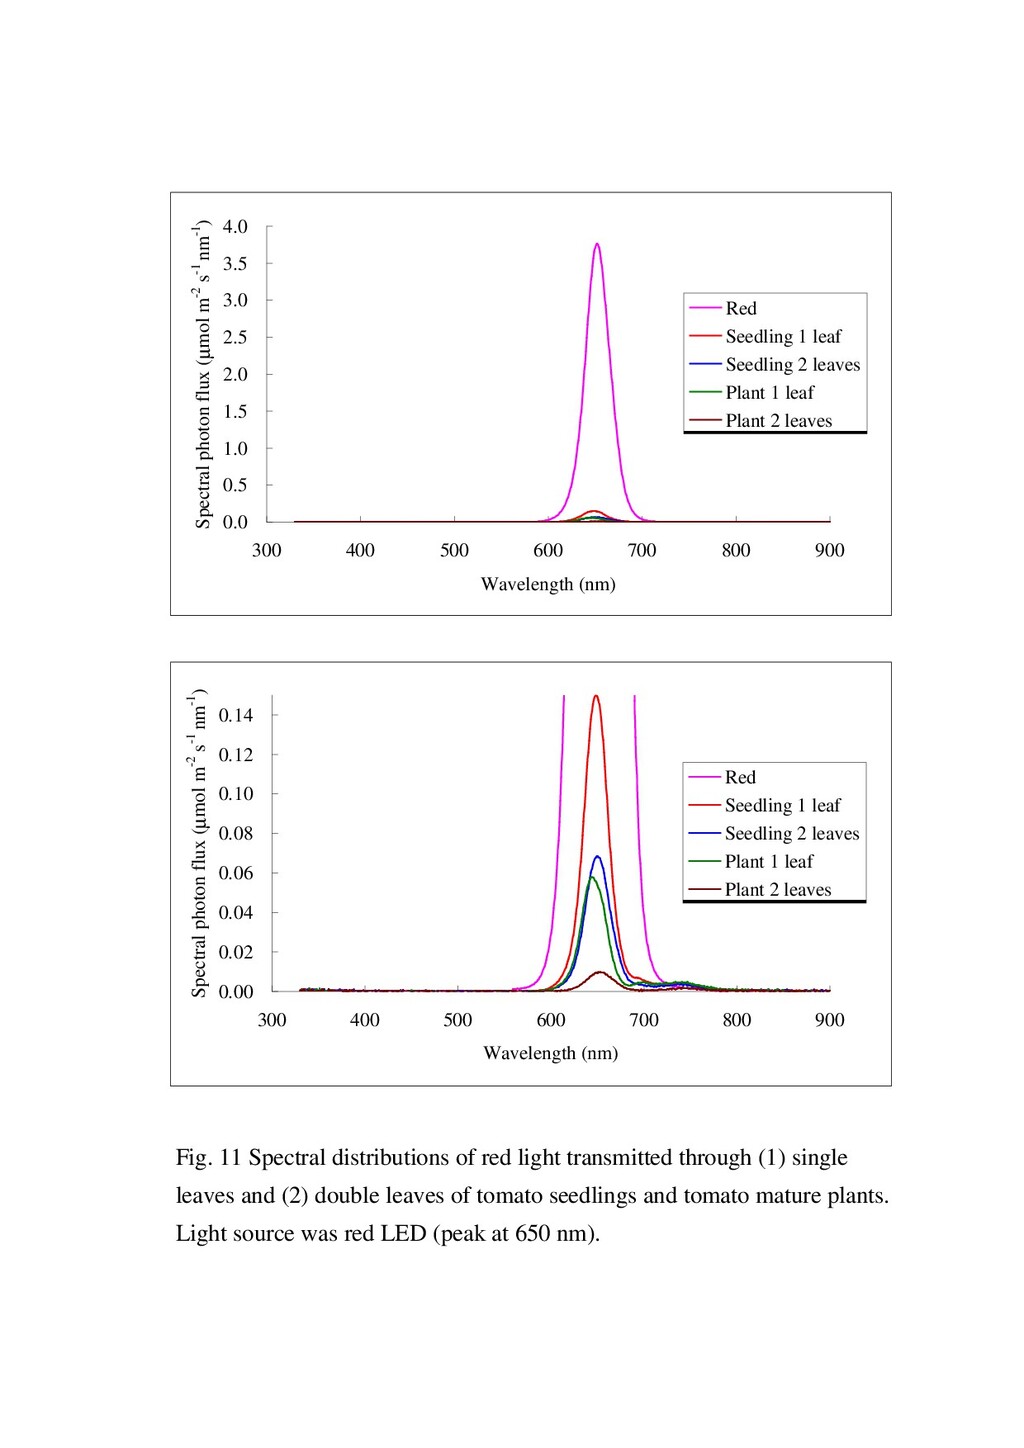
    blue light using blue LED providing single peak within relatively narrow wavelength region, even though the shoulder of peak in wavelength region of 500-550 nm was observed after the light transmitted though the leaves of seedling or mature plants. In addition, the peak in wavelength region of 700-800 nm (termed FR peak) was detected, even there was no any peak in that wavelength region of the light incident upon the leaves, as shown in Fig. 9. For the green light, as shown in Fig. 10, regardless of the decreasing in light intensity, there was also the FR peak found with lower PF level compared with the blue light. For red LED, as in Fig. 11, the peak in wavelength region of 700-800 nm was also found with the minor peak in wavelength region of 680-700 nm. Furthermore, there was also the shifting of peak when using the leaves of mature tomato plants, but it was not found under the double layer of leaves. The distribution of spectral photon flux of light transmitted through the leaves of tomato seedlings were different from those of light transmitted through the leaves of mature tomato plants. It might be dealing with the age of leaves, positions on the leaves, biochemical components inside the leaves, and culture conditions, etc., which may influence the optical characteristic of leaves (e.g. Krause and Weis, 1988). The further discussion in this Chapter will be only on the shifting in wavelength region of blue. The presence of peaks in wavelength region of FR will be discussed in Chapter 3.
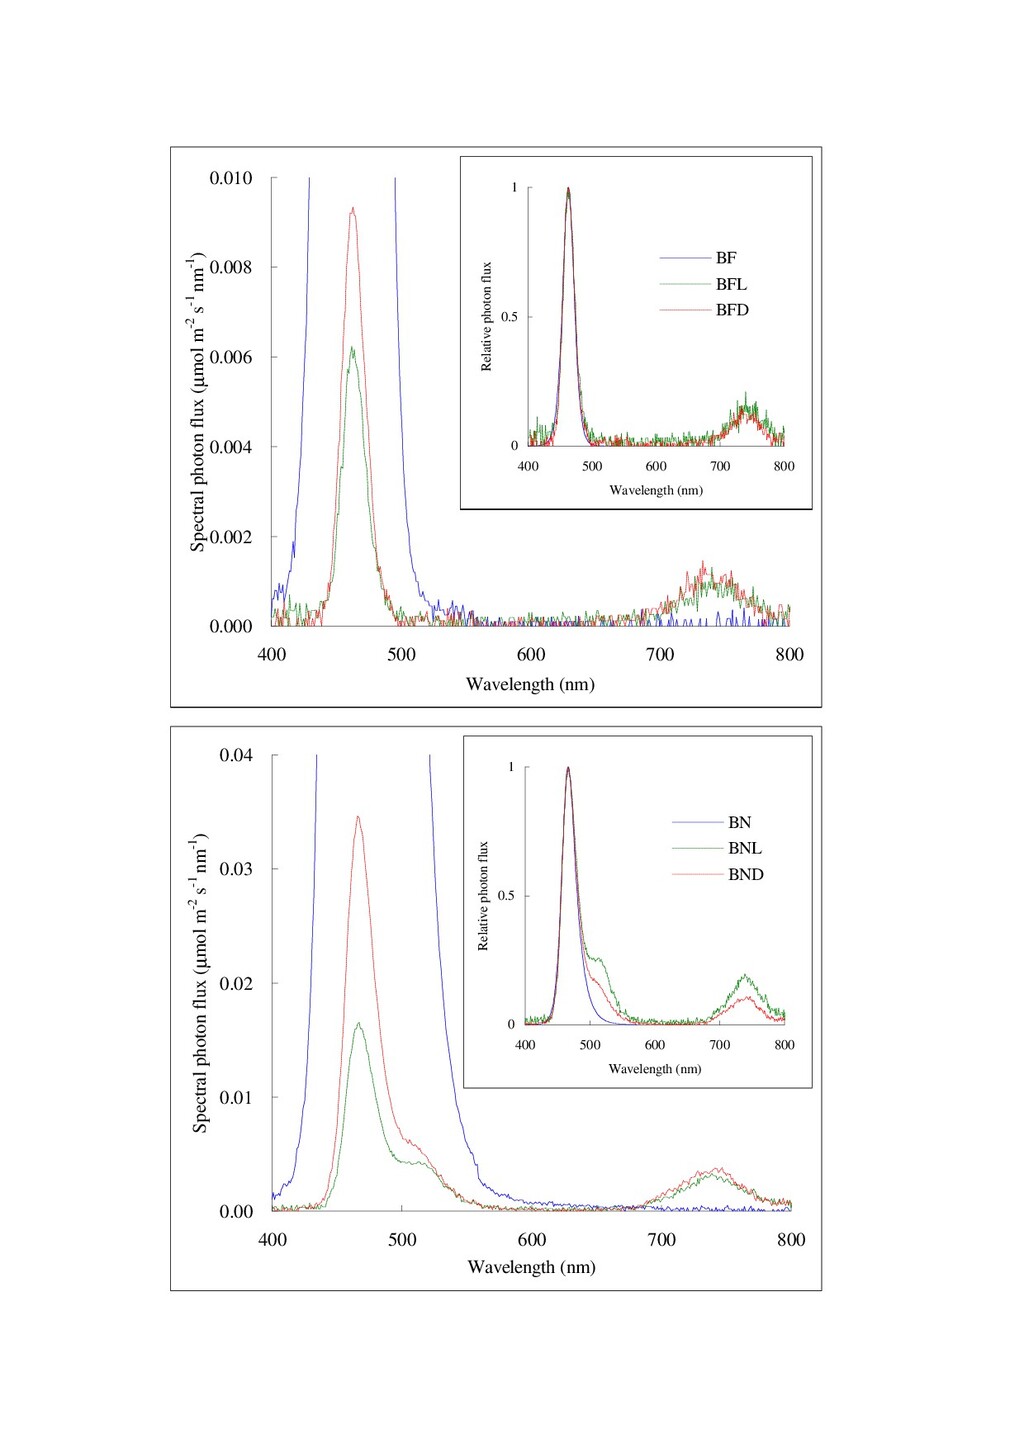
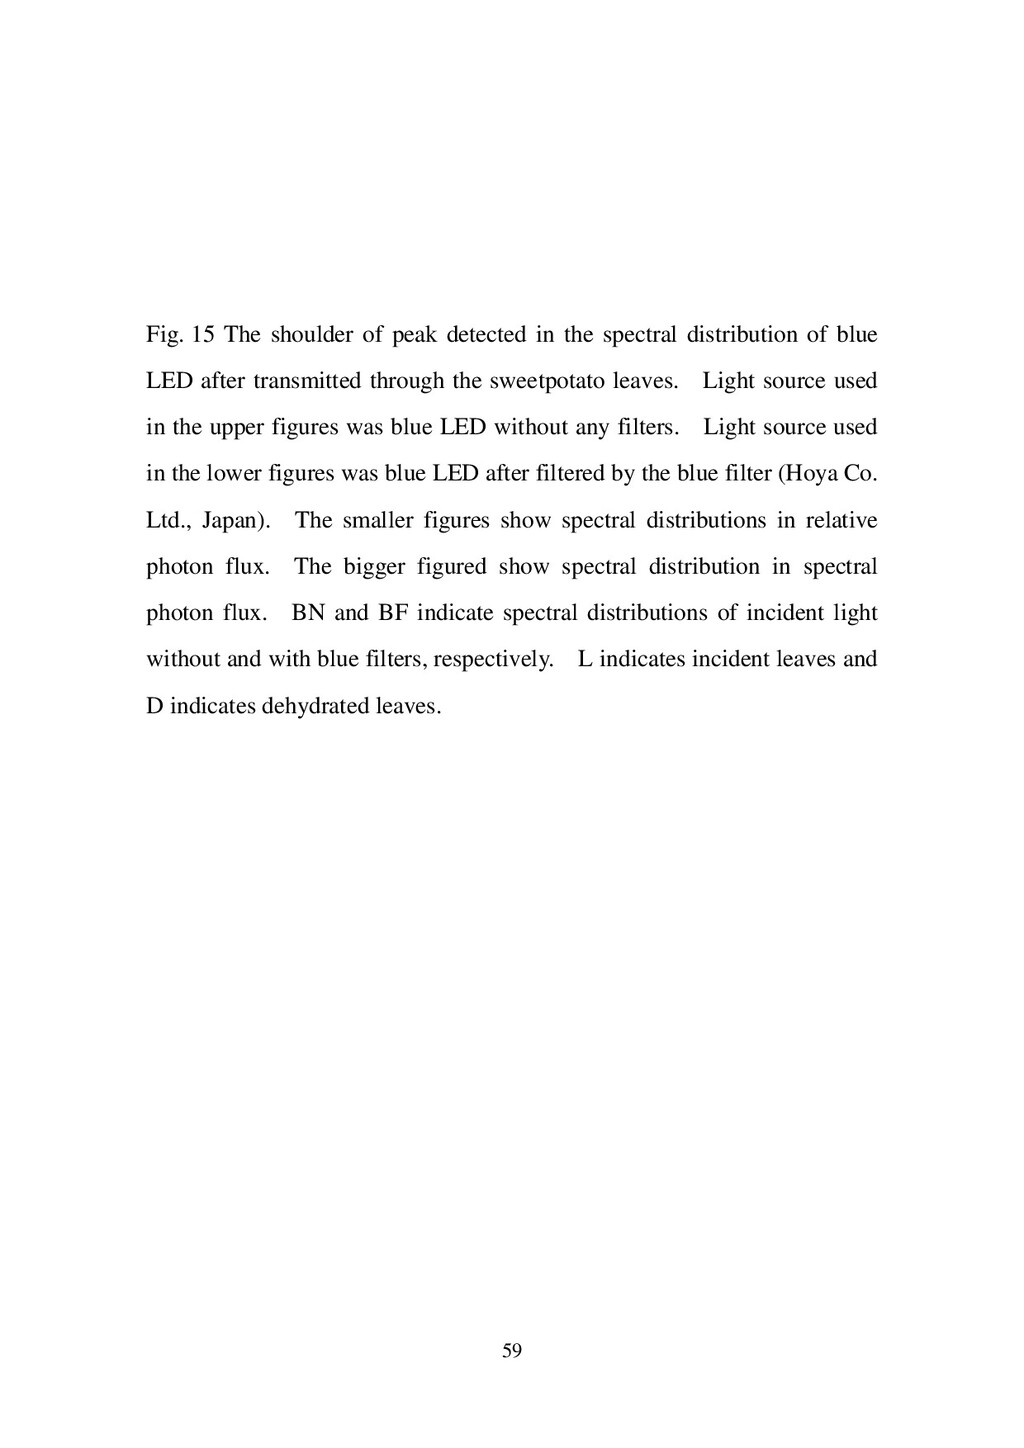
  26. 23 2.3.4 Changes in patterns of a peak in blue

    region To discuss the changes in the peak pattern of blue LED, another measurement was conducted separately using sweetpotato leaves. The light from blue LED also included the PF in wavelength region of green, therefore, a blue filter (Hoya Co. Ltd., Japan) was used to eliminate PF in wavelength region of green. The results showed that the peak of the transmitted light was at the same position to the incident light for both the light from blue LED and the filtered blue light, as shown in Fig. 15. There were only decreasing in light intensity without any remarkable changes in pattern of the peak when using the filtered blue light. Thus it can be proved that the shifting or changing of the peak pattern in region of blue did not concern with any relation to the specific properties of photons in wavelength region of blue or shifting energy level of the photons. On the other hand, it could be explained by the differences in transmittance of light between the different wavelength regions of blue and green.
  27. 24 2.4 Conclusions The quality and intensity of light below

    the canopy are depending upon the transmittance of leaves varied upon the wavelength regions. The higher transmittance of green light than those of blue and red light, respectively, affects the changes in quality of light under the layers of leaves. Furthermore, the increasing green ratio of the incident light can increase the transmittance of the tomato leaves. In other words, the green light could be evenly absorbed by the layers of leaves within the canopies. The PF ratios of B:FR, G:FR, and R:FR were decreased under increasing number of leaf layers, but the decreasing rates were variable. The tomato seedlings and plants showed the specific responses to light in limited range of wavelength regions. Therefore, it should be suggested to beware of choosing the light quality for intensive study on plant responses to the light. Laser, another kind of light source, has been developed for providing the monochromic light in many specific wavelengths. It has also been used for applications in many fields of works such as engineering, science and technology, and agriculture. This kind of light source would be beneficial for the intensive studies on plants and their responses to light within the specific wavelengths.
  28. 25 Chapter 3 Chlorophyll fluorescence emitted from the tomato leaves

    Introduction From the Chapter 2, changes in the quality and intensity of light transmitted through the leaves could be observed by measuring light transmitted through the tomato leaves. In addition, a peak in wavelength region of 700-800 nm was found in the spectral distributions of the transmitted light while there was no any peak in the spectral distributions of the light source. It was considered the chlorophyll a fluorescence, which is well-known in several articles, since it is in wavelength region between 700 and 800 nm and it was emitted from the leaves exposed to the light. Kautsky and Hirsch (1934) were the first to report the pattern of fluorescence induction when dark-adapted leaves were exposed to light. Fluorescence emission spectra can also be detected from intact cell, isolated chloroplasts and thylakoid membranes. It was also found that the differences of the light qualities influenced the yield of that emitted light. In this chapter, the light quality effects and fluorescence yield in relation to the transmission of light were discussed.
  29. 26 3.2 Materials and methods 3.2.1 Plant materials Intact unfolded

    leaves were obtained from tomato plug seedlings grown in the culture room at 230 µmol m-2 s-1 PPF and 16 h d-1 photoperiod provided by white fluorescent lamps (FLR40S EX-N/M-X-36, National Co. Ltd., Japan), 26ʶ2ˆ/ 22ʶ2ˆ air temperature (photo-/ dark period) and 70 ʶ10% relative humidity. For the comparative study, intact leaves were also obtained from mature tomato plants cultivated in the field (Chiba, Japan; July-August 1997). 3.2.2 Measurement of light quality and intensity under the leaves Blue (1188 lamps, peak at 475 nm; Nichea Chemical Co. Ltd., Japan), green (1188 lamps, peak at 535 nm; Nichea Chemical Co. Ltd., Japan) and red (2376 lamps, peak at 650 nm; Hewlett Packard Co. Ltd., Japan) LEDs or the fluorescent lamps (FLR40S EX-N/M-X-36; National Co. Ltd., Japan) were used as light sources. Spectral distributions of light under the intact leaves of tomatoes were investigated with the different qualities of light sources. A photo-sensor (remote-cosine receptor, LI 1800-1; LICOR Inc., USA) of the portable spectroradiometer (LI-1800; LICOR Inc., USA) was fixed on the stand under LED panel. Then, the leaf samples were placed over the photo-sensor, and fixed by white paper with a hole in the middle. From the preliminary observations, the continuous measurements did not cause any significant differences among the measurements, but changes in the measuring points caused significant differences at each time of measurement. Thus, the same samples were used for every light quality.
  30. 27 The spectral photon flux was investigated in wavelength region

    between 330 and 1100 nm. It took about one minute to complete one cycle of measurement by the spectroradiometer and another one minute to prepare the proper light quality by manually adjusting the electric current output of the LEDs. The measurements were conducted at 23ʶ1ˆ air temperature, and 60% relative humidity. The transmittance, an index to determine transmission, was calculated from the ratio of photon flux of light transmitted through the layer of leaf samples to the photon flux reading without any leaf samples. Fluorescence yield was calculated by the summation of photon flux in wavelength region of 700-800 nm divided by the PPF of the incident light. 3.2.3 Experimental design There were two factors, light quality and number of leaves, in the experiment. The factor of light quality included three complementary colors, blue, green and red light, and also their combinations, as used in Chapter 1. The numbers of leaves were one (single) and two (double) leaves.
  31. 28 3.3 Results and discussions 3.3.1 Increases of photon flux

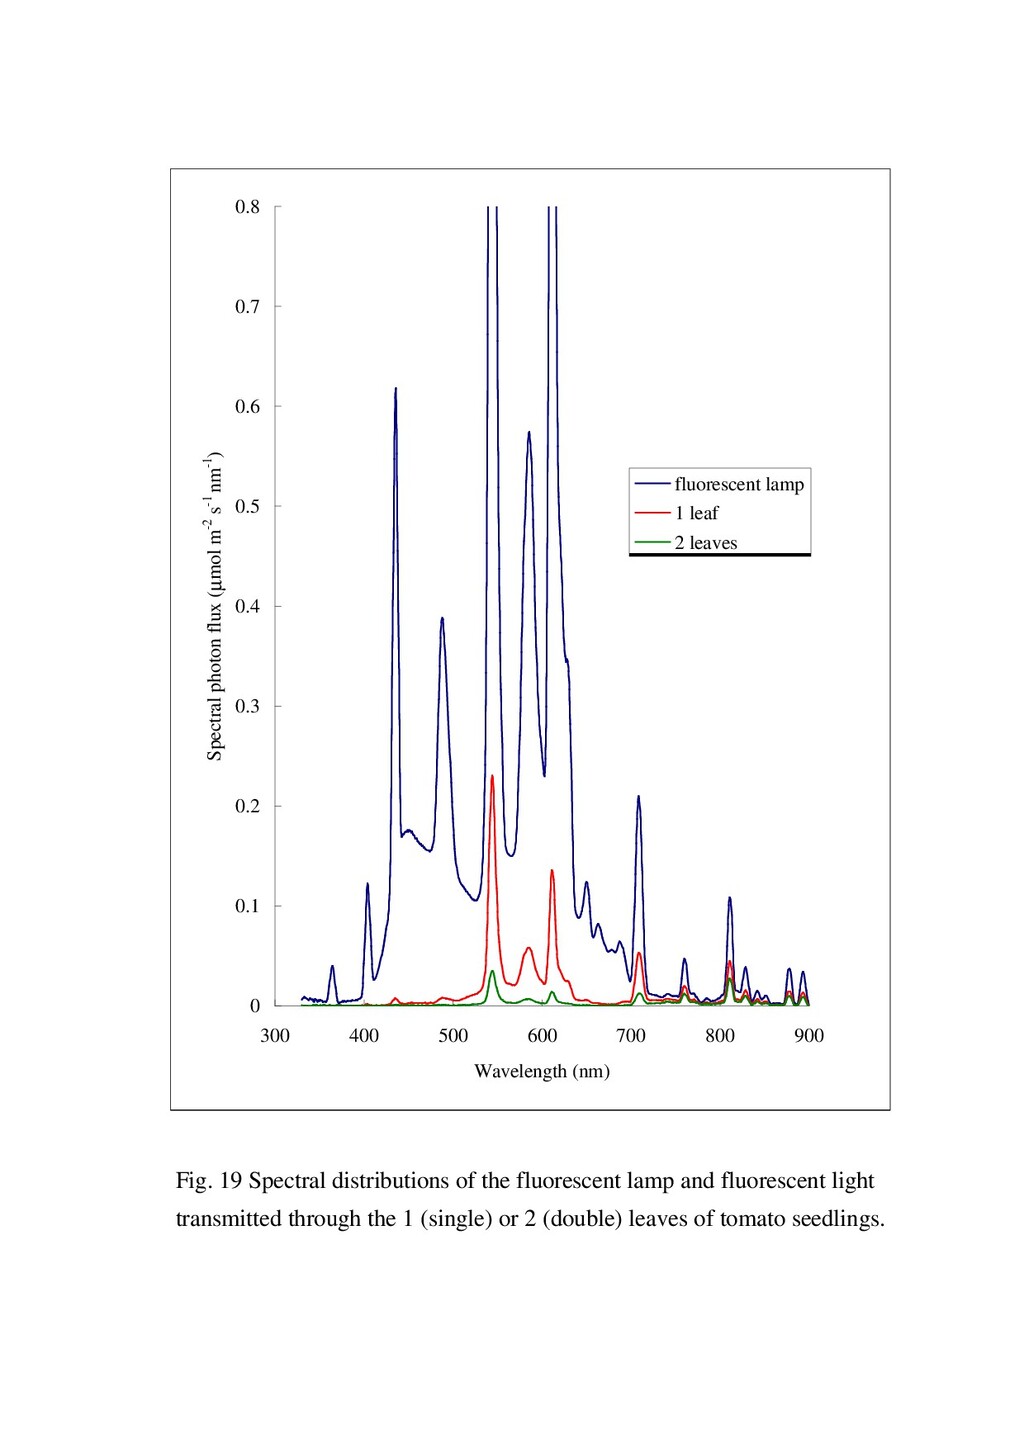
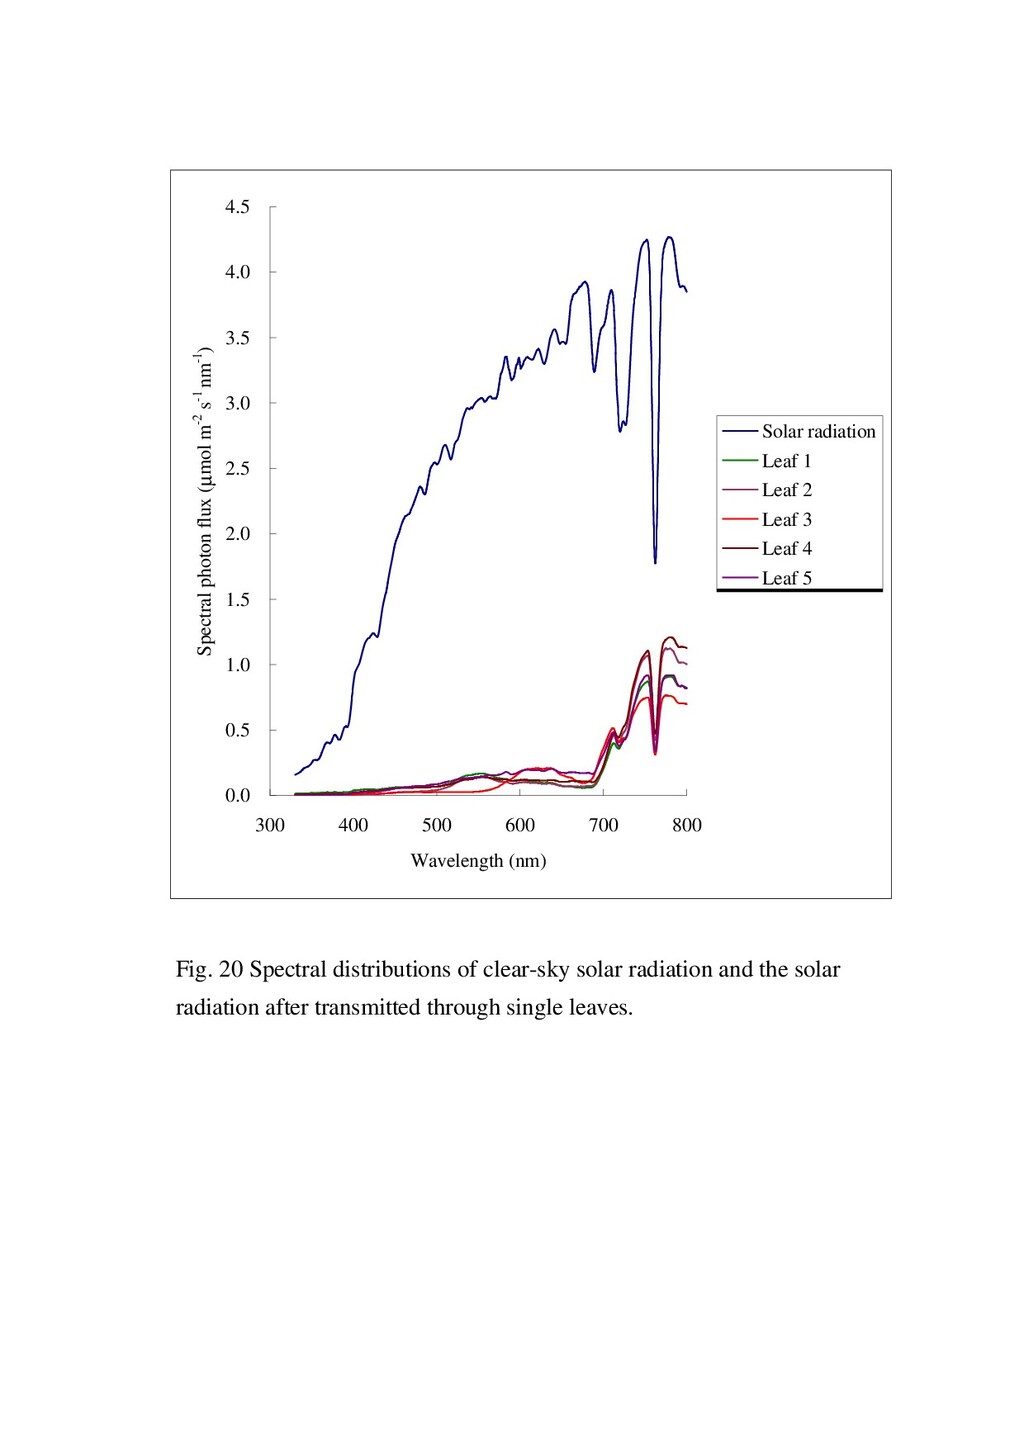
    in FR region The peak, appeared in the spectral distributions of light transmitted through the leaves, could be detected in wavelength region of 700-800 nm, especially by using complementary color LEDs. The spectral distributions of light, measured at the abaxial side of the tomato leaves while the adaxial side was exposed to the light, showing the emission of chlorophyll fluorescence, as shown in Fig. 9, Fig. 10,and Fig. 11. The chlorophyll fluorescence could be also detected in both the leaves of seedlings and those of mature plants. Even though, the peak of emitted fluorescence could not be detected by this measuring method using other kinds of light sources, e.g., fluorescent lamp (Fig. 19) and solar radiation (Fig. 20) which have higher PF in FR region compared with the LEDs.
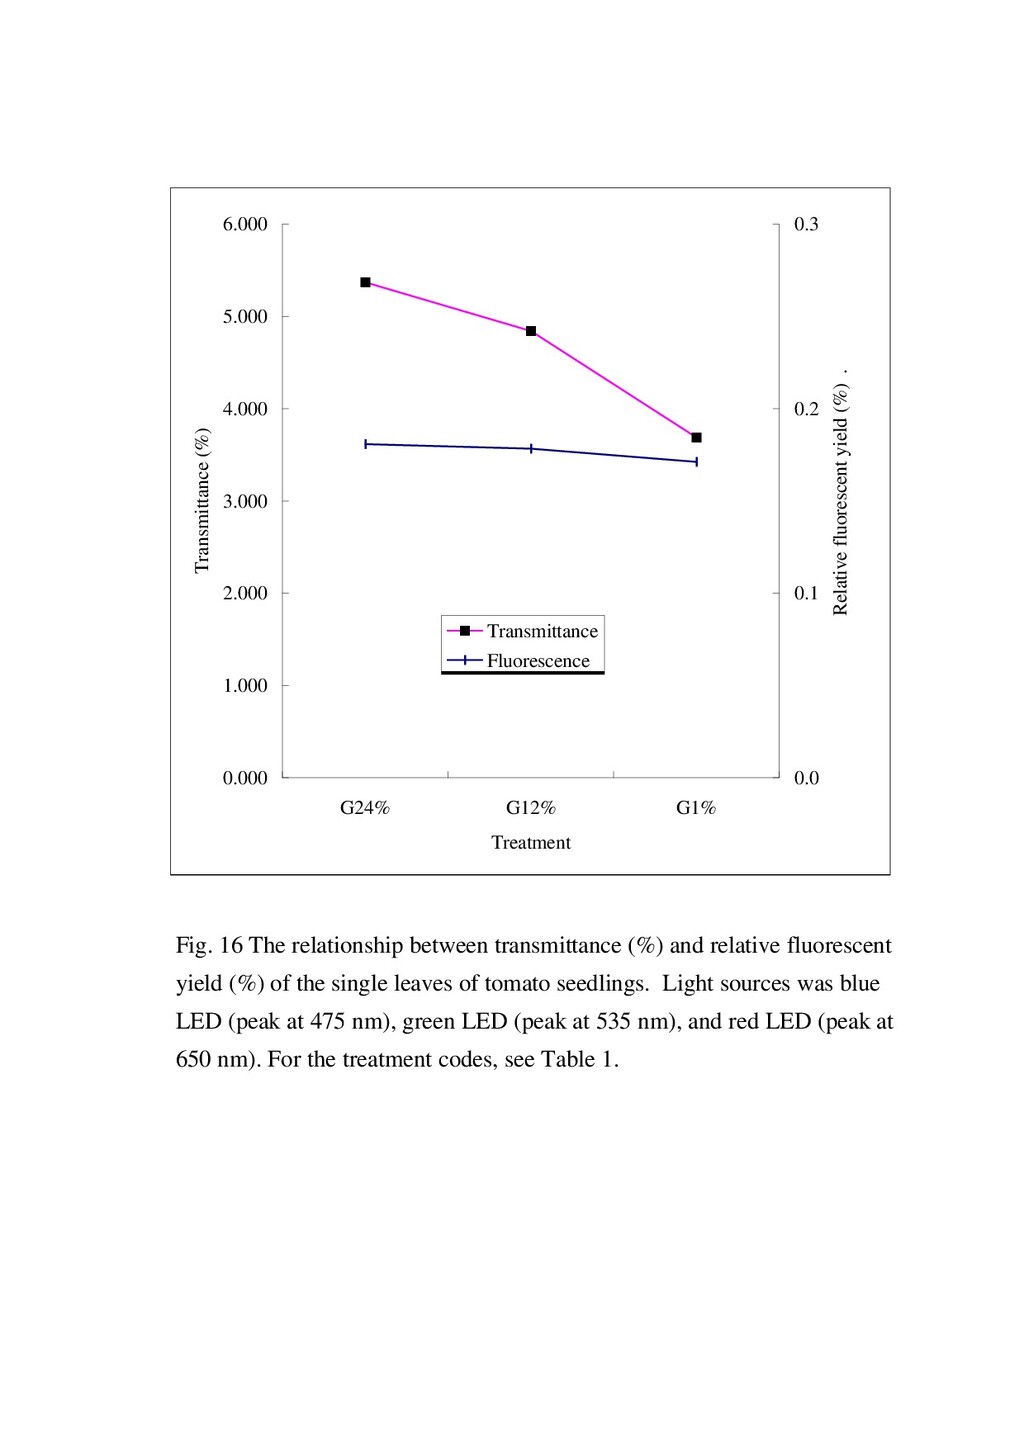
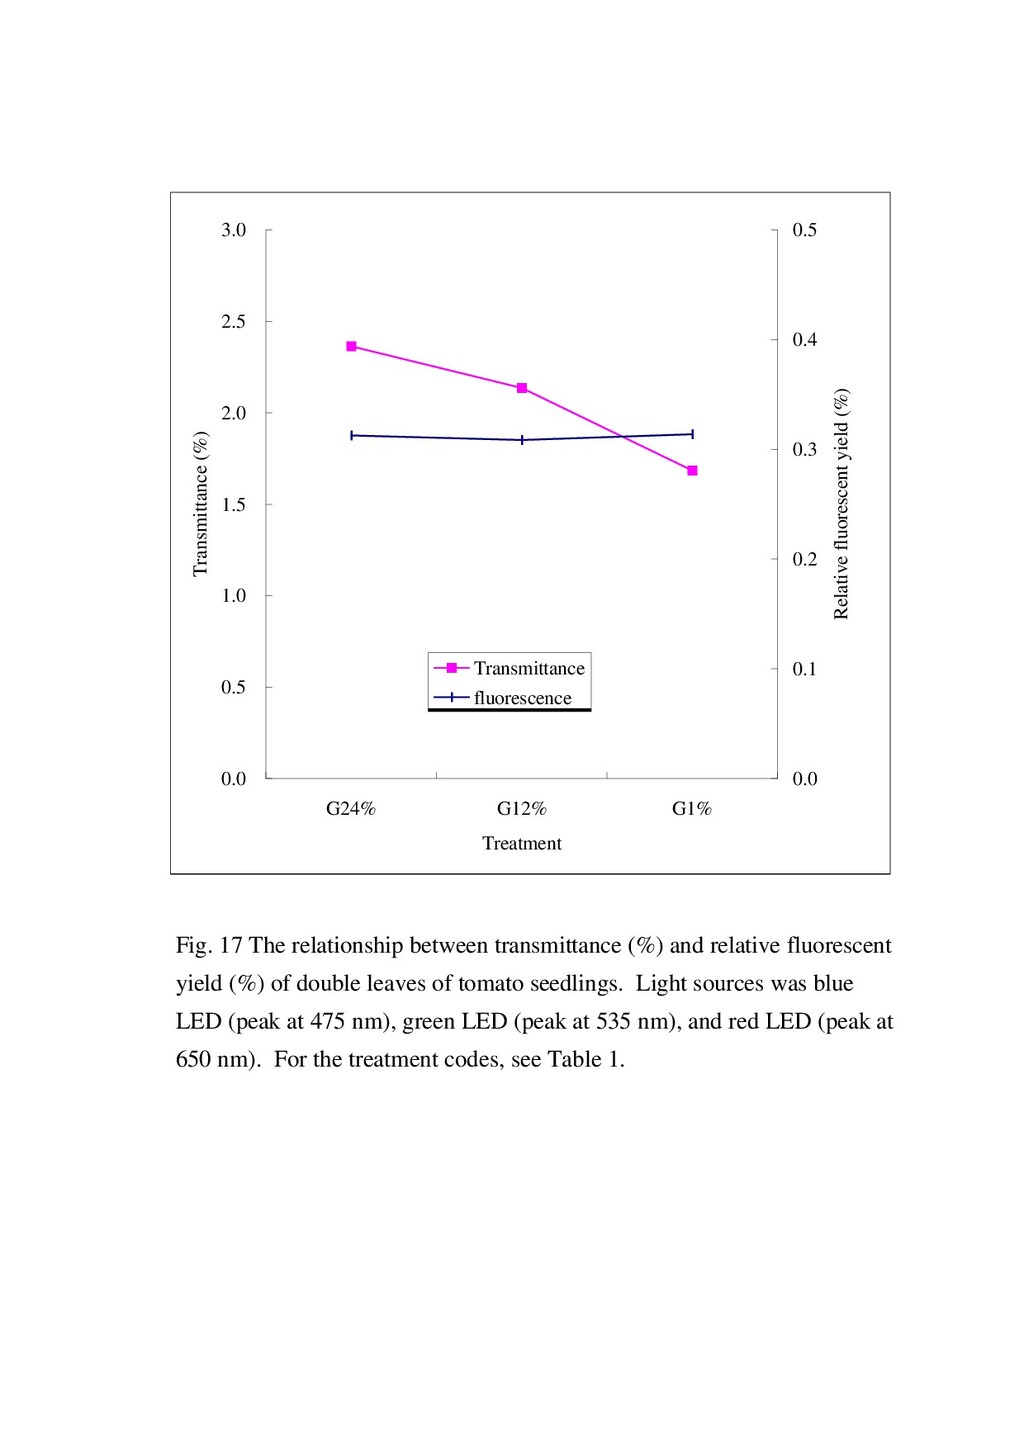
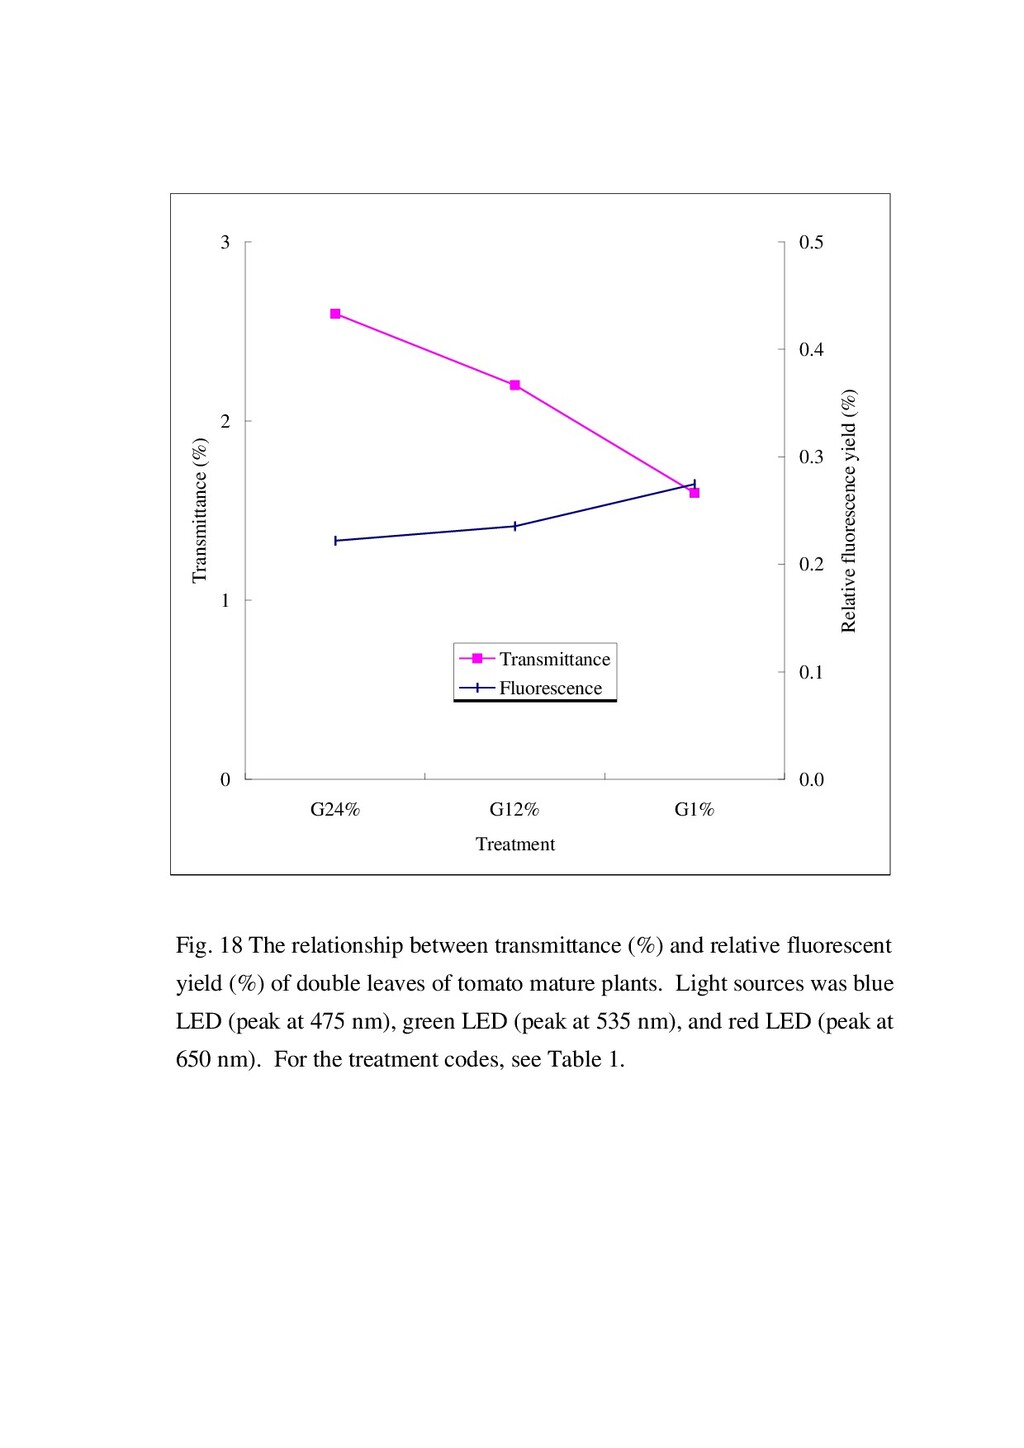
  32. 29 3.3.2 Fluorescence yield related to the transmittance From the

    results of transmittance and the fluorescence yield, as shown in Fig. 16, Fig. 17 and Fig. 18, the light quality which has the larger transmittance resulted in the smaller fluorescence yield. In other words, the amount of photon absorbed by the leaves has closed relation to the emission of the chlorophyll fluorescence. The fluorescence emission was changed with the time, leaf age, position on the leaves, air components, etc. (e.g., Briantais et al, 1986), therefore, the precise measurement for the amount of fluorescence emitted from the leaves in relation to those environment factors is still needed. From the results in Chapter 1, the FR light played roles on stem elongation of seedlings grown under fluorescent light without the increment of dry weight. It might be concluded that not only the FR photon from the light sources but the increased FR ratio from the near-by leaves can also cause the elongation of the seedlings inside the canopy. Moreover, this might be the close relationship between the sun leaves and shading leaves, excluding their responses to the light intensity and light quality. There was a report that the leaf might recognize the shading conditions by detection of FR ratio. Thus, the increasing in FR ratios of light after transmitted through the tomato leaves could be the useful information for the explanation of elongated seedlings or plants inside the high planting density canopies.
  33. 30 3.4 Conclusions The decreased PF ratios of B:FR, G:FR,

    and R:FR are the results from not only the higher transmittance of FR compared with that of the B, G, or R, but also from the emitted FR, which can be detected by using the complementary color LEDs. The quality of incident light influenced the fluorescence yield emitted from the tomato leaves. Under the same light intensity, green light and the light which has higher green ratio induced the least fluorescence yield compared with the blue and red light, respectively. The differences in absorptance of the leaves against the green, blue, and red light might play role in the fluorescence yield. Even though it is notoriously difficult to measure the absolute absorptance of the leaves, while attempts in measurements of the absorptance were done continuously. In the past, research has been conducted on focusing the light intensity and its effects on chlorophyll fluorescence. However, in the present study, the effect of light quality at low light intensity on emission of chlorophyll fluorescence was shown.
  34. 31 General Conclusions In the present study, it can be

    concluded that: (1) Green light was as effective as red light on growth of tomato plug seedlings in term of dry weight. (2) Green light is more evenly absorbed in the vertical orientation compared with red and blue lights, therefore, application of green light can increase the probability of light interception inside the canopy. (3) The photomorphogenesis and the light interception inside the canopy greatly influenced the growth of plug seedlings. (4) The transmission of tomato seedling leaves was dependent upon the quality of light. Transmittance of green light is the higher than those of blue and red light, respectively. Also the light with higher percent green photon flux can effectively penetrate the more leaf layers. (5) The emitting far-red (FR) light could be detected at the abaxial side of the tomato leaves when the adaxial side was exposed to the light. The yield of emitting FR light was increasing with the decreasing transmittance. (6) The photomorphogenesis and photosynthesis play important roles in the growth of plants with their close relationship. The photomorphogenesis, like leaf expansion and stem elongation, might due to the enhancement of photosynthesis. Also, the enhancement of photosynthesis by increasing the photon flux incident on the leaves resulted in the reduction of elongation, such as increasing of green light PF, side-ward lighting system.
  35. 32 References Amesz J., 1996, Development of classical optical spectroscopy,

    In Amesz, J., and Hoff, A.J. (eds.), Biophysical techniques in photosynthesis, Kluwer Academic Publishers, The Netherlands, 3-10. Amesz, J., Duysens, L.N.M., and Brandt, D.C., 1961, Methods for measuring and correcting the absorption spectrum of scattering suspensions. J. Theor. Biol., 1, 59-74. Bickford, E.D., and Dunn, S., 1972, Lighting for plant growth, The Kent State University Press, USA, 221 p. Bolhàr-Nordenkampf, H.R. and Öquist, G., 1993, Chlorophyll fluorescence as a tool in photosynthetic research, In Hall, D.O. (eds.), Photosynthesis and production in a changing environment: a field and laboratory manual. Chapman & Hall, London, England, 79-90. Bula, R.J., Morrow, R.C., Tibbitts, T.W., Ignatius, R.W., Martin, T.S. and Barta, D.J., 1991, Light emitting diodes as a radiation source for plants, HortScience, 26, 203-205. Bula, R.J., Tennessen, D.J., Morrow, R.C. and Tibbitts, T.W., 1994, Light emitting diodes a plant lighting source, In Proceeding international lighting in controlled environments workshop, University of Wisconsin-Medison, WI, USA, 255-267. Coombe, D.E., 1957, The spectral distribution of shade light in wood lands, J. Ecol., 45, 823-830. Decoteau, D.R. and Friend, H.H., 1991, Phytochrome-regulated growth of young watermelon plants, J. Amer. Soc. Hort. Sci., 116 (3), 512-515.
  36. 33 Downs, R.J., Hendricks, S.B., and Borthwick, H.A., 1957, Photoreversible

    Flu. of elongation of pinto beans and other plants under normal conditions of growth, Bot. Gaz., 125, 199-208. Duncan, W.G. (1971, Leaf angle, leaf area, and canopy photosynthesis, Crop Sci., 11, 482-485. Duysens, L.N.M., 1952, Transfer of excitation energy in photosynthesis, Doctoral Thesis, University of Utrecht. Duysens, L.N.M., 1956, The flattening of the absorption spectrum of suspensions, as compared to that of solutions, Biochem. Biophys. Acta, 19, 1-12. Duysens, L.N.M., 1957, Methods for measurement and analysis of changes in light absorption occurring upon illumination of photosynthesis organisms, In Graffran, H. (ed.) Research in Photosynthesis, Interscience Publishers, New York, 59-61. Federer, C.A. and Tanner, C.G., 1966, Spectral distribution of light in the forest, Ecology, 47, 555-560. Fukuda, N, Ikeda, H. and Nara, M., 1993, Effects of light quality on the growth of lettuce and spinach cultured by hydroponics under controlled environment, J. Soc. Agri. Struc. Jap. 24(2), 23-30. Gallagher, J.N. and Biscoe, P.V., 1978, Radiation absorption, growth and yield of cereals, J. Agri. Sci., 91, 47-60. Gate, D.M., Keegan, H.J., Schleter, J.C., Weidner, V.R., 1965, Spectral properties of plants, Applied Optics, 4, 11-20. Goodfellow, S., Barkham, J.P., 1974, Spectral transmission curves for a beech (Fagus sylvatica L.) canopy. Acta Bot. Neerl., 23, 225-230. Grant, R.H., 1997, Partitioning of biologically active radiation in plant
  37. 34 canopies, Int. J. Biometeorol., 40, 26-40. Hart, J.W., 1988,

    Light and plant growth, Unwin Hyman Ltd., London, England, 203 p. Holmes, M.G. and Smith, H., 1977, The function of phytochrome in natural environment. II. The influence of vegetation canopies on the spectral energy distribution of natural daylight, Phytochem. Photobiol., 25, 539-545. Jackson, J.E., 1980. Light interception and utilization by orchard systems, Hort. Rev., 2, 208-267. Kinerson, R.S., 1973, Fluxes of visible and net radiation within a forest canopy, J. Appl. Ecol., 10, 657-660. Klein, R.M., 1992, Effects of green light on biological systems, Biol. Rev., 67, 199-284. Kozai, T., Nguyen-Thi-Quynh and Kubota, C., 1997, Environmental Flu. and its effects in plug plant production under artificial light, J. Kor. Soc. Hort. Sci., 38(2), 194-199. Krause, G.H. and Weis, E., 1988, The photosynthetic apparatus and chlorophyll fluorescence; An introduction. In Lichtenthaler, H.K. (ed.), Applications of chlorophyll fluorescence in photosynthesis research, stress physiology, hydrobiology and remote sensing. Kluwer Academic Publisher, The Netherlands. pp. 3-31. Latimer, P. and Eubanks, C.A.H, 1962, Absorption spectrophotometry of turbid suspensions: a method for correcting for large systemmatic distortions, Arch. Biochem. Biophys., 98, 274-285. Latimer, P., 1959, Influence of selective light scattering on measurement of absorption spectra of Chlorella, Plant Physiol, 34, 193-199.
  38. 35 Lavorel, J., Brejon, J. and Lutz, M., 1986, Methodological

    principles of measurement of light emitted by photosynthetic system. In Govindjee, Amesz, J., and Fork, D.C. (eds.), Light emission by plant and bacteria, Academic Press, Orlando, 57-98. McCree, K.J., 1971, Significance of enhancement for calculations based on the action spectrum for photosynthesis, Plant Physio., 48, 704-706. McCree, K.J., 1972, The action spectrum, absorptance and quantum yield of photosynthesis in crop plants, Agri. Meteo., 9, 191-216. McNellis, T.W. and Deng, X.W., 1995, Light Flu. of seedling morphogenetic pattern, The plant cell, 7, 1749-1761. Miyashita, Y., Kimura, T., Kitaya, Y., and Kozai, T., 1995, Effects of red and far-red light on the growth and morphology of potato plantlets in vitro: using light emitting diode as a light source for micropropagation, Acta Hortic., 393, 189-194. Mohr, H. and Shropshire, W.Jr., 1983, An introduction to photomorphogenesis for the general reader, In Shropshire, W. and Mohr, H. (eds.) Encyclopedia of plant physiology. V16A, Universitätsdruckerei H. Stürtz AG, Würzberg, German. 456 p. Nobel, P.S., Forseth, I.N. and Long, S.P., 1993, Canopy structure and light interception. In Hall, D.O. (eds.), Photosynthesis and production in a changing environment: a field and laboratory manual, Chapman & Hall, London, England, 79-90. Norman, J.M., 1980, Interfacing leaf and canopy light interception models, In Hesketh, J.D. and Jones, J.W. (eds.), Predicting photosynthesis for ecosystem models, V2, CRC Press, Boca Raton, Florida, 49-67. Papadopoulos, A.P. and Ormrod, D.P., 1988. Plant spacing effects on
  39. 36 photosynthesis and transpiration of the greenhouse tomato, Can. J.

    Plant Sci., 68, 1209-1218. Papadopoulos, A.P. and Pararajasingham, S., 1997, The influence of plant spacing on light interception and use in greenhouse tomato (Lycopersicon esculentum Mill.): A review, Sci. Horticulturae, 69, 1-29. Robertson, G.W., 1966, The light composition of solar and sky spectra available to plants, Ecology, 47, 640-643. Russell, G., Jarvis, P.G., and Monteith, J.L., 1989, Absorption of radiation by canopies and stand growth, In Russell, G. et al, Plant canopies: their growth, form and function, Cambridge University Press, Cambridge, England, 21-39. Shibles, R.M. and Weber, C.R., 1965, Leaf area, solar radiation and dry matter production by soybeans, crop Sci., 5, 575-577. Steinitz, B., Ren, Z., and Poff, K.L., 1985, Blue and green light-induced phototropism in Arabidopsis thaliana and Lactuca sativa L. seedlings, Plant Physiol., 77, 248-251. Styer, R.C. and Koranski, D.S., 1996, Plug & transplant production; a grower guide, Ball Publishing, Illinois, USA, 374 p. Tasker, R. and Smith, H., 1977, The function of phytochrome in the natural environment. V. Seasonal changes in the radiant energy quality in woodlands, Phytochem. Photobiol., 26, 487-491. Turnbull M.H. and Yates, D.J. (1993) Seasonal variation in the red/far-red ratio and photon flux density in an Australian sub-tropical rainforest, Agric. Forest Meteorol, 111-127
  40. 37 Table 1 Photon flux (PF; µmol m-2 s-1)* composition

    in each treatment Wavelength region (nm) 400-500 500-600 600-700 400-700 700-800 Treatment Blue PF Green PF Red PF PPF** Far-red PF Fluorescent light G24% G12% G1% 55 55 55 55 101 55 29 3 74 120 146 172 230 230 230 230 8.0 0.3 0.4 0.5 *, ** Photon flux or photosynthetic photon flux (PPF; µmol m-2 s-1) at the top of canopy level. Table 2 Relative photon flux (% of PPF) and red/far-red ratio in each treatment Treatment Blue* Green* Red* Far-red* R/FR Fluorescent light 24.0 44.0 32.0 3.48 10.81 G24% 24.0 24.0 52.0 0.13 0.25 G12% 24.0 12.5 63.5 0.17 0.27 G1% 24.0 1.0 75.0 0.22 0.29 * The relative photon fluxes were basis on PPF.
  41. 38 Table 3 Effects of percent green photon flux on

    fresh weight, dry weight, stem length and shoot dry weight per stem length ratio of tomato plug seedlings on day 15 after sowing Treatment Total FW Total DW Stem L Shoot DW/stem L (g) (mg) (mm) (g m-1) Flu. 1 x 0.85ʶ0.05z 62.5ʶ5.2 93ʶ3.5 6.2ʶ0.52 G24% 0.83ʶ0.08 65.9ʶ6.8 82ʶ3.4 7.3ʶ0.69 t-test NS y NS ** ** Flu. 2 w 1.17ʶ0.04 68.8ʶ4.9 117ʶ1.4 5.5ʶ0.40 G12% 1.27ʶ0.05 72.3ʶ6.5 108ʶ4.3 6.4ʶ0.67 t-test ** NS ** * Flu. 3 v 0.85ʶ0.05 60.2ʶ6.2 88ʶ1.9 6.2ʶ0.69 G1% 1.00ʶ0.05 69.4ʶ5.3 87ʶ2.3 7.3ʶ0.58 t-test ** * NS * z: Meanʶstandard deviation (n=8) y: NS, *, **, Non-significant or significant difference at P = 0.05, 0.01 respectively x, w, v: The Flu. treatments conducted during the same time with G24%, G12%, or G1%, respectively
  42. 39 Table 3 (cont.) Effects of percent green photon flux

    on epi-/hypocotyl length ratio and root of tomato plug seedlings on day 15 after sowing Treatment Epi-/hypocotyl L Root FW Root DW Root L ratio (g) (mg) (mm) Flu. 1 x 0.80ʶ0.05z 101ʶ0.01 5.8ʶ0.8 78ʶ7 G24% 0.79ʶ0.08 103ʶ0.02 6.1ʶ1.0 75ʶ6 t-test NS y NS NS NS Flu. 2 w 0.84ʶ0.06 89ʶ0.02 3.8ʶ0.5 64ʶ14 G12% 0.79ʶ0.06 90ʶ0.02 4.4ʶ0.9 58ʶ7 t-test NS NS * NS Flu. 3 v 0.66ʶ0.03 102ʶ0.01 4.9ʶ0.8 70ʶ14 G1% 0.72ʶ0.07 113ʶ0.02 5.6ʶ0.7 66ʶ6 t-test NS * NS NS z: Meanʶstandard deviation (n=8) y: NS, *, **, Non-significant or significant difference at P = 0.05, 0.01 respectively x, w, v: The Flu. treatments conducted during the same time with G24%, G12%, or G1%, respectively
  43. 40 Table 3 (cont.) Effects of percent green photon flux

    on cotyledons and leaves of tomato plug seedlings on day 15 after sowing Treatment Cotyledon DW Cotyledon area Leaf DW Leaf area (mg) (cm2) (mg) (cm2) Flu. 1 x 10.3ʶ1.7z 4.3ʶ0.5 28.4ʶ2.3 17.0ʶ1.1 G24% 10.9ʶ1.7 4.2ʶ0.5 32.0ʶ3.2 16.9ʶ0.9 t-test NS y NS ** NS Flu. 2 w 10.5ʶ1.0 5.5ʶ0.3 32.9ʶ2.9 23.5ʶ1.4 G12% 10.5ʶ1.3 5.4ʶ0.4 33.1ʶ3.2 23.0ʶ1.4 t-test NS NS NS NS Flu. 3 v 10.0ʶ1.5 4.6ʶ0.5 27.0ʶ2.3 16.4ʶ0.6 G1% 11.7ʶ1.5 5.3ʶ0.3 31.9ʶ2.4 18.6ʶ0.8 t-test NS ** ** ** z: Meanʶstandard deviation (n=8) y: NS, **, Non-significant or significant difference at P = 0.01 respectively x, w, v: The Flu. treatments conducted during the same time with G24%, G12%, or G1%, respectively
  44. 41 Table 4 Relative growth of tomato plug seedlings on

    day 15 after sowing Treatment Total FW Total DW Stem L G24% 97.9ʶ7.1 z 105.7ʶ 9.7 88.5ʶ5.8 G12% 109.2ʶ2.1 105.3ʶ 9.3 92.3ʶ3.7 G1% 117.0ʶ9.9 116.4ʶ15.2 98.9ʶ3.1 LSDP = 0.05 7.4 13.0 12.9 z: Meanʶstandard deviation (n=8) Table 4 (cont.) Relative growth of tomato plug seedlings on day 15 after sowing Treatment Cotyledon area Leaf area G24% 100.3ʶ12.5 z 100.5ʶ5.5 G12% 99.0ʶ 9.5 98.5ʶ9.7 G1% 116.6ʶ15.4 113.4ʶ7.6 LSDP = 0.05 14.1 13.0 z: Meanʶstandard deviation (n=8)
  45. 42 Table 5 Specific growth of tomato plug seedlings on

    day 15 after sowing Treatment Total FW Total DW Stem L Leaf DW (/100) (/100) (/100) (/100) G24% ʵ2.1ʶ6.7 z 5.7ʶ 9.7 ʵ12.5ʶ6.2 4.5ʶ3.2 G12% 9.2ʶ2.0 5.3ʶ 9.3 ʵ6.6ʶ3.1 0.4ʶ3.4 G1% 16.9ʶ9.2 16.4ʶ15.2 ʵ1.3ʶ3.6 7.0ʶ4.5 LSDP = 0.05 7.4 13.0 12.9 5.0 z: Meanʶstandard deviation (n=8) Table 5 (cont.) Specific growth of tomato plug seedlings on day 15 after sowing Treatment Total FW Total DW Stem L Leaf DW (/100) (/100) (/100) (/100) G24% ʵ2.1ʶ6.7 z 5.7ʶ 9.7 ʵ12.5ʶ6.2 4.5ʶ3.2 G12% 9.2ʶ2.0 5.3ʶ 9.3 ʵ6.6ʶ3.1 0.4ʶ3.4 G1% 16.9ʶ9.2 16.4ʶ15.2 ʵ1.3ʶ3.6 7.0ʶ4.5 LSDP = 0.05 7.4 13.0 12.9 5.0 z: Meanʶstandard deviation (n=8)
  46. 43 Table 6 Transmittance (%) of tomato leaves in each

    wavelength region Seedlings Mature plants Wavelength region First z Second y Double x First Second 400-500 nm 2.4 53 1.3 0.5 -0- w 500-600 nm 10.0 42 4.2 6.0 -0- 600-700 nm 4.0 49 2.1 2.0 -0- z,y,x First or second single leaves from the light source or double leaves w Too small data considered by the sensitivity of the photo-sensor Table 7 PPF transmittance (%) under tomato leaves Seedlings Mature plants Light quality First z Second y Double x First Second Blue 2.4 53 1.3 0.5 -0- w Green 10.0 42 4.2 6.0 -0- Red 4.0 49 2.1 2.0 -0- G24% 5.4 44 2.4 2.6 -0- G12% 4.8 44 2.1 2.3 -0- G1% 3.7 46 1.7 2.0 -0- z,y,x First or second single leaves from the light source or double leaves w Too small data considered by the sensitivity of the photo-sensor
  47. Fig. 1 Spectral distributions in relative photon flux of blue

    LED (peak at 475 nm), green LED (peak at 535 nm), red LED (peak at 650 nm) and fluorescent lamp used in the present study. Partable spectroradiometer LI-1800, LI-COR Inc., USA) was used for the measurements. 0.0 0.1 0.2 0.3 0.4 0.5 0.6 0.7 0.8 0.9 1.0 300 400 500 600 700 800 900 Wavelength (nm) Relative photon flux blue LED green LED red LED fluorescent lamp
  48. Fig. 2 Photon flux composition of light in each treatment.

    For treatment codes, see Table 1 0 50 100 150 200 250 G1% G12% G24% Fluorescent light Treatment PPF (µmol m-2 s-1) 400-500 nm 500-600 nm 600-700 nm 700-800 nm
  49. Fig. 3 Transmittance (%) of the complementary light upon the

    leaves of tomato seedlings. The light sources were green LED (peak at 535 nm), blue LED (peak at 475 nm), and red LED (peak at 650 nm). Blue, green and red regions were the wavelength regions of 400-500 nm, 500-600 nm, 600-700 nm, respectively. 0 2 4 6 8 10 12 0 1 2 Number of leaf layer over the photo-sensor Transmittance (%) Blue Green Red
  50. Fig. 4 Transmittance (%) of the complementary light upon the

    leaves of mature tomato plants. The light sources and wavelength regions of light are mentioned in Fig. 3. 0.00 1.00 2.00 3.00 4.00 5.00 6.00 7.00 0 1 2 Number of leaf layer over the photo-sensor Transmittance (%) Blue Green Red
  51. Fig. 5 Changes in photon flux ratio of the green,

    blue and red light transmitted through the single leaves of tomato seedlings. Number of leaf layer over the photo-sensor varied for 0, 1 or 2 layers. 0 0.2 0.4 0.6 0.8 1 1.2 2 1 0 Number of leaf layer Photon flux ratio 400-500 nm 500-600 nm 600-700 nm 700-800 nm Green light 0 0.2 0.4 0.6 0.8 1 1.2 2 1 0 Number of leaf layer Photon flux ratio 400-500 nm 500-600 nm 600-700 nm 700-800 nm Blue light 0 0.2 0.4 0.6 0.8 1 1.2 2 1 0 Number of leaf layer Photon flux ratio 400-500 nm 500-600 nm 600-700 nm 700-800 nm Red light
  52. Fig. 6 Changes in photon flux ratio of the green,

    blue and red light transmitted through the single leaves of tomato mature plants. Number of leaf layer over the photo-sensor varied for 0, 1 or 2 layers. 0 0.5 1 1.5 2 1 0 Number of leaf layer Photon flux ratio 400-500 nm 500-600 nm 600-700 nm 700-800 nm Green light 0 0.5 1 1.5 2 1 0 Number of leaf layer Photon flux ratio 400-500 nm 500-600 nm 600-700 nm 700-800 nm Blue light 0 0.5 1 1.5 2 1 0 Number of leaf layer Photon flux ratio 400-500 nm 500-600 nm 600-700 nm 700-800 nm Red light
  53. Fig. 7 Changes in photon flux ratio of the G24%,

    G12% and G1% light transmitted through the single leaves of tomato seedlings. Number of leaf layer over the photo-sensor varied for 0, 1 or 2 layers. For the treatment codes, see Table 1. 0 0.2 0.4 0.6 0.8 1 2 1 0 Number of leaf layer Photon flux ratio 400-500 nm 500-600 nm 600-700 nm 700-800 nm G24% 0 0.2 0.4 0.6 0.8 1 2 1 0 Number of leaf layer Photon flux ratio 400-500 nm 500-600 nm 600-700 nm 700-800 nm G12% 0 0.2 0.4 0.6 0.8 1 2 1 0 Number of leaf layer Photon flux ratio 400-500 nm 500-600 nm 600-700 nm 700-800 nm G1%
  54. Fig. 8 Changes in photon flux ratio of the G24%,

    G12% and G1% light transmitted through the single leaves of tomato mature plants. Number of leaf layer over the photo-sensor varied for 0, 1 or 2 layers. For the treatment codes, see Table 1. 0 0.5 1 1.5 2 1 0 Number of leaf layer Photon flux ratio 400-500 nm 500-600 nm 600-700 nm 700-800 nm G24% 0 0.5 1 1.5 2 1 0 Number of leaf layer Photon flux ratio 400-500 nm 500-600 nm 600-700 nm 700-800 nm G12% 0 0.5 1 1.5 2 1 0 Number of leaf layer Photon flux ratio 400-500 nm 500-600 nm 600-700 nm 700-800 nm G1%
  55. Fig. 9 Spectral distributions of blue light transmitted through (1)

    single leaves and (2) double leaves of tomato seedlings and tomato mature plants. Light source was blue LED (peak at 475 nm). 0.00 0.01 0.02 0.03 0.04 0.05 300 400 500 600 700 800 900 Wavelength (nm) Spectral photon flux (µmol m-2 s-1 nm-1) Blue Seedling 1 leaf Seedling 2 leaves Plant 1 leaf Plant 2 leaves 0.0 0.5 1.0 1.5 2.0 2.5 300 400 500 600 700 800 900 Wavelength (nm) Spectral photon flux (µmol m-2 s-1 nm-1) Blue Seedling 1 leaf Seedling 2 leaves Plant 1 leaf Plant 2 leaves
  56. Fig. 10 Spectral distributions of green light transmitted through (1)

    single leaves and (2) double leaves of tomato seedlings and tomato mature plants. Light source was green LED (peak at 535 nm). 0.0 0.2 0.4 0.6 0.8 1.0 1.2 1.4 300 400 500 600 700 800 900 Wavelength (nm) Spectral photon flux (µmol m-2 s-1 nm-1) Green Seedling 1 leaf Seedling 2 leaves Plant 1 leaf Plant 2 leaves 0.00 0.02 0.04 0.06 0.08 0.10 0.12 0.14 300 400 500 600 700 800 900 Wavelength (nm) Spectral photon flux (µmol m-2 s-1 nm-1) Green Seedling 1 leaf Seedling 2 leaves Plant 1 leaf Plant 2 leaves
  57. Fig. 11 Spectral distributions of red light transmitted through (1)

    single leaves and (2) double leaves of tomato seedlings and tomato mature plants. Light source was red LED (peak at 650 nm). 0.0 0.5 1.0 1.5 2.0 2.5 3.0 3.5 4.0 300 400 500 600 700 800 900 Wavelength (nm) Spectral photon flux (µmol m-2 s-1 nm-1) Red Seedling 1 leaf Seedling 2 leaves Plant 1 leaf Plant 2 leaves 0.00 0.02 0.04 0.06 0.08 0.10 0.12 0.14 300 400 500 600 700 800 900 Wavelength (nm) Spectral photon flux (µmol m-2 s-1 nm-1) Red Seedling 1 leaf Seedling 2 leaves Plant 1 leaf Plant 2 leaves
  58. Fig. 12 Spectral distributions of G24% light transmitted through (1)

    single leaves and (2) double leaves of tomato seedlings and tomato mature plants. Light source was blue LED (peak at 475 nm), green LED (peak at 535 nm), and red LED (peak at 650 nm). 0.0 0.5 1.0 1.5 2.0 2.5 3.0 300 400 500 600 700 800 900 Wavelength (nm) Spectral photon flux (µmol m-2 s-1 nm-1) G24% Seedling 1 leaf Seedling 2 leaves Plant 1 leaf Plant 2 leaves 0.00 0.02 0.04 0.06 0.08 0.10 0.12 0.14 300 400 500 600 700 800 900 Wavelength (nm) Spectral photon flux (µmol m-2 s-1 nm-1) G24% Seedling 1 leaf Seedling 2 leaves Plant 1 leaf Plant 2 leaves
  59. Fig. 13 Spectral distributions of G12% light transmitted through (1)

    single leaves and (2) double leaves of tomato seedlings and tomato mature plants. Light source was blue LED (peak at 475 nm), green LED (peak at 535 nm), and red LED (peak at 650 nm). 0.0 0.5 1.0 1.5 2.0 2.5 3.0 3.5 4.0 300 400 500 600 700 800 900 Wavelenth (nm) Spectral photon flux (µmol m-2 s-1 nm-1) G12% Seedling 1 leaf Seedling 2 leaves Plant 1 leaf Plant 2 leaves 0.00 0.02 0.04 0.06 0.08 0.10 0.12 0.14 300 400 500 600 700 800 900 Wavelenth (nm) Spectral photon flux (µmol m-2 s-1 nm-1) G12% Seedling 1 leaf Seedling 2 leaves Plant 1 leaf Plant 2 leaves
  60. Fig. 14 Spectral distributions of G1% light transmitted through (1)

    single leaves and (2) double leaves of tomato seedlings and tomato mature plants. Light source was blue LED (peak at 475 nm), green LED (peak at 535 nm), and red LED (peak at 650 nm). 0.0 0.5 1.0 1.5 2.0 2.5 3.0 3.5 4.0 4.5 0 200 400 600 800 1000 Wavelength (nm) Spectral photon flux (µmol m-2 s-1 nm-1) G1% Seedling 1 leaf Seedling 2 leaves Plant 2 leaf Plant 2 leaves 0.00 0.02 0.04 0.06 0.08 0.10 0.12 0.14 0.16 300 400 500 600 700 800 900 Wavelength (nm) Spectral photon flux (µmol m-2 s-1) G1% Seedling 1 leaf Seedling 2 leaves Plant 2 leaf Plant 2 leaves
  61. 0.000 0.002 0.004 0.006 0.008 0.010 400 500 600 700

    800 Wavelength (nm) Spectral photon flux (µmol m-2 s-1 nm-1) 0 0.5 1 400 500 600 700 800 Wavelength (nm) Relative photon flux BF BFL BFD 0.00 0.01 0.02 0.03 0.04 400 500 600 700 800 Wavelength (nm) Spectral photon flux (µmol m-2 s-1 nm-1) 0 0.5 1 400 500 600 700 800 Wavelength (nm) Relative photon flux BN BNL BND
  62. 59 Fig. 15 The shoulder of peak detected in the

    spectral distribution of blue LED after transmitted through the sweetpotato leaves. Light source used in the upper figures was blue LED without any filters. Light source used in the lower figures was blue LED after filtered by the blue filter (Hoya Co. Ltd., Japan). The smaller figures show spectral distributions in relative photon flux. The bigger figured show spectral distribution in spectral photon flux. BN and BF indicate spectral distributions of incident light without and with blue filters, respectively. L indicates incident leaves and D indicates dehydrated leaves.
  63. Fig. 16 The relationship between transmittance (%) and relative fluorescent

    yield (%) of the single leaves of tomato seedlings. Light sources was blue LED (peak at 475 nm), green LED (peak at 535 nm), and red LED (peak at 650 nm). For the treatment codes, see Table 1. 0.000 1.000 2.000 3.000 4.000 5.000 6.000 G24% G12% G1% Treatment Transmittance (%) 0.0 0.1 0.2 0.3 Relative fluorescent yield (%) . Transmittance Fluorescence
  64. Fig. 17 The relationship between transmittance (%) and relative fluorescent

    yield (%) of double leaves of tomato seedlings. Light sources was blue LED (peak at 475 nm), green LED (peak at 535 nm), and red LED (peak at 650 nm). For the treatment codes, see Table 1. 0.0 0.5 1.0 1.5 2.0 2.5 3.0 G24% G12% G1% Treatment Transmittance (%) 0.0 0.1 0.2 0.3 0.4 0.5 Relative fluorescent yield (%) Transmittance fluorescence
  65. Fig. 18 The relationship between transmittance (%) and relative fluorescent

    yield (%) of double leaves of tomato mature plants. Light sources was blue LED (peak at 475 nm), green LED (peak at 535 nm), and red LED (peak at 650 nm). For the treatment codes, see Table 1. 0 1 2 3 G24% G12% G1% Treatment Transmittance (%) 0.0 0.1 0.2 0.3 0.4 0.5 Relative fluorescence yield (%) Transmittance Fluorescence
  66. Fig. 19 Spectral distributions of the fluorescent lamp and fluorescent

    light transmitted through the 1 (single) or 2 (double) leaves of tomato seedlings. 0 0.1 0.2 0.3 0.4 0.5 0.6 0.7 0.8 300 400 500 600 700 800 900 Wavelength (nm) Spectral photon flux (µmol m-2 s-1 nm-1) fluorescent lamp 1 leaf 2 leaves
  67. Fig. 20 Spectral distributions of clear-sky solar radiation and the

    solar radiation after transmitted through single leaves. 0.0 0.5 1.0 1.5 2.0 2.5 3.0 3.5 4.0 4.5 300 400 500 600 700 800 Wavelength (nm) Spectral photon flux (µmol m-2 s-1 nm-1) Solar radiation Leaf 1 Leaf 2 Leaf 3 Leaf 4 Leaf 5
  68. 65 Appendix 2 Seedlings grown under G24% on day 15

    after sowing compared with the seedlings grown under fluorescent light on day 15 after sowing. Environmental condition for both were the same.
  69. 66 Appendix 3 Seedlings grown under G12% on day 15

    after sowing compared with the seedlings grown under fluorescent light on day 15 after sowing. Environmental conditions for both were the same.
  70. 67 Appendix 4 Seedlings grown under G1% on day 15

    after sowing compared with the seedlings grown under fluorescent light on day 15 after sowing. Environmental conditions for both were the same.
  71. 69 Appendix 6 Solid state relay used for converting digital

    signal from data logger (appendix 7) to on/off signal controlling heaters and fans
  72. 71 Appendix 8 Program of data logger used for controlling

    heaters and fans inside LED box and fluorescent lamp box
  73. Acknowledgment I would like to express my deep gratitude to

    my supervisor, Prof. Dr. Toyoki Kozai, for the opportunity to study in his laboratory, also his invaluable guidance, supports, continuous encouragement and understanding with his inspiration. Also to Dr. Chieri Kubota and Dr. Changhoo Chun for their careful help, invaluable suggestions, helpful advise and continuous encouragement, and to Prof. Dr. Suranant Subhadrabandhu of Kasetsart University, Thailand for his invaluable advise. My gratitude also extends to all my teachers, in the past and present, I do not mention here. I am indebted to Assoc. Prof. Yutaka Shinohara and Assoc. Prof. Takato Koba for their invaluable suggestions and inspection of this thesis. Thanks to Dr. Sandra. B. Wilson for her careful correcting parts of this thesis. Thanks to Mr. Lok Yee Hin and Ms Nattaya Montri for their often energetic technical help and friendship. Thanks also to Ms Shirosei, Ms Inoue and all the students in this laboratory, former and present, especially Ms Niu, Ms Heo, Mr Oyama, Mr Mikami, Mr Saito and Mr Otani, for their continuous help, supports, and friendships. Thanks also for my sisters in Chiba University, P’ Pum and P’ Nok. I would like to express my special thanks to the Japanese Ministry of Education, Science and Culture (MONBUSHO) and CHIBA University for giving me opportunities to study and supporting my study in Japan. Finally, I would like to thank my mother (Samorn Chintakovid), grandmother, and relatives who are waiting for me in Thailand. Please know that your love and mortal encouragement are really important for my study.