$30 off During Our Annual Pro Sale. View Details »

Startup Metrics (1 day workshop @ Digital Hub Aachen)

Vidar Andersen
September 23, 2017

Startup Metrics (1 day workshop @ Digital Hub Aachen)

These were the slides for the plusandersen.com 1 day Startup Metrics workshop for the incubated startups at Digital Hub Aachen.
Bookings: [email protected]

Links to videos:

https://classroom.udacity.com/courses/ep245/lessons/48726356/concepts/482719510923

https://www.youtube.com/watch?time_continue=77&v=zbttFfL-1ZQ

https://www.youtube.com/watch?time_continue=3&v=PbclQ3G4naw

https://www.youtube.com/watch?v=Rcm77D_Gz2Q

https://www.youtube.com/watch?time_continue=150&v=AU17IC-9iKg

https://www.youtube.com/watch?time_continue=1&v=AsPmaRr0HHw

https://www.youtube.com/watch?time_continue=3&v=T3dtU_Itqdc

https://www.youtube.com/watch?time_continue=23&v=_xzvTcybDEw

https://www.youtube.com/watch?time_continue=1&v=BDHxxdTNKVY

https://www.youtube.com/watch?time_continue=1&v=mqJw1bjNKEQ

https://www.youtube.com/watch?time_continue=2&v=c5kY7xuxxPE

https://www.youtube.com/watch?time_continue=4&v=Aas-XcBir5c

https://www.youtube.com/watch?time_continue=12&v=q5y30Da7amE

https://www.youtube.com/watch?time_continue=5&v=SsxCoTTncEs

https://classroom.udacity.com/courses/ep245/

https://www.youtube.com/watch?v=irjgfW0BIrw

https://www.youtube.com/watch?v=BYwiwWQDhv0&t=945s

https://www.youtube.com/watch?v=o0t2dBkalDk

https://www.youtube.com/watch?v=uIG1H_EQ6WQ

https://www.youtube.com/watch?v=d_ITwKiruJE

https://www.youtube.com/watch?v=lCtS6xA79fI

https://www.youtube.com/watch?v=lCtS6xA79fI

https://www.youtube.com/watch?v=NyhVdGmnh0I

https://www.youtube.com/watch?v=OWiLcCfDu8c

https://www.youtube.com/watch?v=iWhPPlrurSc

https://chartmogul.com/blog/2015/01/the-ultimate-saas-metrics-cheat-sheet/

http://christophjanz.blogspot.de/

www.forentrepreneurs.com/

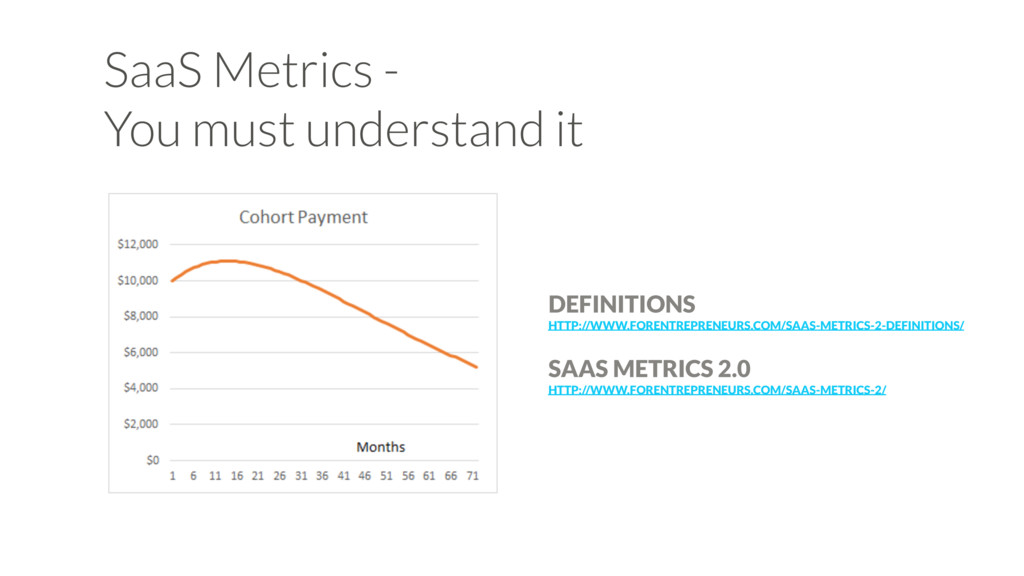
www.forentrepreneurs.com/saas-metrics-2-definitions/

www.forentrepreneurs.com/saas-metrics-2/

https://www.youtube.com/watch?v=MpCJtMLKjgs

https://www.youtube.com/watch?v=MpCJtMLKjgs

https://www.youtube.com/watch?v=hU6p1AWBiw0

https://www.youtube.com/watch?v=nCP4hXgE-Nk

Vidar Andersen

September 23, 2017
Tweet

More Decks by Vidar Andersen

Other Decks in Education

Transcript

  1. STARTUP
    METRICS
    WHAT & HOW TO MEASURE
    DIGIHUB AACHEN
    SEPTEMBER 21. 2017

    View Slide

  2. GET
    KEEP
    GROW
    THE FUNNEL

    WITH STEVE BLANK

    View Slide


  3. View Slide

  4. View Slide

  5. View Slide

  6. View Slide

  7. GETTING - PHYSICAL

    View Slide

  8. 1ST VIRAL LOOP

    View Slide

  9. USE YOUR OWN LABELS

    View Slide

  10. View Slide

  11. View Slide

  12. GET

    View Slide

  13. View Slide

  14. KEEP

    View Slide

  15. GROW

    View Slide

  16. EXAMPLE

    View Slide

  17. EXAMPLE

    View Slide

  18. https://classroom.udacity.com/courses/ep245/
    TAKE
    THE FULL
    COURSE

    View Slide

  19. METRICS
    THAT
    MATTERS
    HOW AND WHAT TO MEASURE

    A FRAMEWORK

    View Slide

  20. AARRR!
    METRICS FOR PIRATES

    View Slide

  21. CUSTOMER LIFECYCLE
    5 STEPS TO SUCCESS
    • Acquisition: Users come to you from various channels
    • Activation: Users enjoy 1st visit; “Happy” user experience
    • Retention: Users come back, visit site multiple times
    • Referral: Users like product enough to refer others
    • Revenue: Users conduct some monetising behaviour

    View Slide

  22. Dave
    McClure
    Founder 500 Startups

    View Slide

  23. CUSTOMER
    LIFECYCLE /
    CONVERSION
    BEHAVIOUR

    View Slide

  24. EXAMPLE CONVERSION METRICS
    (NOTE: *NOT* ACTUAL; YOUR MILEAGE MAY VARY)

    View Slide

  25. View Slide

  26. View Slide

  27. View Slide

  28. View Slide

  29. View Slide

  30. TYPES OF METRICS &
    MEASUREMENT
    • Qualitative: Usability Testing / Session Monitoring

    - Watch what users do, figure out problems & solutions from small # of users
    • Quantitative: Traffic Analysis / User Engagement

    - Report what users do, track usage & conversion %s for all or empirical sample #
    • Comparative: A/B Multivariate Testing

    - Compare what users do in one scenario vs another, see which copy/graphics/UI
    are most effective
    • Competitive: Monitoring and Tracing Competitors

    Track competitor activity and compare against yours; if possible compare
    channels, keyword traffic, demographic targeting, user satisfaction, etc.

    View Slide

  31. QUANTITATIVE & 

    COMPARATIVE MEASUREMENT
    • Conversion Criteria:

    - Best-Performing (%) Channels / Campaigns / Copy

    - Largest-Volume (#) Channels / Campaigns / Copy

    - Lowest-Cost ($) Channels / Campaigns / Copy
    • Measurement Components:

    - Audience Segment (young women, regional metro, older singles)

    - Channel Source (social media, SEM, organic, PR, etc)

    - Campaign Time / Brand Promise (“Find a job”, “Learn to cook”)

    - Landing Page & CTA

    - Copy & Graphics

    View Slide

  32. EXAMPLE CONVERSION METRICS
    (NOTE: *NOT* ACTUAL; YOUR MILEAGE MAY VARY)

    View Slide

  33. EXAMPLE CONVERSION METRICS
    (NOTE: *NOT* ACTUAL; YOUR MILEAGE MAY VARY)

    View Slide

  34. EXAMPLE CONVERSION METRICS
    (NOTE: *NOT* ACTUAL; YOUR MILEAGE MAY VARY)

    View Slide

  35. EXAMPLE CONVERSION METRICS
    (NOTE: *NOT* ACTUAL; YOUR MILEAGE MAY VARY)

    View Slide

  36. EXAMPLE CONVERSION METRICS
    (NOTE: *NOT* ACTUAL; YOUR MILEAGE MAY VARY)

    View Slide

  37. MARKETING
    • Q: What channels do you market to?

    - Design & Test multiple marketing channels

    - Select & Focus on channels with:

    - High Volume

    - High Conversion

    - Low Cost
    • Measure *deeper* down the conversion funnel, not just to
    website / landing page
    • Segment & Select Channels & Customers by conversion @
    deepest possible level (ideally $$$)

    View Slide

  38. PRODUCT
    • Q: How do you chose what to build?
    • Chose features for conversion improvement

    - 80% on existing feature optimisation

    - 20% on new feature development
    • Just guess - then A/B test - a LOT!
    • Measure conversion improvement
    • Rinse & Repeat

    View Slide

  39. FOUNDER / CEO
    • Q: What metrics do you chose to watch?
    • Hypothesise Customer Lifecycle & Refine

    - Chose 5-10 conversion steps

    - Less, not more, is better
    • BUT measure & iterate
    • Focus on conversion improvement
    • Delegate each metric to someone to OWN

    View Slide

  40. Firebase & AARRR Metrics
    @ Google I/O

    View Slide

  41. Ash 

    Maurya
    Running Lean

    View Slide

  42. READ
    THE
    BOOK

    View Slide

  43. Alistair 

    Croll
    Lean Analytics
    @ Google Ventures

    View Slide

  44. CAC VS LTV
    For each dollar you spend acquiring a customer,
    how many dollars does it leave behind in the
    whole lifespan you have them as a customer?
    CAC = Customer Acquisition Cost
    LTV = Customer Lifetime Value
    A CAC : LTV ratio of 1 : 3 or better = good

    View Slide

  45. CAC vs LTV - The Driving Factors
    • High Churn Rate
    • Low Customer 

    Satisfaction
    • Lack Of Stickiness
    • Recurring Revenue
    • Scalable Pricing
    • Cross-Sell / Up-Sell
    • Additions To Product

    Catalogue
    • Lead-Gen For 3Rd Party
    • Sales Force In The Field
    • Outbound Marketing
    • Unoptimised Campaign
    • Wrong Target Audience
    • Wrong Channel
    • No Network Effects
    • Network Effects
    • Inbound Marketing
    • Free Or Freemium
    • Open Source
    • Free Trial
    • Touchless Conversion
    • Direct Marketing
    • Channels
    • Strategic Partnerships
    CAC LTV

    View Slide

  46. CAC
    CALCULATION

    View Slide

  47. GROWTH RATE
    “Startups = Growth” by Paul Graham of YC
    What is your growth week over week?
    More than 7% week over week is great

    View Slide

  48. ENGAGEMENT RATE
    “30 / 10 / 1” by Fred “AVC” Wilson
    What is the % of all your registered users
    that will use the service or app Monthly /
    Daily / Concurrent (At Any Given Time)?
    30/10/1 or better is good

    View Slide

  49. DAU MAU
    The ratio of Daily Active Users to Monthly
    Active Users.

    For example, aDAU/MAU ratio of 50%
    would mean that the average user of your
    app is using it 15 out of 30 days that month.
    A simple metric to predict, with a high level
    of probability, the success of your product.

    View Slide

  50. COHORT ANALYSIS

    YOU NEED TO UNDERSTAND IT
    VIDEO:

    Cohort Analytics Explained
    VIDEO: 

    Google Labs Cohort Analysis Workshop

    View Slide

  51. WHY
    COHORTS
    Bernd Leger, Localytics

    View Slide

  52. WHY
    COHORTS

    View Slide

  53. WHY
    COHORTS

    View Slide

  54. SERIOUSLY
    YOU NEED TO UNDERSTAND IT
    COHORTANALYSIS.COM

    View Slide

  55. Your churn rate is the amount of customers or
    subscribers who cut ties with your service or
    company during a given time period. These
    customers have “churned.”
    READ http://churn-rate.com
    CHURN RATE

    View Slide

  56. CHURN
    FOR DUMMIES

    View Slide

  57. CHURN

    View Slide

  58. SaaS Metrics - 

    You need to track it
    SAAS METRICS


    The Ultimate SaaS Metrics Cheat Sheet
    Christoph Janz' Blog
    David Skok's Blog

    View Slide

  59. SaaS Metrics - 

    You must understand it
    DEFINITIONS

    HTTP://WWW.FORENTREPRENEURS.COM/SAAS-METRICS-2-DEFINITIONS/
    SAAS METRICS 2.0

    HTTP://WWW.FORENTREPRENEURS.COM/SAAS-METRICS-2/

    View Slide

  60. SAAS
    METRICS
    Hamid Shojaee, Founder/CEO PureChat

    View Slide

  61. DAVID
    SKOK
    Mr. SaaS Metrics

    View Slide

  62. How to define your market size
    TAM - Total Available Market

    Theoretical total market size or customer 

    mass with problem today
    SAM - Serviceable Available Market

    Theoretical total market size or customer mass 

    that are able to use / purchase a solution like 

    yours right now
    SOM - Serviceable Obtainable Market 

    Your target market cap or customer base within 

    the next 2-3 years, your credible ambition
    TAM
    SAM
    SOM

    View Slide

  63. TAM SAM SOM - Rough Example
    Say you want to make a dating app for iOS
    Your theoretical TAM would be 1.6b world wide, the number of all adults in the
    world seeking a partner, the number of people with the actual need or problem
    Your theoretical SAM is the percentile of 1.6b adults who has an iPhone, not all
    iPhone users in the world, not all smartphone users in the world, e.g. 1.6b
    people out of 7b is 14% of all people, your SAM could then be 14% of the 500m
    iPhones sold worldwide = 70m
    Your SOM or Target Market could be the percentile of the 70m that you can
    realistically acquire and serve in the immediate next years. This varies
    individually because it is based on your personnel (team size, positioning,
    channels, partners, funds, locality and competences - current and planned) and
    the efficiency of your marketing (CAC vs LTV, current and feasible) of your
    individual product

    View Slide

  64. How to find market data
    Use Google, use Quora, use CB Insights, Crunchbase

    Seriously, JFGI: Just F*ing Google It
    Find facts in reports from Gartner, Forester, BCG, etc to lend
    some named sources to your numbers - You’ll be amazed by what
    you can find online
    TAM/SAM/SOM is an ART, not a SCIENCE - 

    Don’t make it too complicated.
    Do NOT make facts and figures up, do not use questionable
    sources, do not conflate markets - EVER

    View Slide

  65. MAT
    JOHNSON
    Partner @ 500 Startups

    View Slide

  66. WHAT IS
    GROWTH
    HACKING

    View Slide

  67. WAIT
    DO YOU HAVE
    PRODUCT-
    MARKET FIT

    View Slide

  68. IF NO -
    FORGET IT

    View Slide

  69. WHAT IS
    GROWTH
    HACKING
    Ryan Holiday

    View Slide

  70. REPORT
    HOW MANY
    INTERVIEWS
    AND WHAT DID
    YOU LEARN
    WHAT HAPPENED 

    SINCE LAST WEEK

    View Slide

  71. EXERCISE
    WHAT ARE YOUR
    SUCCESS METRICS?
    IT’S EXERCISE TIME

    View Slide

  72. EXERCISE
    WHAT DOES YOUR
    USER JOURNEY
    LOOK LIKE?
    IT’S EXERCISE TIME

    View Slide

  73. EXERCISE
    HOW ARE YOU
    GOING TO
    MEASURE IT
    IT’S EXERCISE TIME

    View Slide

  74. HOMEWORK
    MEASURE & MOVE
    YOUR SUCCESS
    METRIC(S)
    IT’S EXERCISE TIME

    View Slide

  75. HOMEWORK
    CONDUCT
    AT LEAST15
    CUSTOMER
    INTERVIEWS
    IT’S EXERCISE TIME

    View Slide

  76. GET OUT 

    OF THE
    BUILDING
    GET OUT TIME

    View Slide

  77. WE HELP 

    YOUR COMPANY 

    GET READY 

    FOR TOMORROW
    TODAY
    PLUSANDERSEN.COM

    View Slide

  78. MORE
    PLUSANDERSEN.COM
    • Education & Training
    • Programs & Processes
    • Innovation Metrics
    • Management Tools
    • Innovation Outposts
    • Human Assets
    SOME OF OUR CUSTOMERS:

    View Slide

  79. PRE-ACCELERATION ACCELERATION
    GENERATION EDUCATION SELECTION FINAL DECISION SCALING UP
    DEALFLOW
    LEARNING JOURNEY
    LEARNING KEYNOTE
    KILL YOUR COMPANY
    INNOVATOR
    MASTERCLASS
    INNOVATOR
    BOOTCAMP
    LEAN
    LAUNCHPAD
    MVP AS 

    A SERVICE
    INNOVATION
    OUTPOSTS
    DEMO
    DAY
    PITCHING
    MASTERCLASS
    EXPERTS AS
    A SERVICE
    MENTORS AS
    A SERVICE
    TRAIN THE TRAINER
    SPINNING
    OUT
    +ANDERSEN PROGRAMS
    AT ALL STAGES

    View Slide

  80. +ANDERSEN 

    & ASSOCIATES
    INNOVATION & GROWTH
    THROUGH
    SCIENCE + ENTREPRENEURSHIP
    LEARN MORE

    PLUSANDERSEN.COM

    View Slide