I have personally been involved in during grad school n Going to start with the Research Question (RQ) and background, then cover the design, data, and analysis used ¡ RQ should always drive the design & analysis n Going to cover a wide range of topics, feel free to interrupt to ask questions
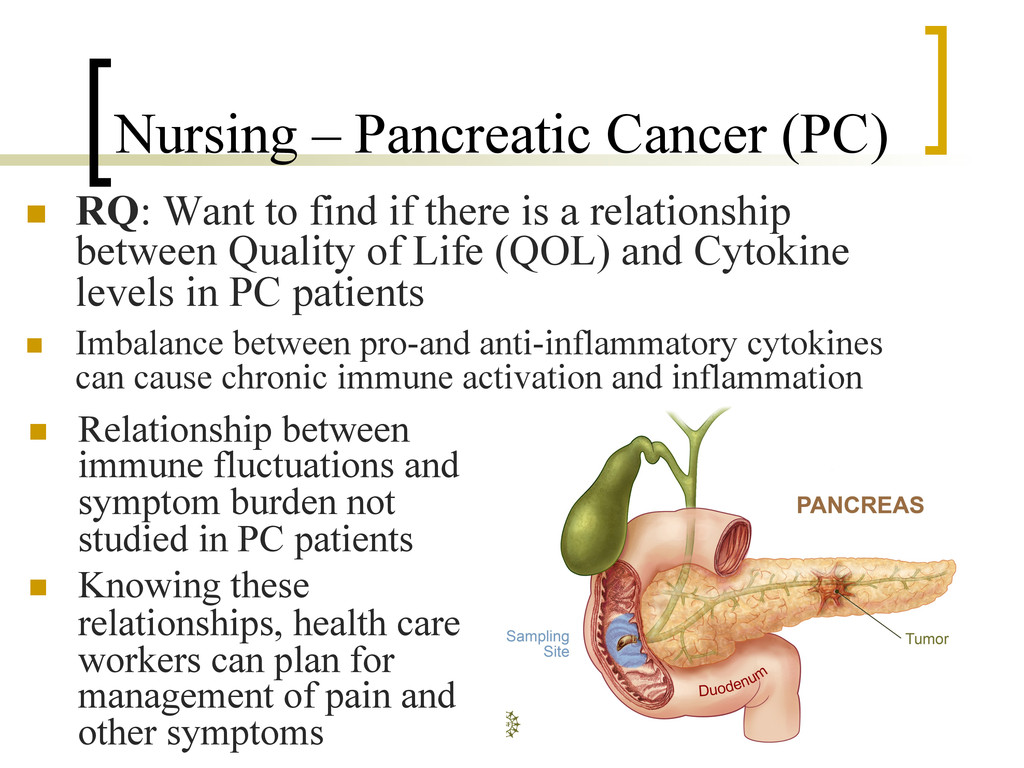
if there is a relationship between Quality of Life (QOL) and Cytokine levels in PC patients n Imbalance between pro-and anti-inflammatory cytokines can cause chronic immune activation and inflammation n Relationship between immune fluctuations and symptom burden not studied in PC patients n Knowing these relationships, health care workers can plan for management of pain and other symptoms
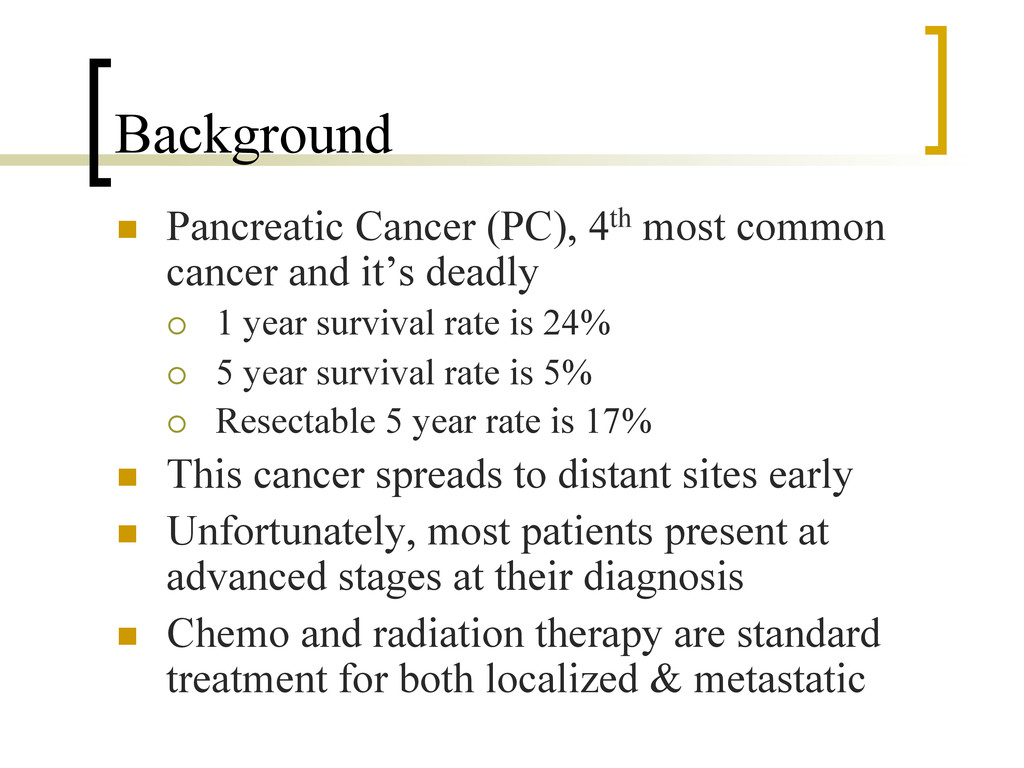
it’s deadly ¡ 1 year survival rate is 24% ¡ 5 year survival rate is 5% ¡ Resectable 5 year rate is 17% n This cancer spreads to distant sites early n Unfortunately, most patients present at advanced stages at their diagnosis n Chemo and radiation therapy are standard treatment for both localized & metastatic
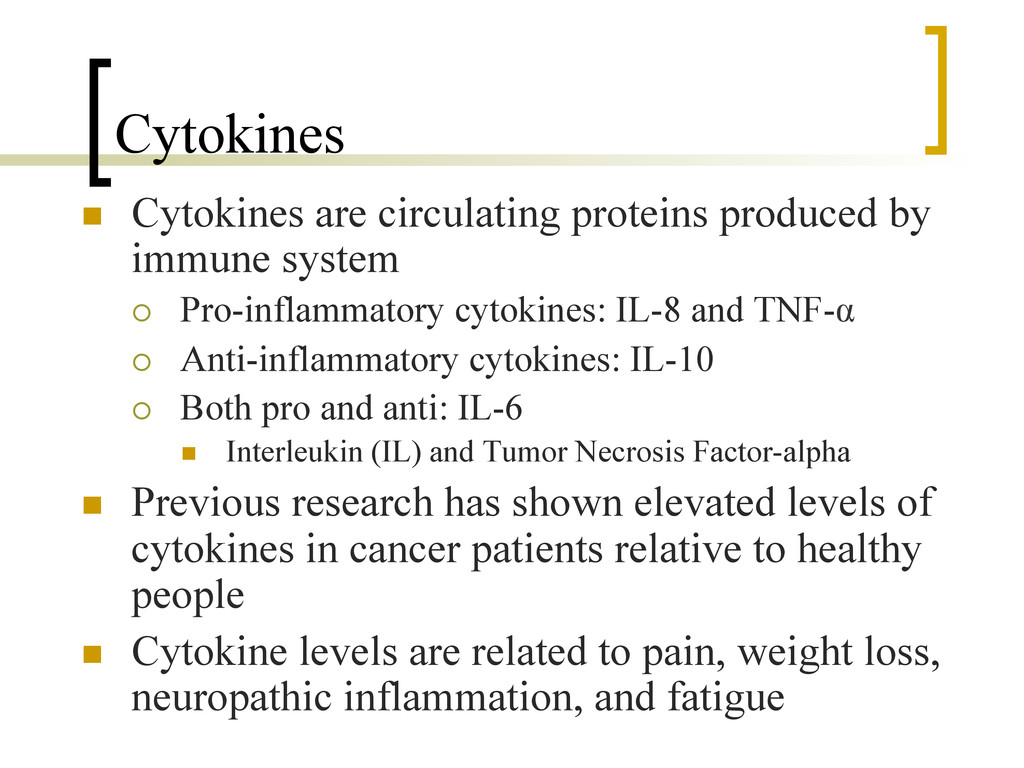
¡ Pro-inflammatory cytokines: IL-8 and TNF-α ¡ Anti-inflammatory cytokines: IL-10 ¡ Both pro and anti: IL-6 n Interleukin (IL) and Tumor Necrosis Factor-alpha n Previous research has shown elevated levels of cytokines in cancer patients relative to healthy people n Cytokine levels are related to pain, weight loss, neuropathic inflammation, and fatigue
as both create significant toxicities ¡ Which can have a profound effect on patient’s symptom burden and immune function n Stages of Cancer (I-IV) are also directly related to QOL n (FHSI-8) The Functional Assessment of Cancer Therapy: Hepatobiliary Symptom Index-8 ¡ A measure of Quality of Life ¡ Likert scale of pain ratings, fatigue, and symptom presence ¡ Higher scores indicate more pain & discomfort
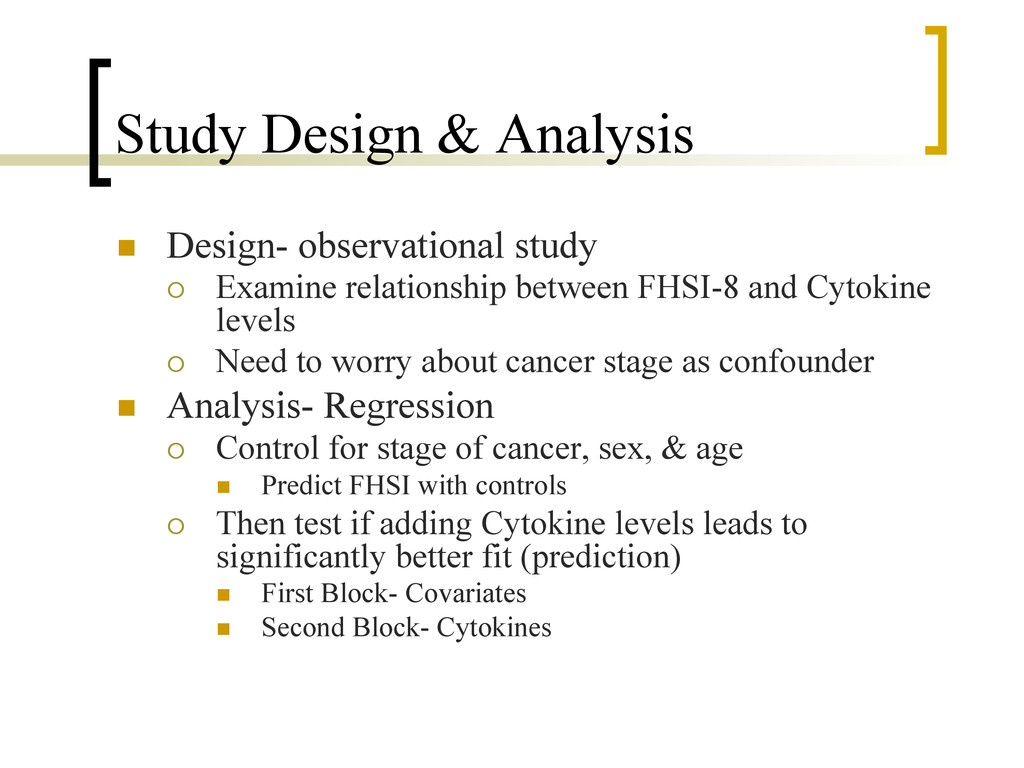
relationship between FHSI-8 and Cytokine levels ¡ Need to worry about cancer stage as confounder n Analysis- Regression ¡ Control for stage of cancer, sex, & age n Predict FHSI with controls ¡ Then test if adding Cytokine levels leads to significantly better fit (prediction) n First Block- Covariates n Second Block- Cytokines
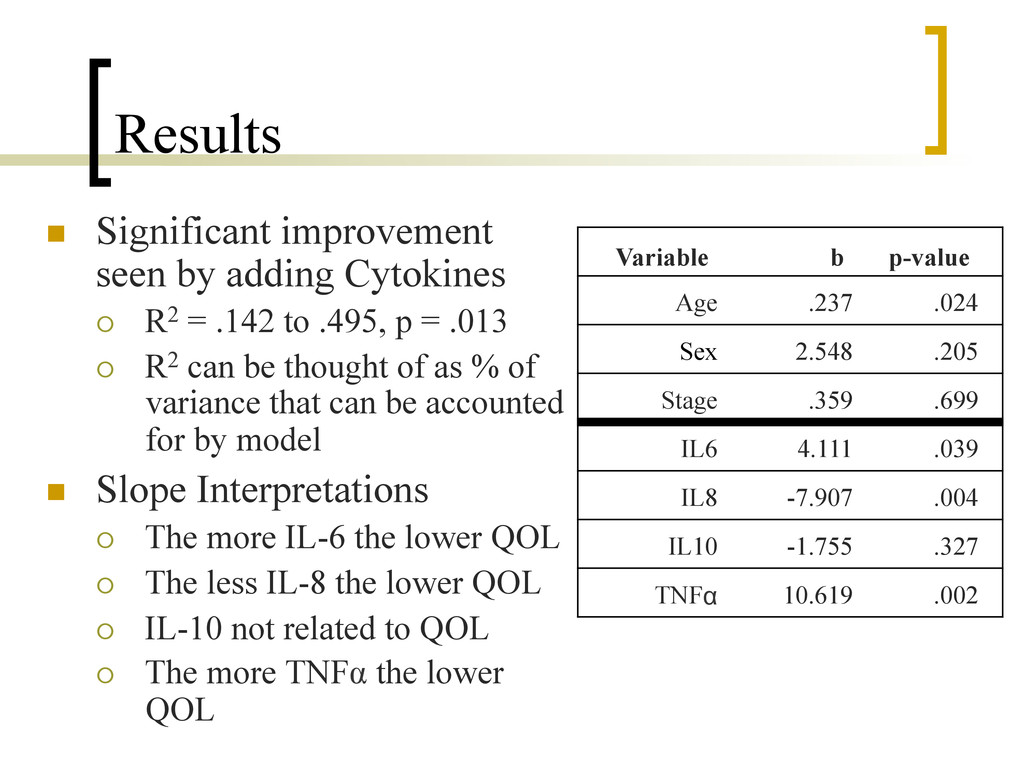
= .142 to .495, p = .013 ¡ R2 can be thought of as % of variance that can be accounted for by model n Slope Interpretations ¡ The more IL-6 the lower QOL ¡ The less IL-8 the lower QOL ¡ IL-10 not related to QOL ¡ The more TNFα the lower QOL Variable b p-value Age .237 .024 Sex 2.548 .205 Stage .359 .699 IL6 4.111 .039 IL8 -7.907 .004 IL10 -1.755 .327 TNFα 10.619 .002
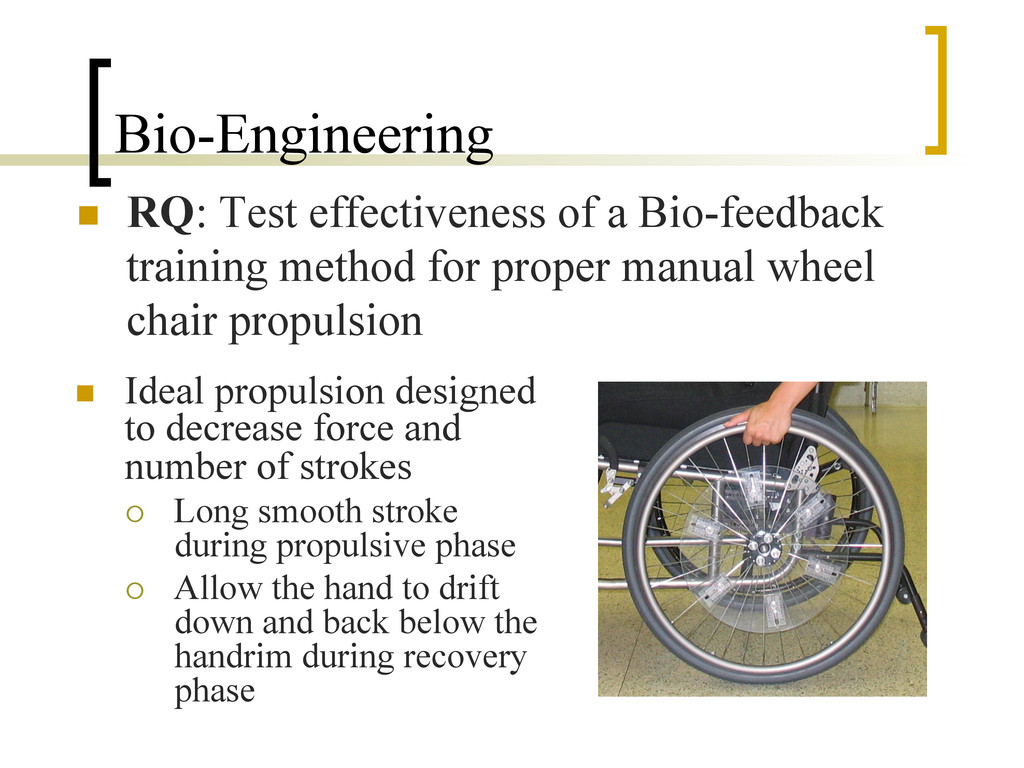
for proper manual wheel chair propulsion n Ideal propulsion designed to decrease force and number of strokes ¡ Long smooth stroke during propulsive phase ¡ Allow the hand to drift down and back below the handrim during recovery phase
upper extremity pain often in the shoulder and wrist n Teaching proper propulsion is not standardized n Majority of the studies examine performance & technique at fixed speeds, on treadmills or dynamometers ¡ Have not used real life propulsion scenarios, overground ¡ Have not allowed participants to use their own wheelchairs
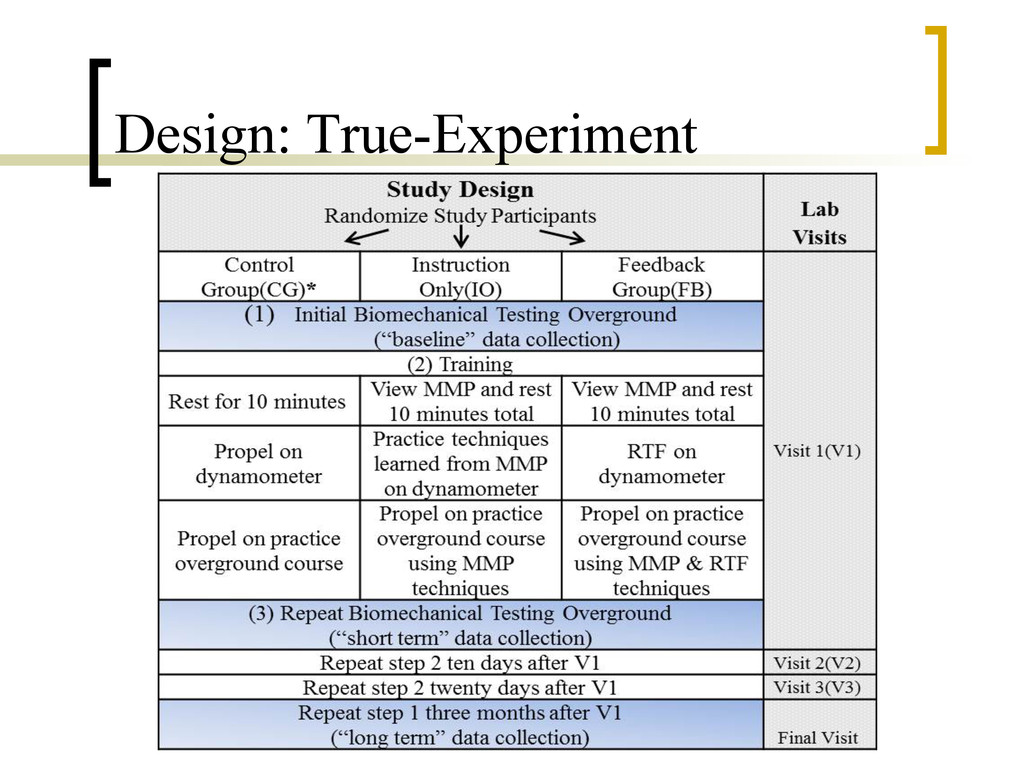
time, short and long term improvement n Effectiveness of training across 2 other IVs ¡ Surface Type: carpet, tile, and ramp ¡ Speed: self-selected or targeted n Design- Experiment ¡ Control Group ¡ Instruction Only Group n Given a multimedia presentation showing proper form ¡ Bio-feedback Group n Given the multimedia presentation n Had a motor learning training program
you are more force used ¡ Time since injury – longer you have been injured, the more efficient pushing should be ¡ Level of injury – amount of function in wrists and hands n Velocity is a confounder ¡ The faster you are going, the more force exerted and not a function of poor technique ¡ Velocity is not a constant like other covariates
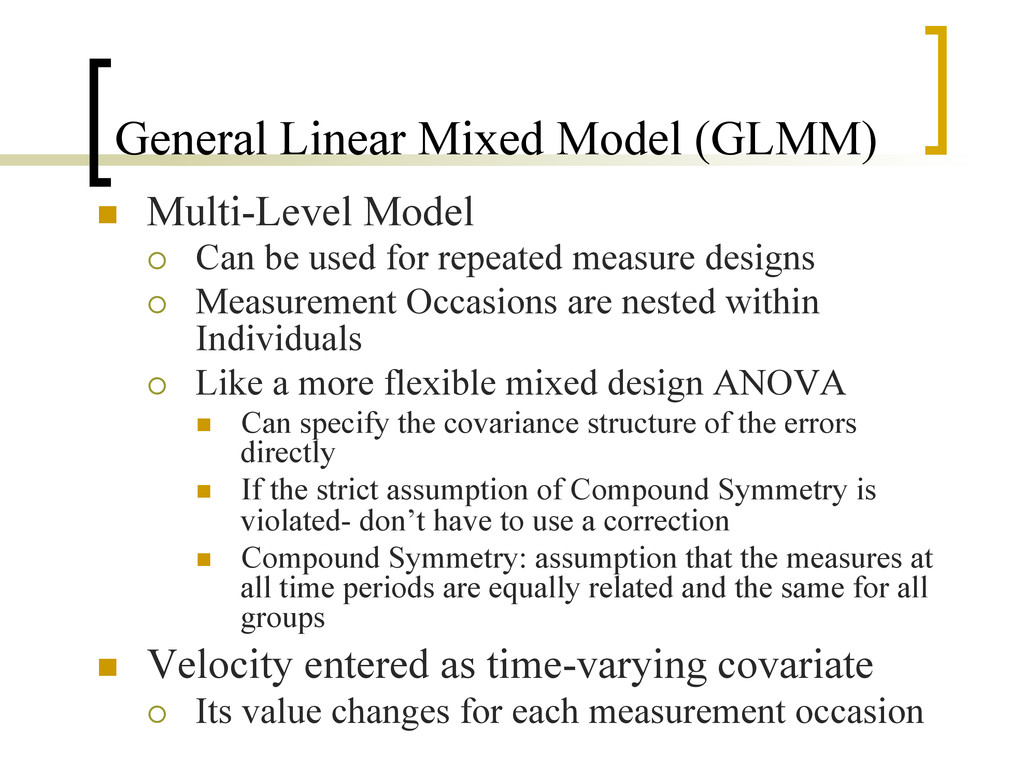
be used for repeated measure designs ¡ Measurement Occasions are nested within Individuals ¡ Like a more flexible mixed design ANOVA n Can specify the covariance structure of the errors directly n If the strict assumption of Compound Symmetry is violated- don’t have to use a correction n Compound Symmetry: assumption that the measures at all time periods are equally related and the same for all groups n Velocity entered as time-varying covariate ¡ Its value changes for each measurement occasion
use same wheelchair throughout study ¡ No difference between groups in demographics n Four outcome measures ¡ Contact Angle (larger is better) ¡ Stroke frequency ¡ Peak Force (peak force during push) ¡ Rate of Rise (how rapidly force is applied to handrim, the quicker the better)
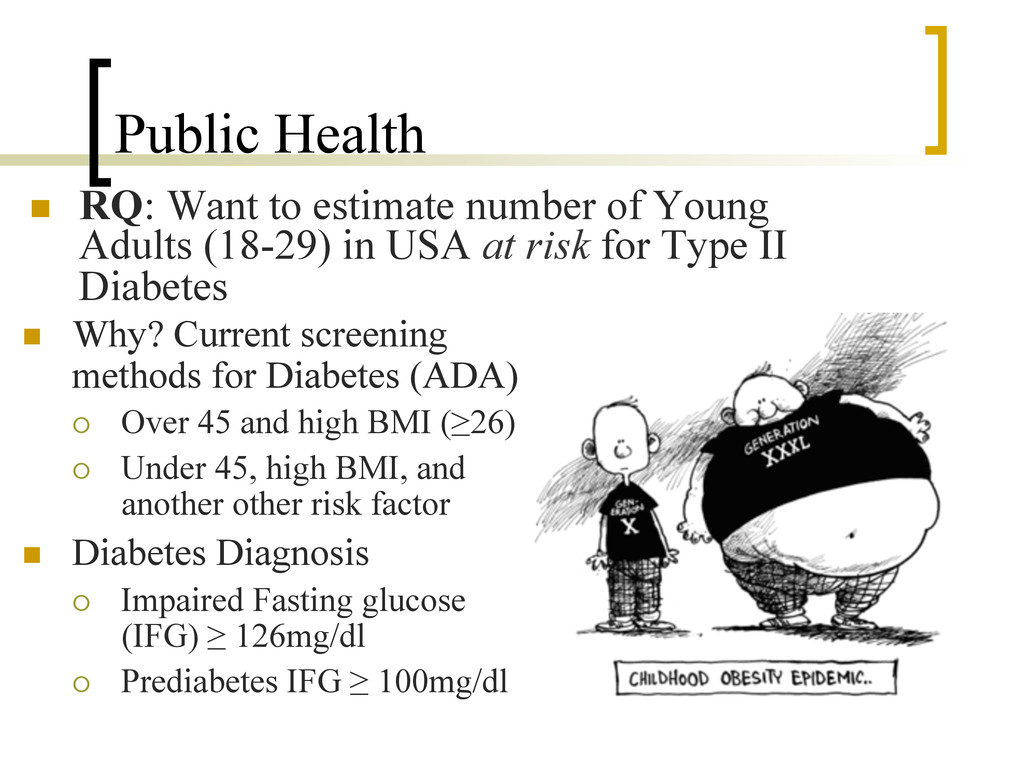
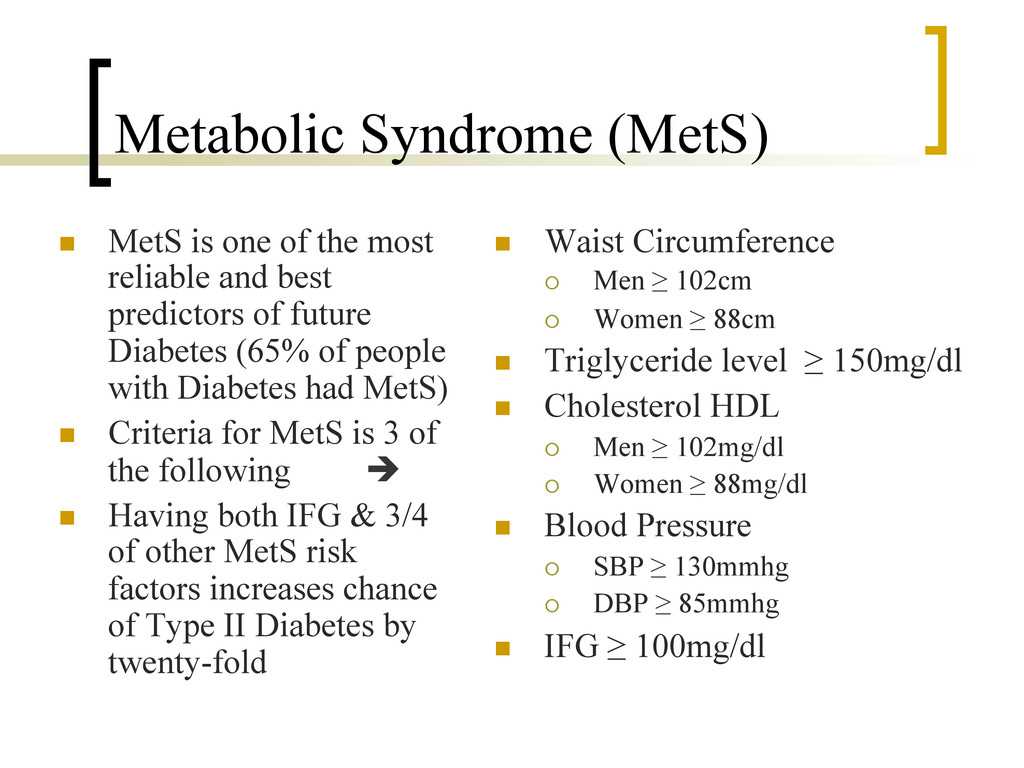
Adults (18-29) in USA at risk for Type II Diabetes n Why? Current screening methods for Diabetes (ADA) ¡ Over 45 and high BMI (≥26) ¡ Under 45, high BMI, and another other risk factor n Diabetes Diagnosis ¡ Impaired Fasting glucose (IFG) ≥ 126mg/dl ¡ Prediabetes IFG ≥ 100mg/dl
reliable and best predictors of future Diabetes (65% of people with Diabetes had MetS) n Criteria for MetS is 3 of the following è n Having both IFG & 3/4 of other MetS risk factors increases chance of Type II Diabetes by twenty-fold n Waist Circumference ¡ Men ≥ 102cm ¡ Women ≥ 88cm n Triglyceride level ≥ 150mg/dl n Cholesterol HDL ¡ Men ≥ 102mg/dl ¡ Women ≥ 88mg/dl n Blood Pressure ¡ SBP ≥ 130mmhg ¡ DBP ≥ 85mmhg n IFG ≥ 100mg/dl
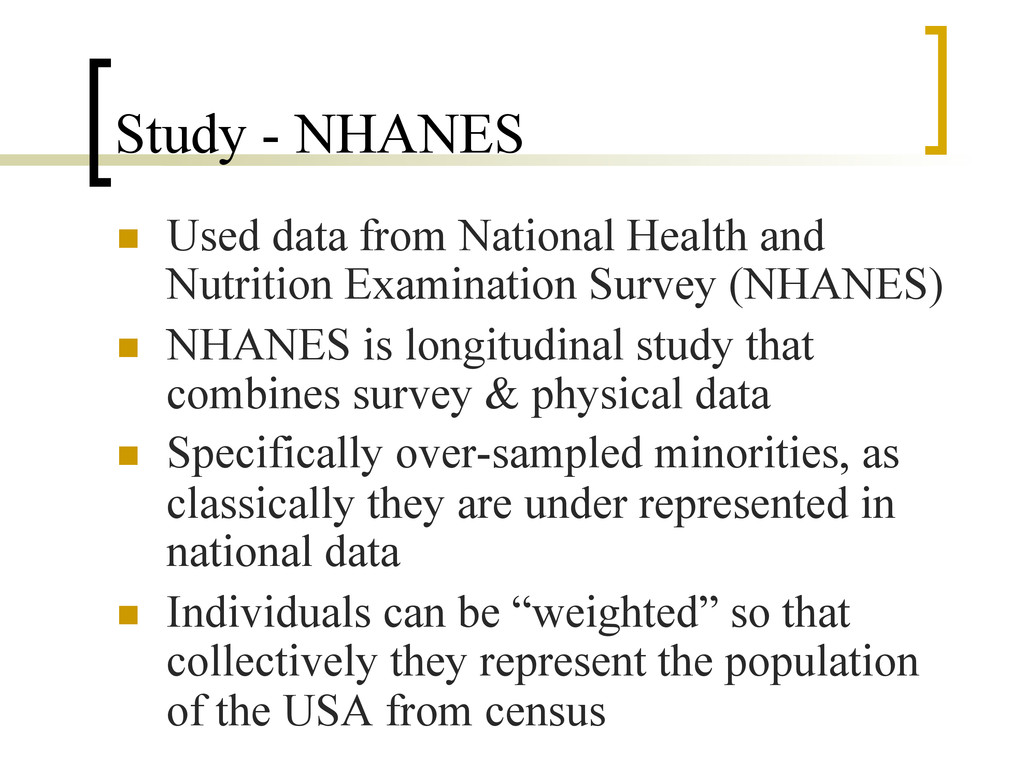
Nutrition Examination Survey (NHANES) n NHANES is longitudinal study that combines survey & physical data n Specifically over-sampled minorities, as classically they are under represented in national data n Individuals can be “weighted” so that collectively they represent the population of the USA from census
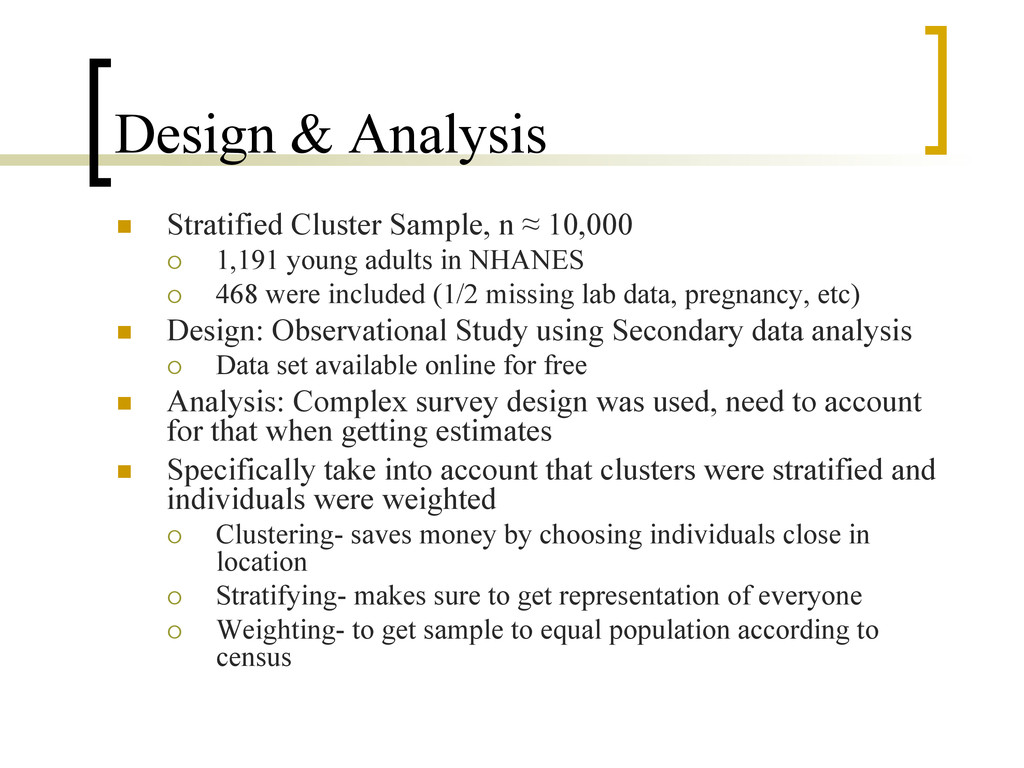
¡ 1,191 young adults in NHANES ¡ 468 were included (1/2 missing lab data, pregnancy, etc) n Design: Observational Study using Secondary data analysis ¡ Data set available online for free n Analysis: Complex survey design was used, need to account for that when getting estimates n Specifically take into account that clusters were stratified and individuals were weighted ¡ Clustering- saves money by choosing individuals close in location ¡ Stratifying- makes sure to get representation of everyone ¡ Weighting- to get sample to equal population according to census
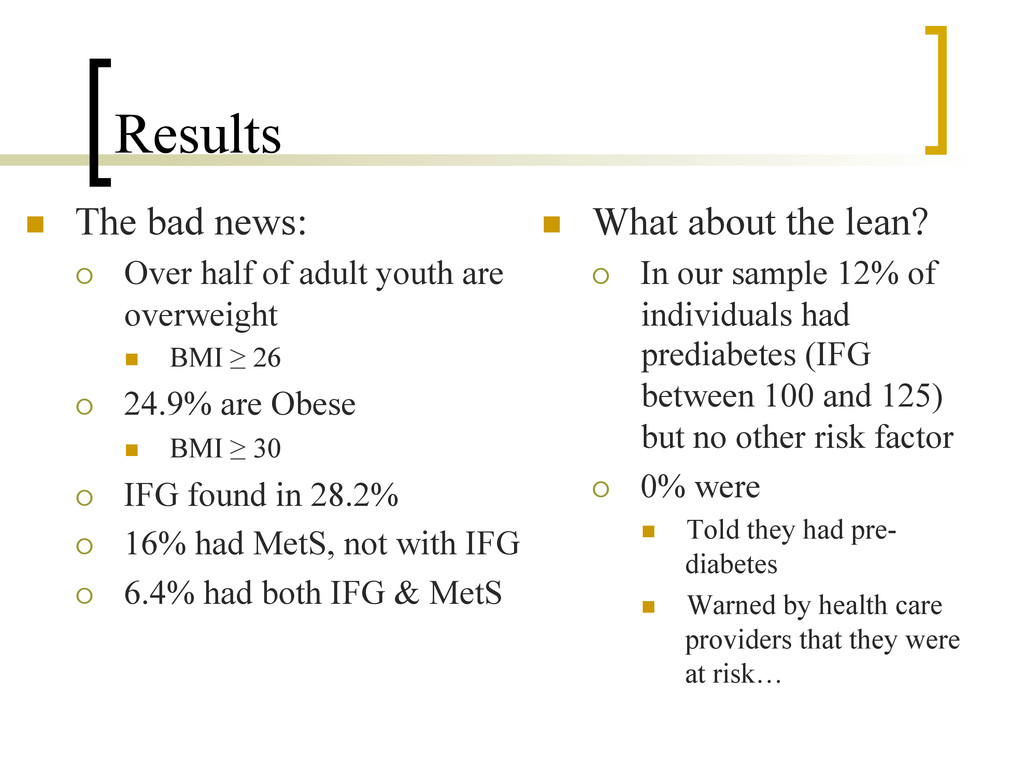
youth are overweight n BMI ≥ 26 ¡ 24.9% are Obese n BMI ≥ 30 ¡ IFG found in 28.2% ¡ 16% had MetS, not with IFG ¡ 6.4% had both IFG & MetS n What about the lean? ¡ In our sample 12% of individuals had prediabetes (IFG between 100 and 125) but no other risk factor ¡ 0% were n Told they had pre- diabetes n Warned by health care providers that they were at risk…
who is at risk for dropping out of School ¡ Collect validity evidence showing ADSI-E is effective in predicting drop outs n High School drop outs are at risk for mental health problems, substance abuse, crime, etc n If we could predict drop out and what factors influence it, educators could devote resources to help
was adapted for school settings n Converted to the Adolescent Development Screening Inventory for Education (ADSI-E) ¡ Minor changes in wording of items ¡ Items were grouped into different sub categories n Validity evidence gathered over 15+ years for DUSI, since this study further evidence has been collected supporting use for the ADSI-E
or no, 8 are lie scale ¡ 1 Total and 9 domain scores n Domains ¡ Peer Relationships n Peer pressure ¡ School Adjustment n School climate ¡ Family Systems n Family background ¡ Leisure and Recreation n Physical Activity ¡ Physical Health ¡ Emotional Health ¡ Social Competence n Social skills ¡ Behavior Patterns n Externalization of negative behavior ¡ Substance Abuse
¡ Would be unethical to assign kids to drop out group n Analysis: ANOVA, comparing groups on ADSI-E n Sample drawn from Blue Water School district in Ontario n Regularly attending students n = 442 n “Drop-outs” n = 97 ¡ Were enrolled in one of three off-site regional Centers for Individual Studies ¡ Part-time students in alternative programs ¡ Conservative measure of “drop-out” as these were not students with 0 engagement
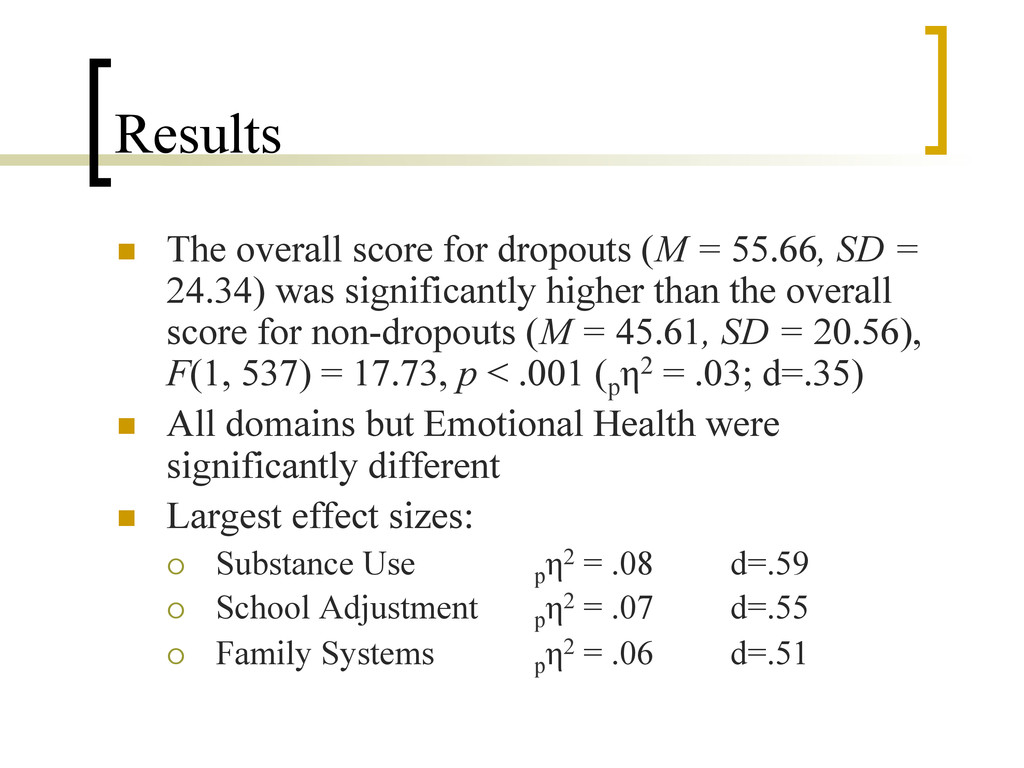
SD = 24.34) was significantly higher than the overall score for non-dropouts (M = 45.61, SD = 20.56), F(1, 537) = 17.73, p < .001 (p η2 = .03; d=.35) n All domains but Emotional Health were significantly different n Largest effect sizes: ¡ Substance Use p η2 = .08 d=.59 ¡ School Adjustment p η2 = .07 d=.55 ¡ Family Systems p η2 = .06 d=.51
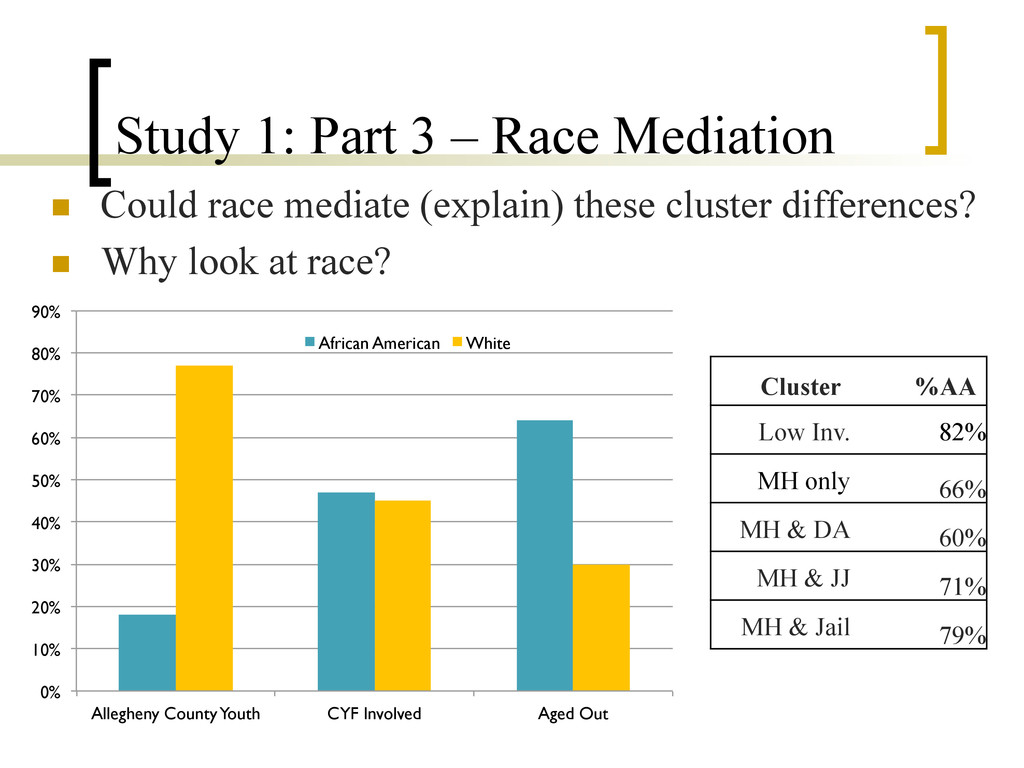
of Child-Welfare system involvement among youth, who have aged out of the child welfare system ¡ Look at the impact of Race n Data from Department of Human Services (DHS) anyone involved with Child/Youth-Welfare n All kids born between 1985-1994 in Allegheny County with system involvement n 42,735 youth from 23,754 families ¡ 51% male ¡ 47% Black, 45% White, 6% other n Aged out youth: are kids who do not have a stated goal of reunification with their families prior to leaving the custody of the child welfare system
placement n In Foster or Kinship Care n In Group Home or Residential Facility ¡ Received any type welfare service n Mental Health (MH) n Drug & Alcohol (DA) n Employment Training (ET) n Housing & Homeless (HH) ¡ Involved with Justice System n Juvenile Justice (JJ) n Jail n Special Subsample of Aging Out Youth: ¡ 17 and older when left care with one year or more in out of home placement
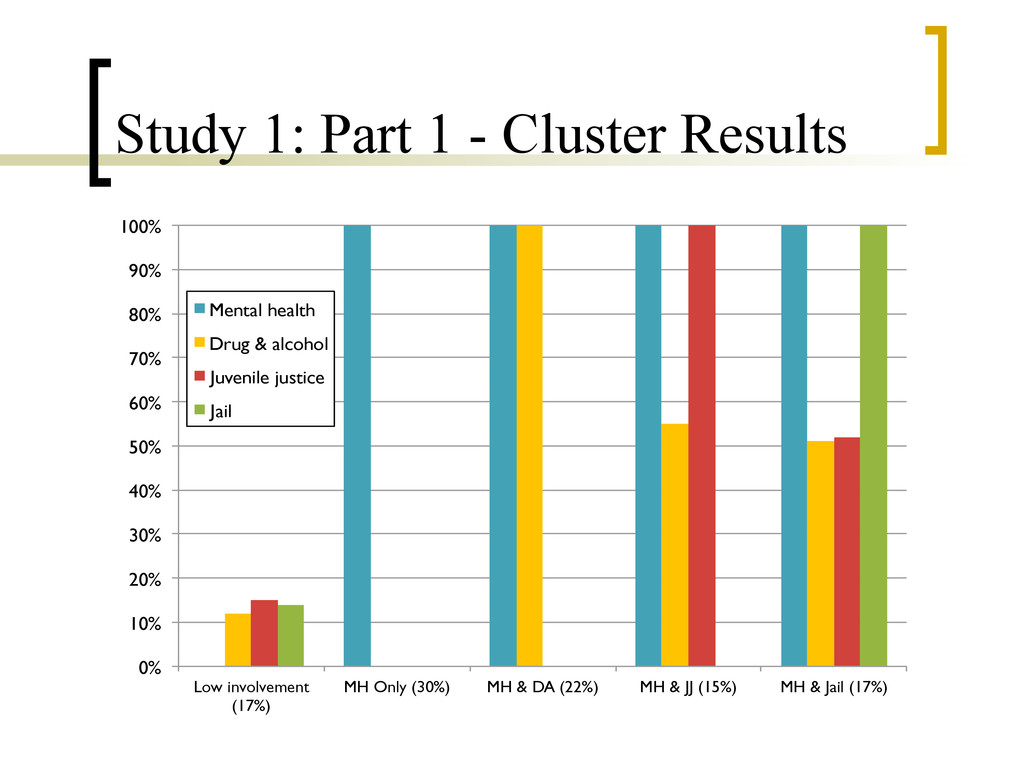
Data but primary data collection n Part 1: Two-step Cluster Analysis ¡ Identifies homogeneous subgroups ¡ Used the diversity of DHS services to create groups n Part 2: Test Cluster differences on 12 variables using ANOVAs- Are clusters meaningful? n Part 3: Test Mediation by Race- Can race explain the Cluster differences? n Part 4: Test Cluster Differences using ANCOVA to adjust for potential confounders
low involvement groups compared to the high involvement groups ¡ Have more placements (5, 7) : (9, 11, 9) ¡ Spend larger % of time not in foster care (77%, 63) : (39%, 42, 45) ¡ More likely to have only foster care (52%, 29) : (7%, 11, 13) ¡ Less likely to run away (23%, 29) : (46%, 61, 50) n All significant main effects, and post-hoc comparisons controlling for type I error inflation
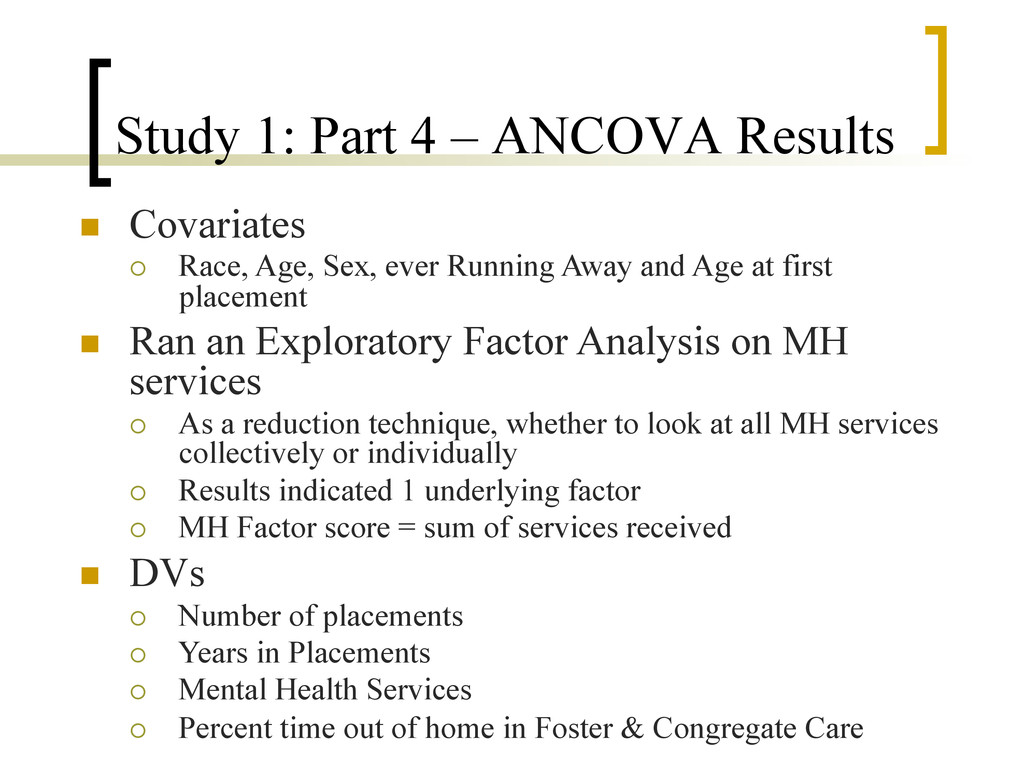
Race, Age, Sex, ever Running Away and Age at first placement n Ran an Exploratory Factor Analysis on MH services ¡ As a reduction technique, whether to look at all MH services collectively or individually ¡ Results indicated 1 underlying factor ¡ MH Factor score = sum of services received n DVs ¡ Number of placements ¡ Years in Placements ¡ Mental Health Services ¡ Percent time out of home in Foster & Congregate Care
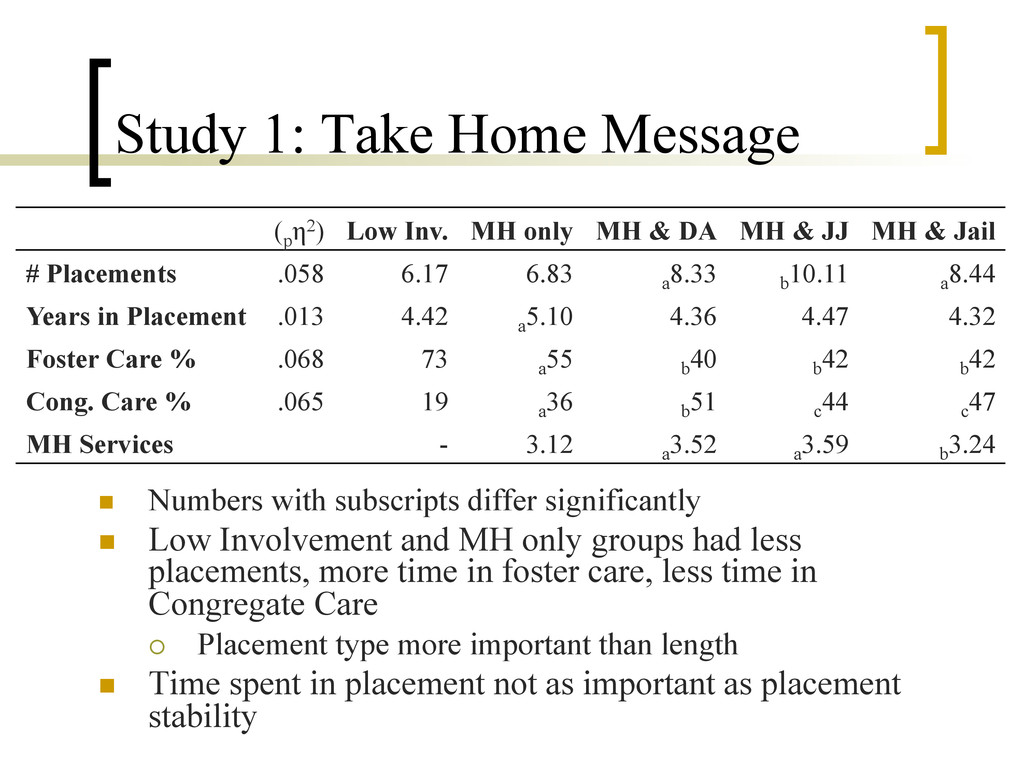
significantly n Low Involvement and MH only groups had less placements, more time in foster care, less time in Congregate Care ¡ Placement type more important than length n Time spent in placement not as important as placement stability (p η2) Low Inv. MH only MH & DA MH & JJ MH & Jail # Placements .058 6.17 6.83 a 8.33 b 10.11 a 8.44 Years in Placement .013 4.42 a 5.10 4.36 4.47 4.32 Foster Care % .068 73 a 55 b 40 b 42 b 42 Cong. Care % .065 19 a 36 b 51 c 44 c 47 MH Services - 3.12 a 3.52 a 3.59 b 3.24
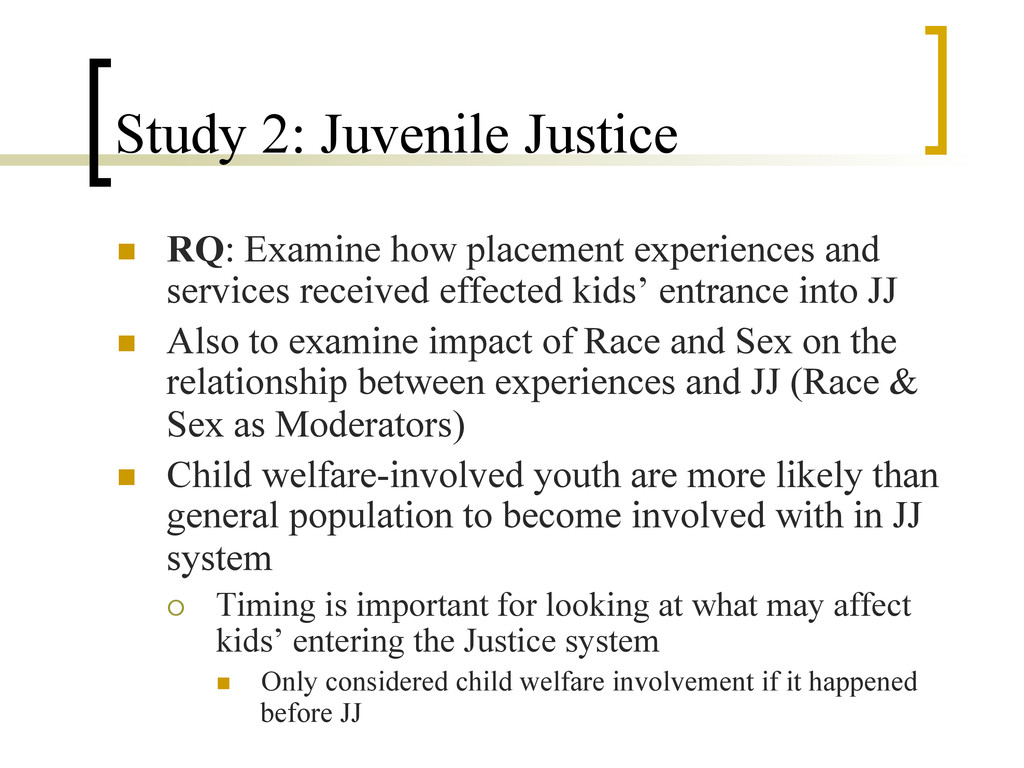
and services received effected kids’ entrance into JJ n Also to examine impact of Race and Sex on the relationship between experiences and JJ (Race & Sex as Moderators) n Child welfare-involved youth are more likely than general population to become involved with in JJ system ¡ Timing is important for looking at what may affect kids’ entering the Justice system n Only considered child welfare involvement if it happened before JJ
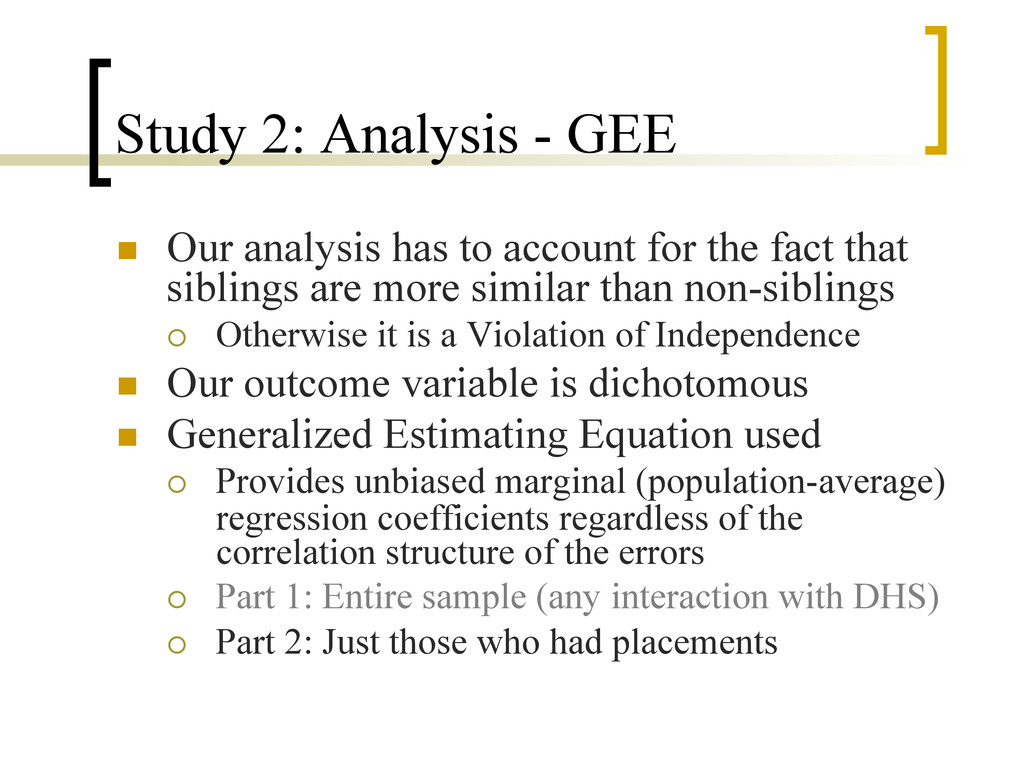
account for the fact that siblings are more similar than non-siblings ¡ Otherwise it is a Violation of Independence n Our outcome variable is dichotomous n Generalized Estimating Equation used ¡ Provides unbiased marginal (population-average) regression coefficients regardless of the correlation structure of the errors ¡ Part 1: Entire sample (any interaction with DHS) ¡ Part 2: Just those who had placements
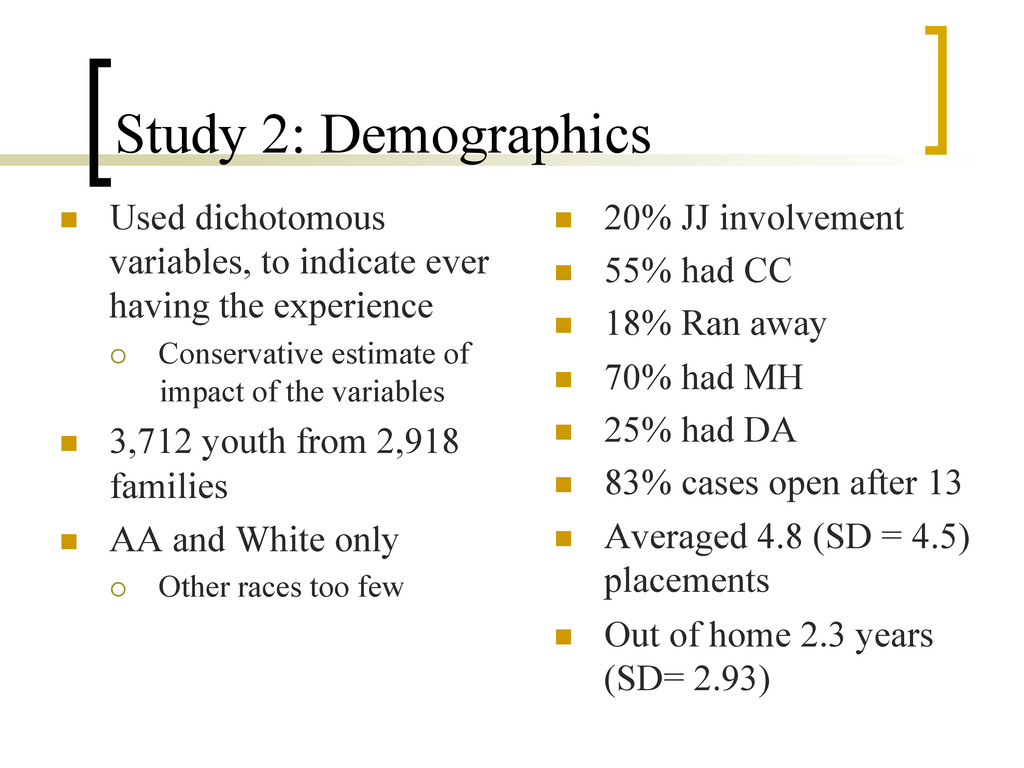
having the experience ¡ Conservative estimate of impact of the variables n 3,712 youth from 2,918 families n AA and White only ¡ Other races too few n 20% JJ involvement n 55% had CC n 18% Ran away n 70% had MH n 25% had DA n 83% cases open after 13 n Averaged 4.8 (SD = 4.5) placements n Out of home 2.3 years (SD= 2.93)
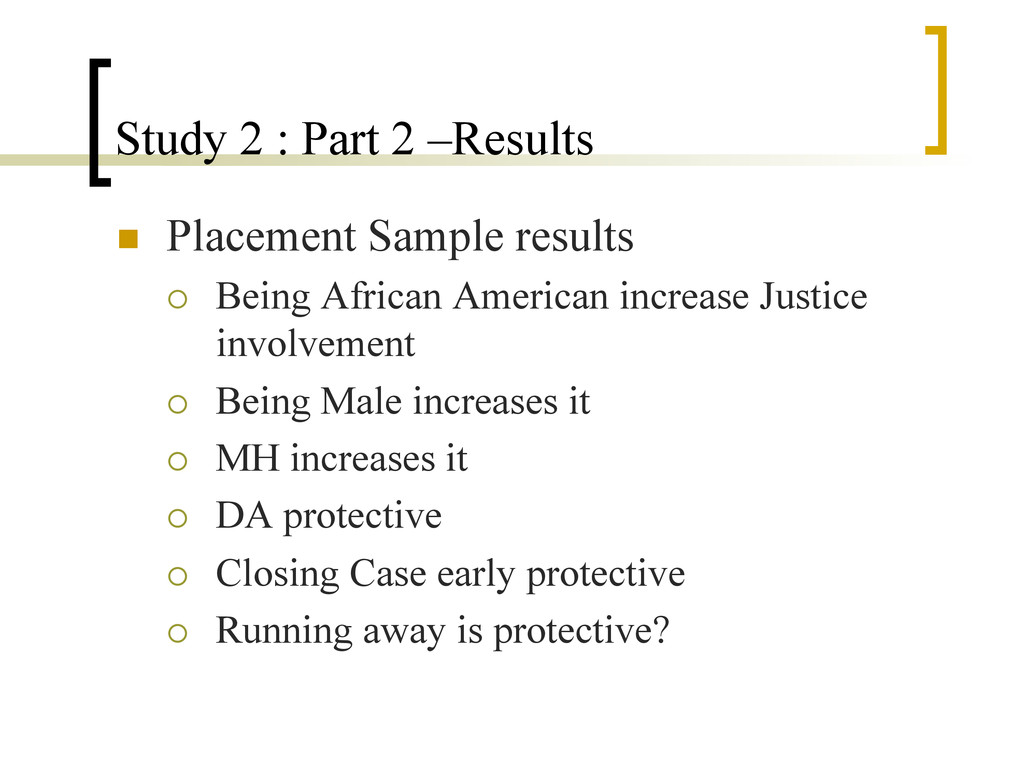
¡ Being African American increase Justice involvement ¡ Being Male increases it ¡ MH increases it ¡ DA protective ¡ Closing Case early protective ¡ Running away is protective?
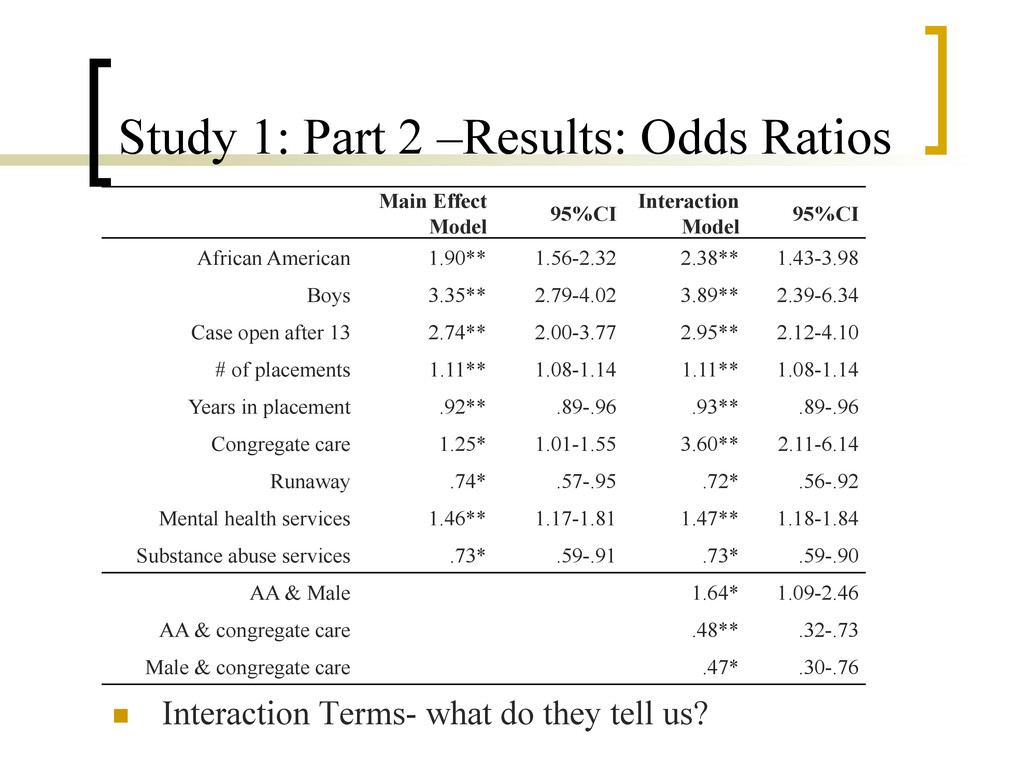
95%CI Interaction Model 95%CI African American 1.90** 1.56-2.32 2.38** 1.43-3.98 Boys 3.35** 2.79-4.02 3.89** 2.39-6.34 Case open after 13 2.74** 2.00-3.77 2.95** 2.12-4.10 # of placements 1.11** 1.08-1.14 1.11** 1.08-1.14 Years in placement .92** .89-.96 .93** .89-.96 Congregate care 1.25* 1.01-1.55 3.60** 2.11-6.14 Runaway .74* .57-.95 .72* .56-.92 Mental health services 1.46** 1.17-1.81 1.47** 1.18-1.84 Substance abuse services .73* .59-.91 .73* .59-.90 AA & Male 1.64* 1.09-2.46 AA & congregate care .48** .32-.73 Male & congregate care .47* .30-.76 n Interaction Terms- what do they tell us?
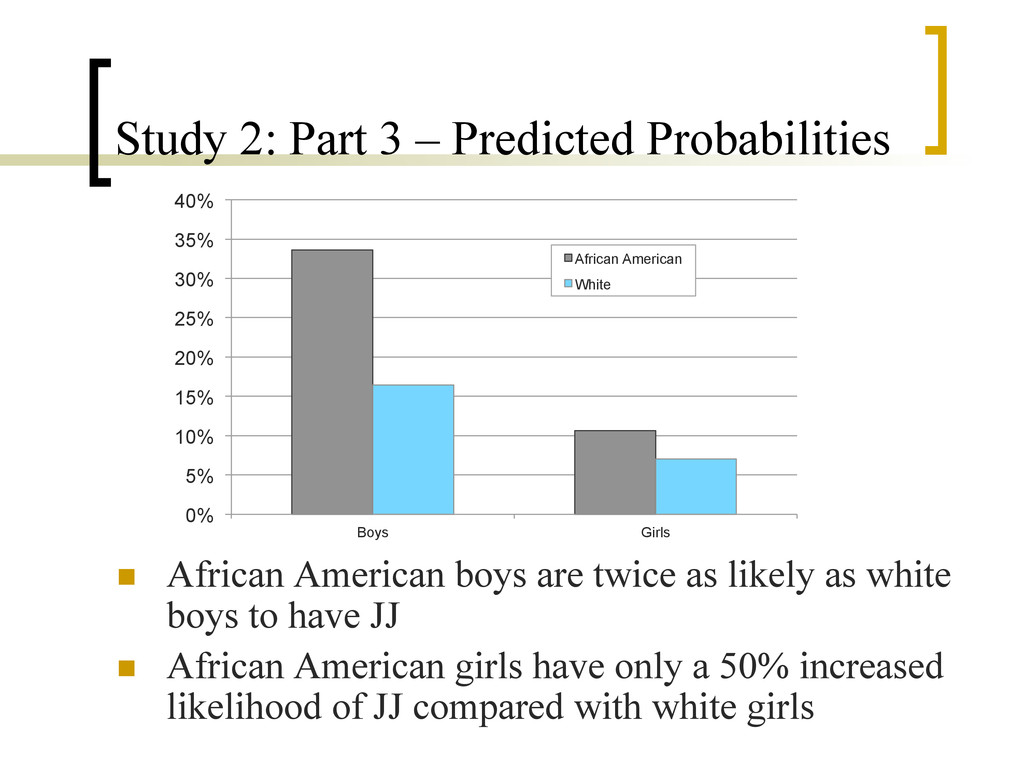
boys are twice as likely as white boys to have JJ n African American girls have only a 50% increased likelihood of JJ compared with white girls 0% 5% 10% 15% 20% 25% 30% 35% 40% Boys Girls African American White
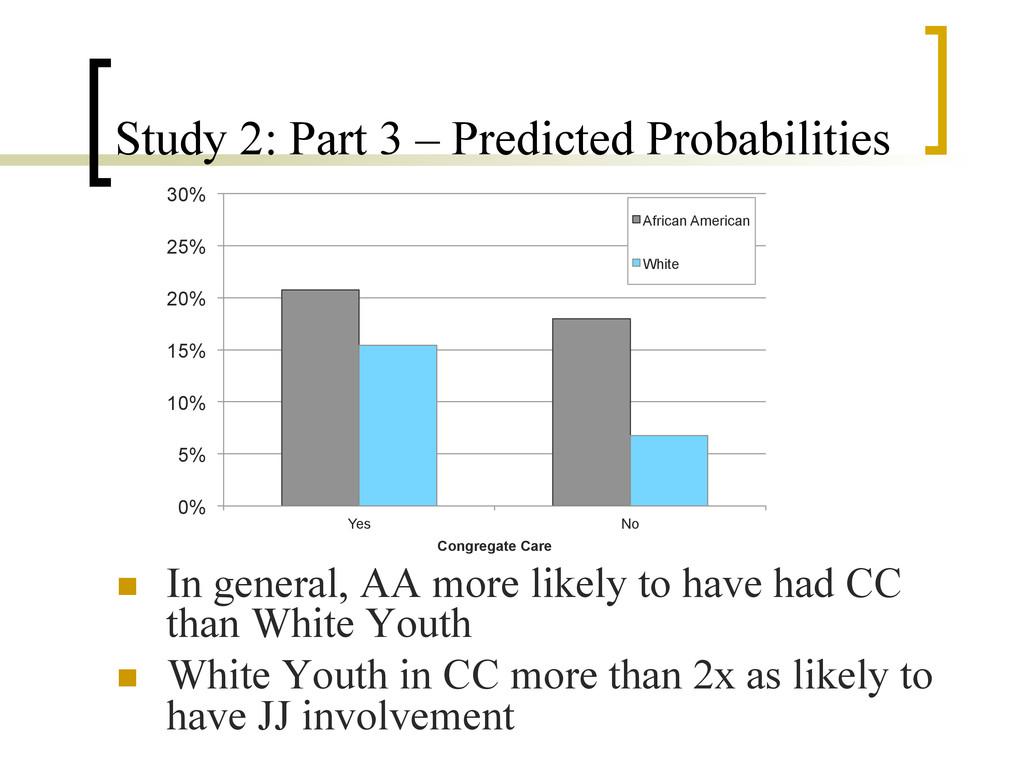
AA more likely to have had CC than White Youth n White Youth in CC more than 2x as likely to have JJ involvement 0% 5% 10% 15% 20% 25% 30% Yes No Congregate Care African American White
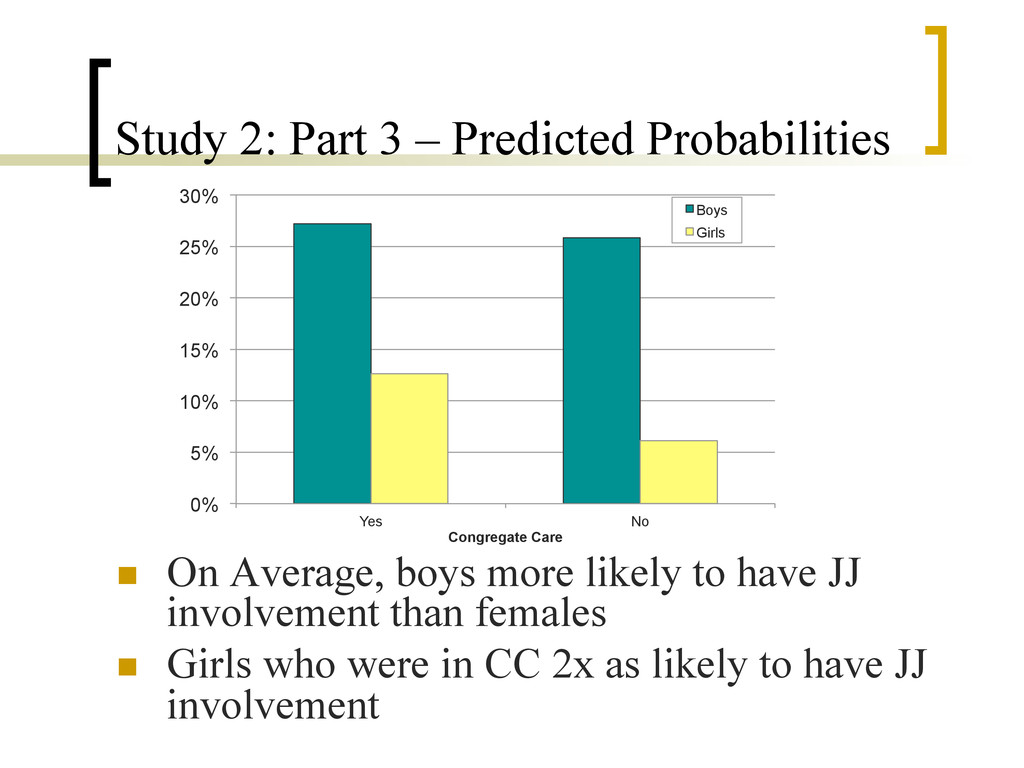
boys more likely to have JJ involvement than females n Girls who were in CC 2x as likely to have JJ involvement 0% 5% 10% 15% 20% 25% 30% Yes No Congregate Care Boys Girls