Upgrade to Pro — share decks privately, control downloads, hide ads and more …

The Magic of Charts - Data Visualisation in JavaScript

James Ford
November 24, 2015

The Magic of Charts - Data Visualisation in JavaScript

Data Visualisation in JavaScript - a run through of the libraries which I've used, what they do best, what they don't do so well, when you should use them and for what.

James Ford

November 24, 2015
Tweet

More Decks by James Ford

Other Decks in Programming

Transcript

  1. Why create a Chart? A picture tells a thousand words.

    Charts creates a picture from a thousand pieces of data, and you don’t need to know what story it will tell beforehand. “ ” James Ford - MMT Digital
  2. Options • Morris.js • Chart.js • D3.js / C3.js •

    Google Charts • Google Analytics Embed API • Raw Data (CSV) Export
  3. Chart.js http://www.chartjs.org/ • 6 Chart types • Gentle learning curve

    • Visual options, interactivity, scripting hooks and built-in animations
  4. D3.js http://d3js.org/ • ∞ Chart types • Harsh learning curve

    • Complete creative freedom, lots of classes and methods for data manipulation, layout, interaction etc.
  5. C3.js http://c3js.org/ • 15 Chart types • Low learning curve

    • Plenty of config options, built-in animations and chart-to-chart transformations
  6. Google Charts https://google-developers.appspot.com/chart/ • 18+ Chart types • Medium learning

    curve • Lots of standard chart customisation options, some components available with Polymer
  7. GA Embed API https://ga-dev-tools.appspot.com/embed-api/ • 5 Chart types • Medium

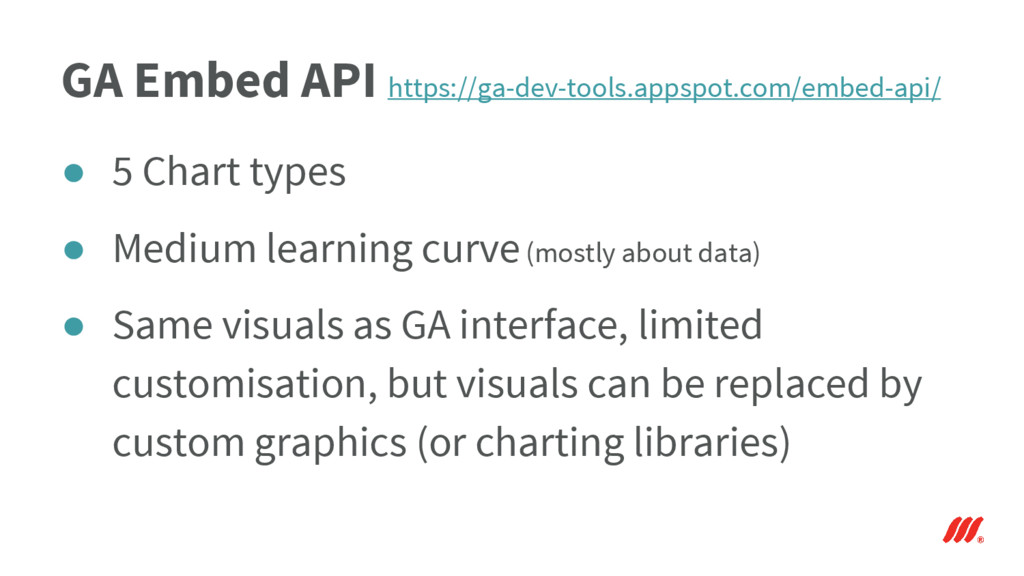
    learning curve (mostly about data) • Same visuals as GA interface, limited customisation, but visuals can be replaced by custom graphics (or charting libraries)