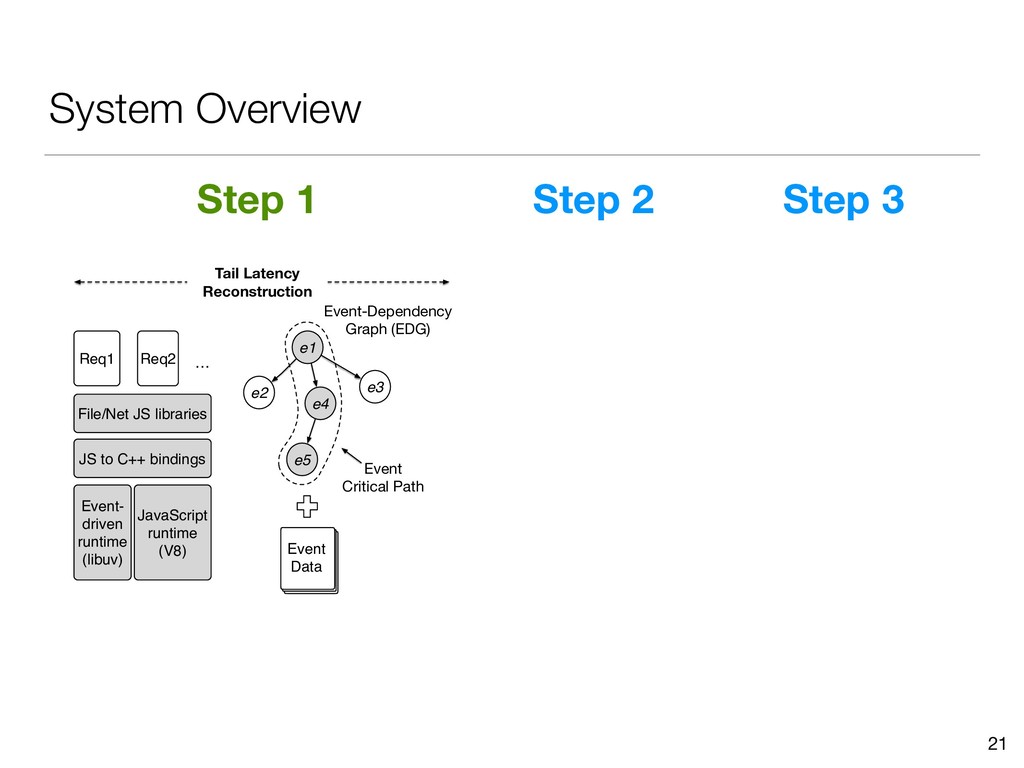
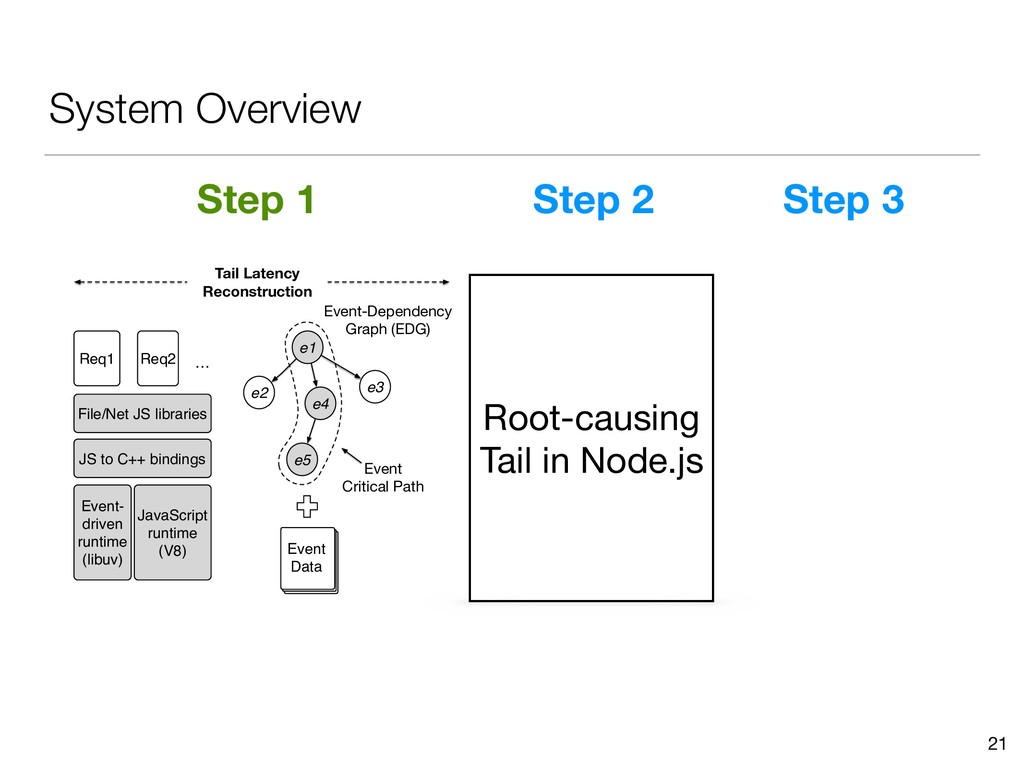
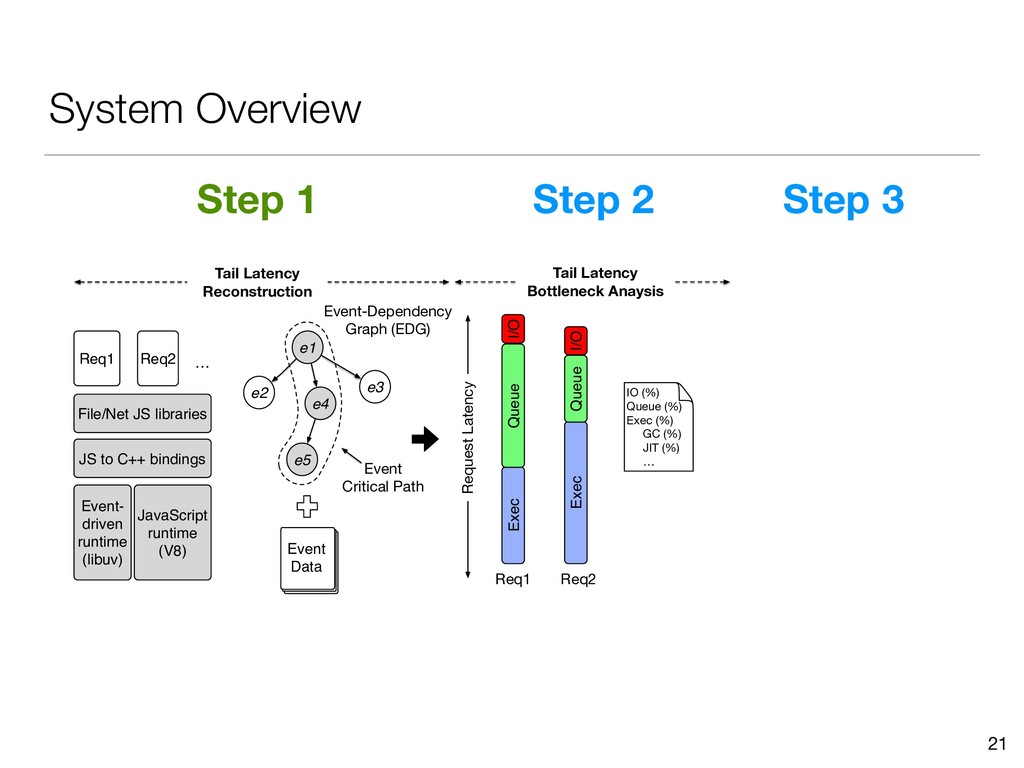
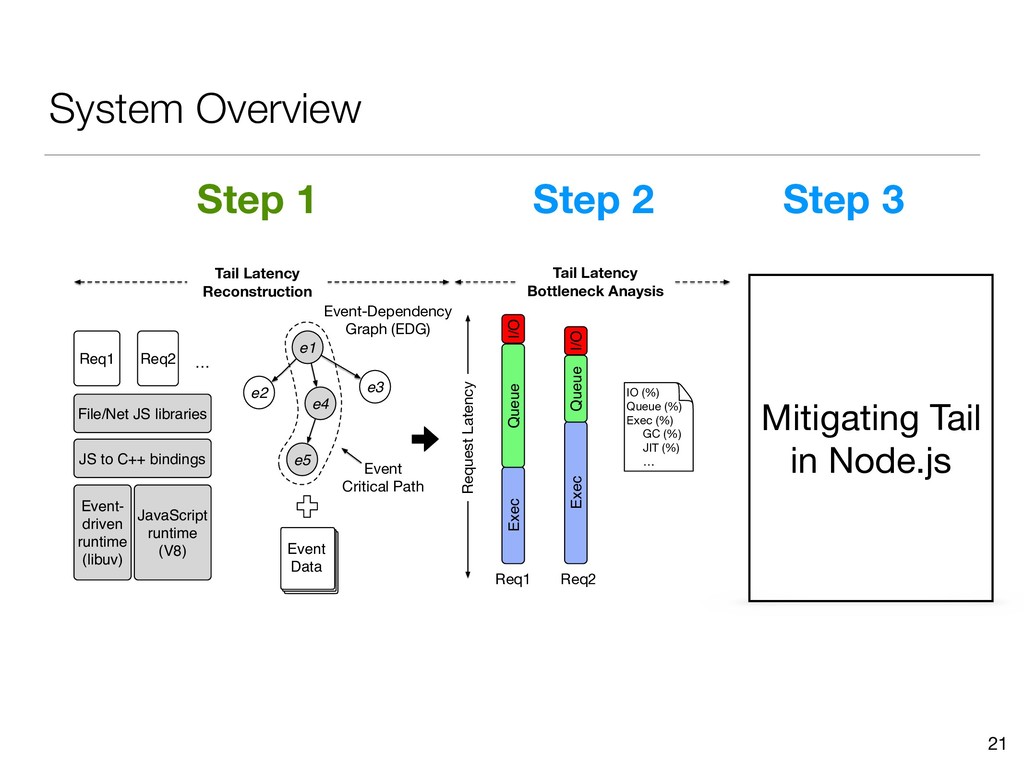
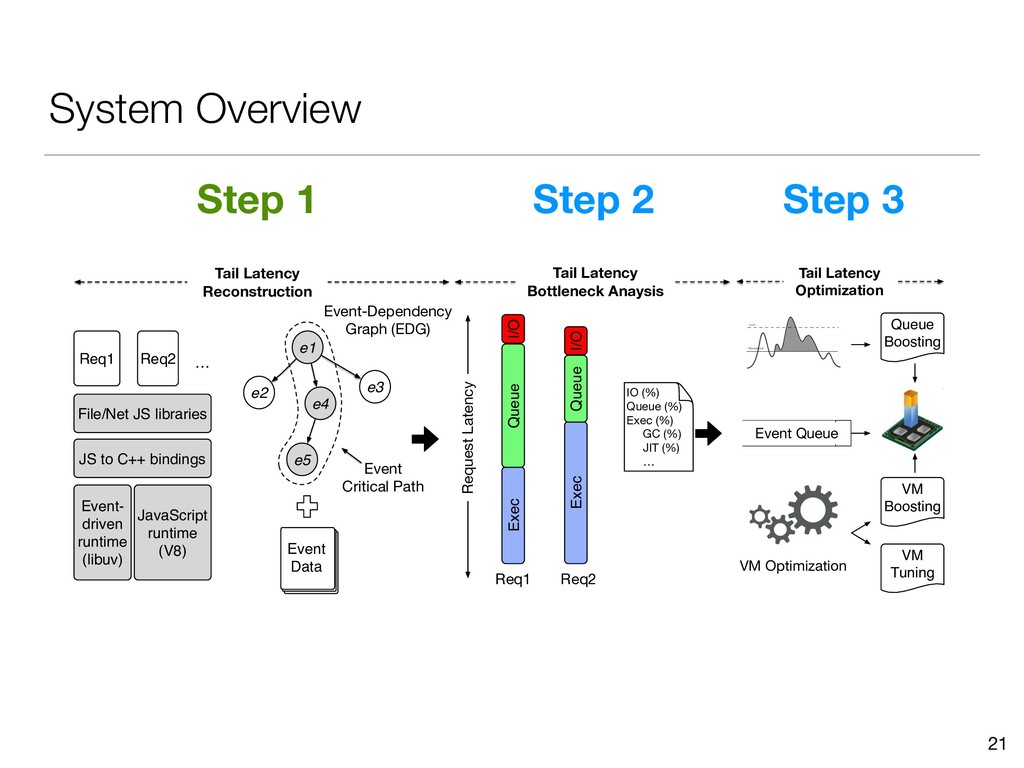
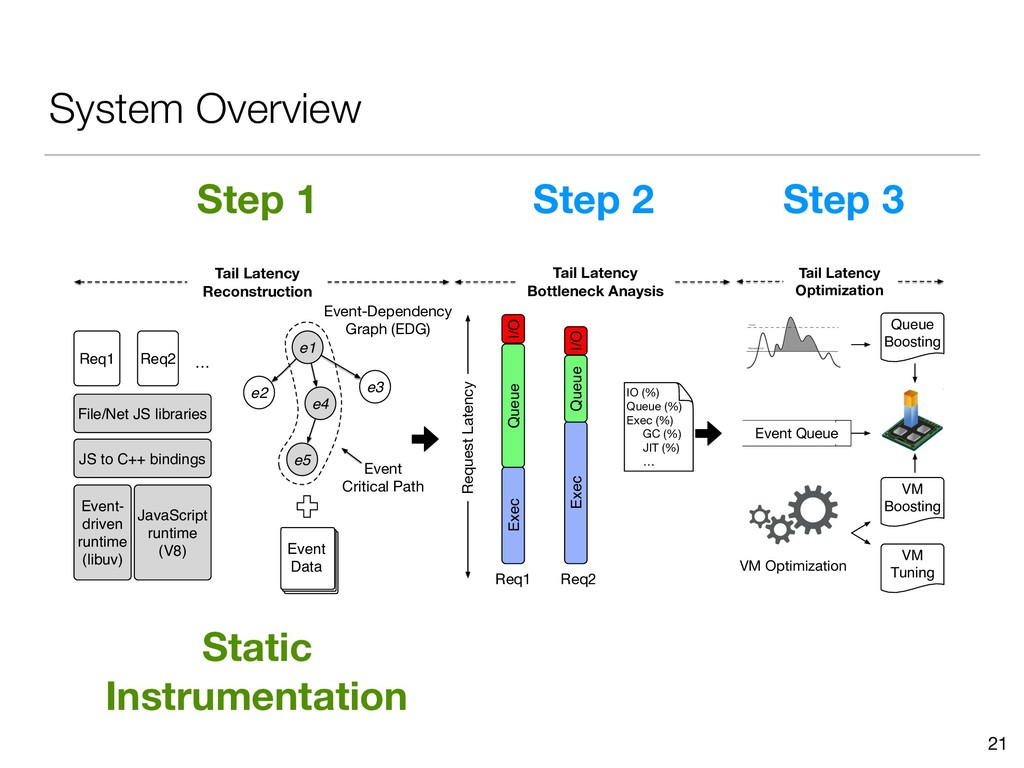
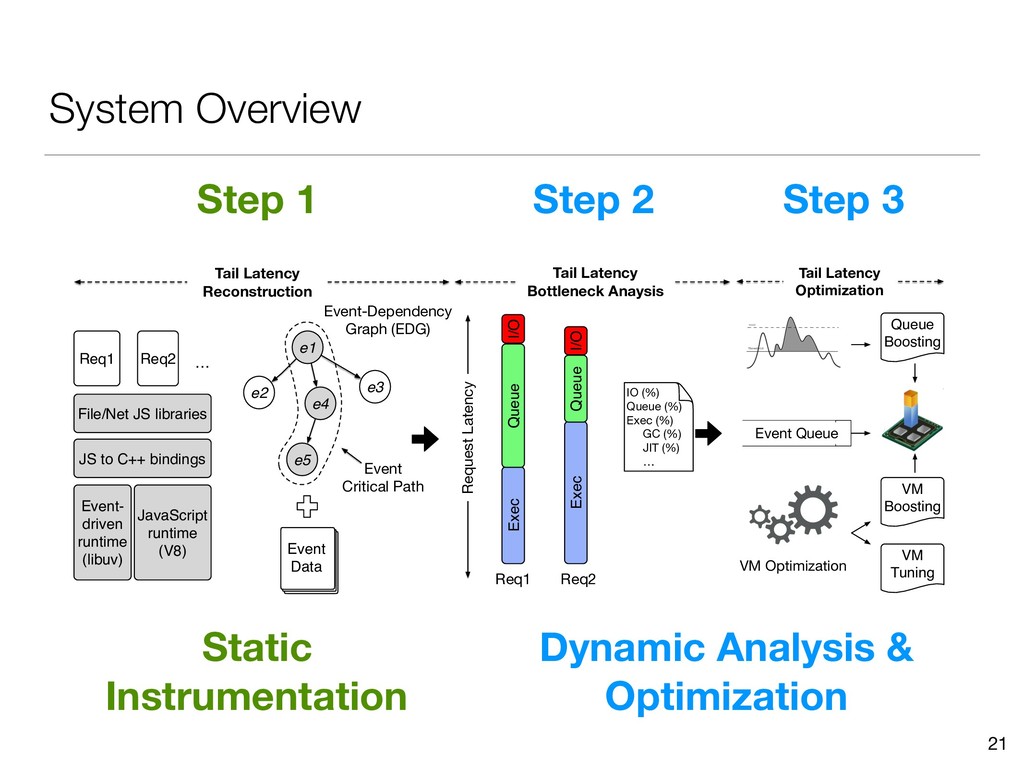
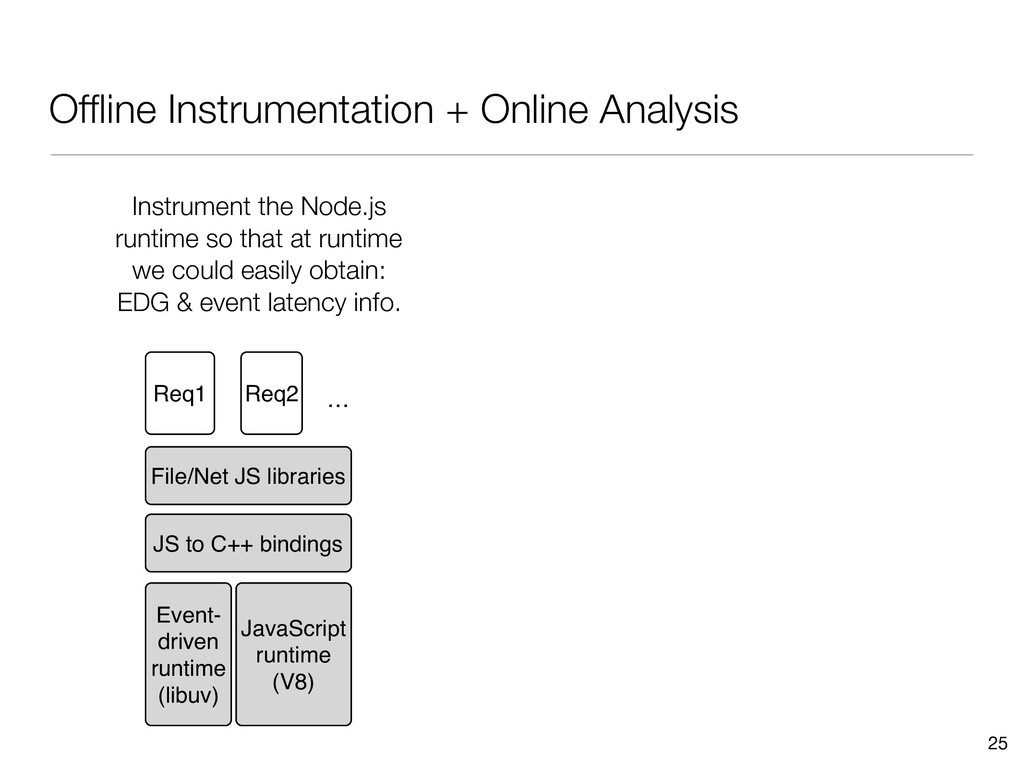
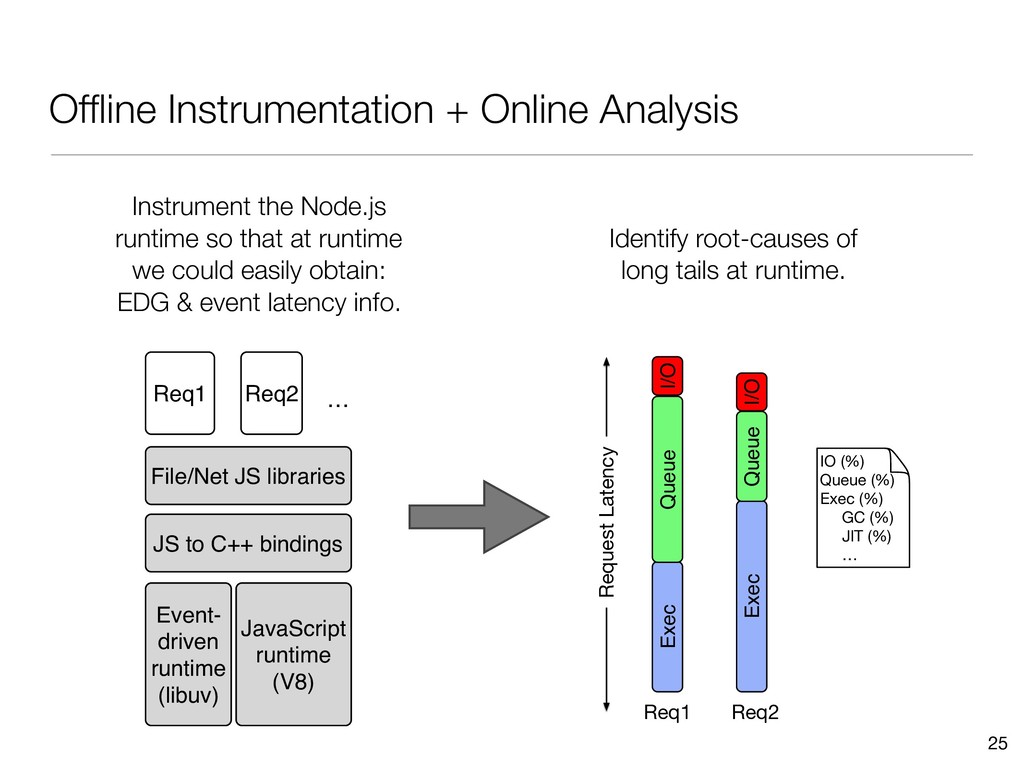
JS to C++ bindings Req1 Req2 … JavaScript runtime (V8) File/Net JS libraries Instrument the Node.js runtime so that at runtime we could easily obtain: EDG & event latency info.
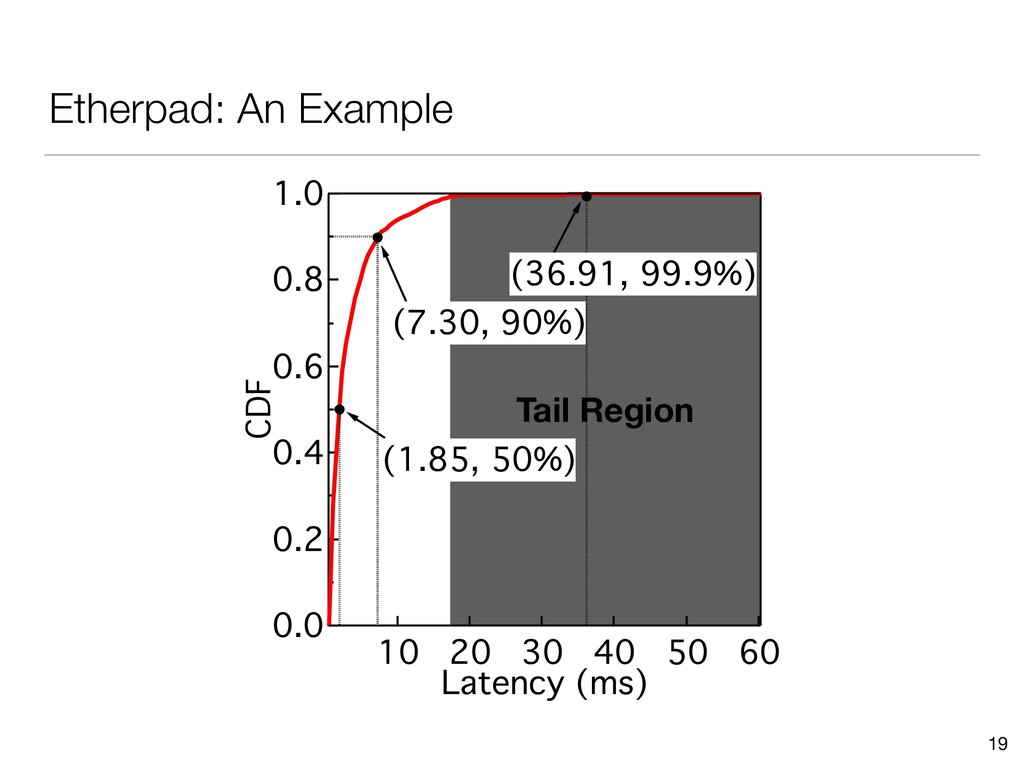
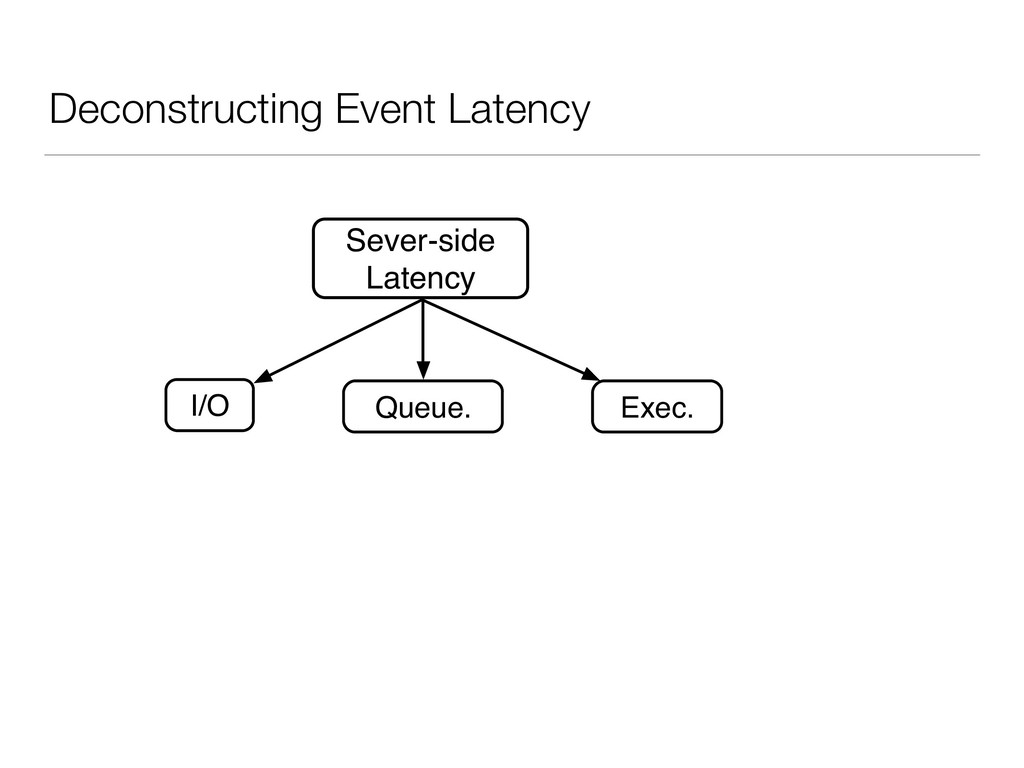
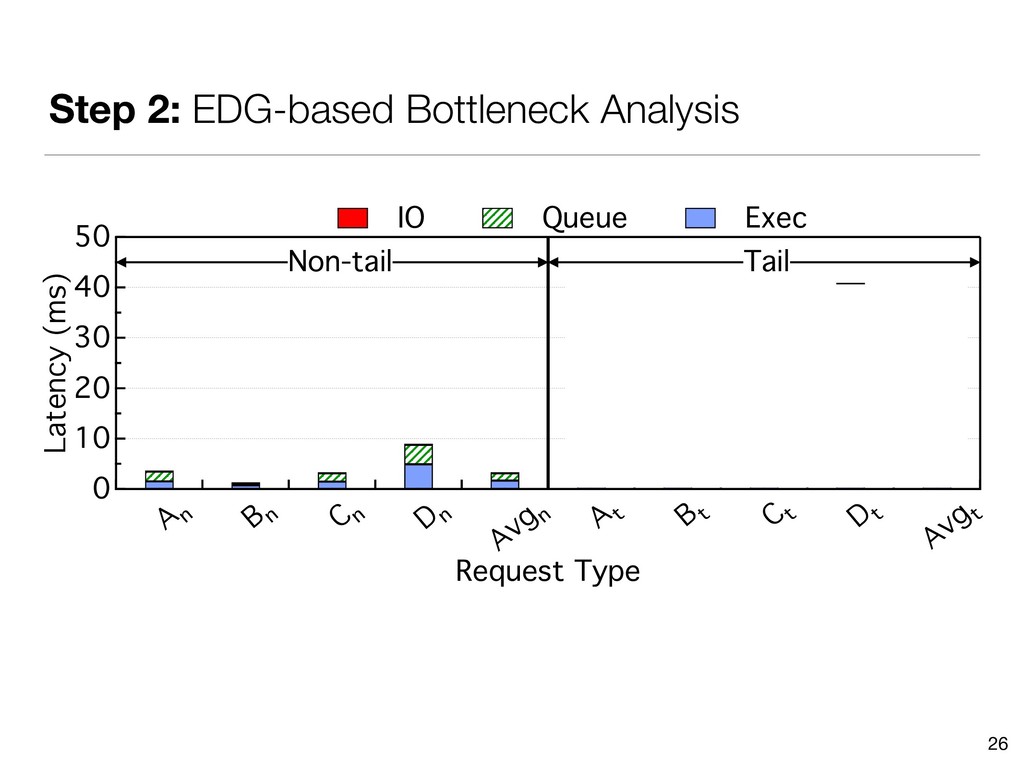
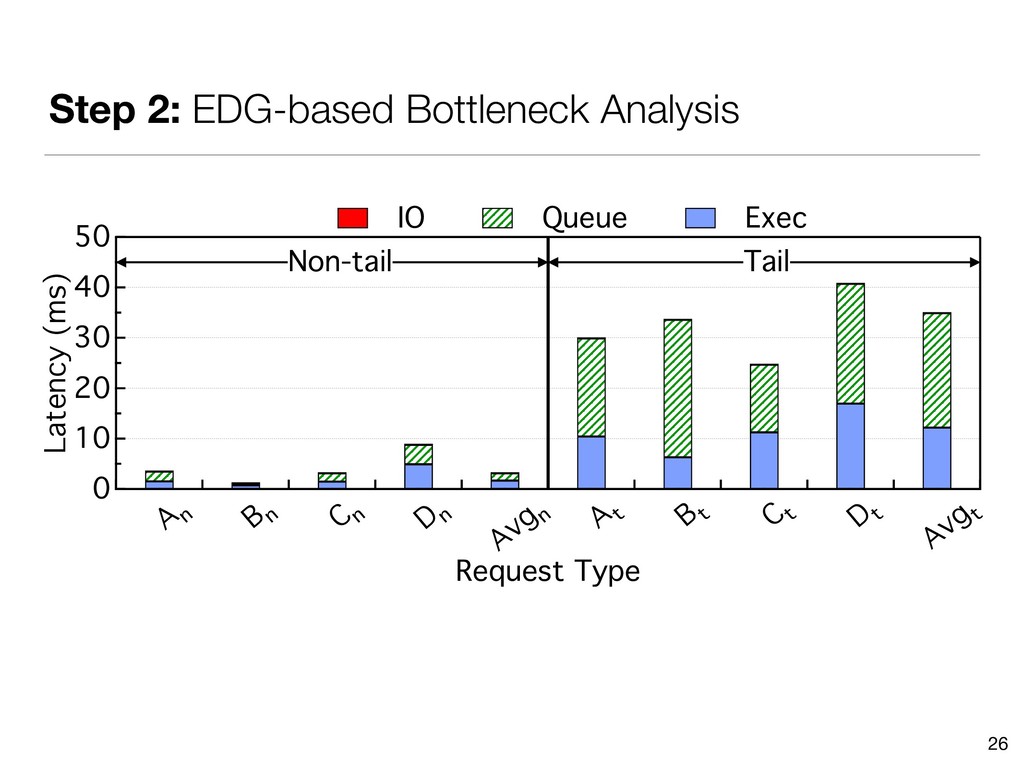
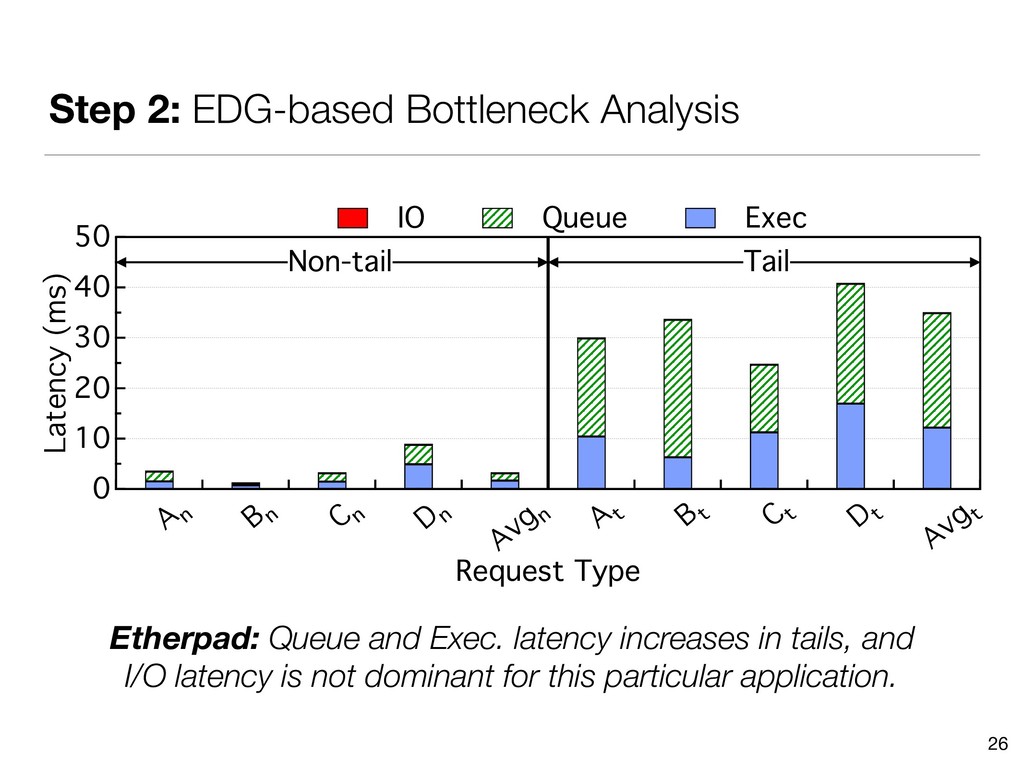
10 0 Latency (ms) A n B n C n D n Avg n A t B t C t D t Avg t Request Type IO Queue Exec Tail Non-tail Etherpad: Queue and Exec. latency increases in tails, and I/O latency is not dominant for this particular application.
(ms) V n W n X n Avg n V t W t X t Avg t Request Type IO Queue Exec Tail Non-tail Client Manager: Queue and Exec. latency dominate in tails, but unlike Etherpad I/O plays a notable role in the requests.
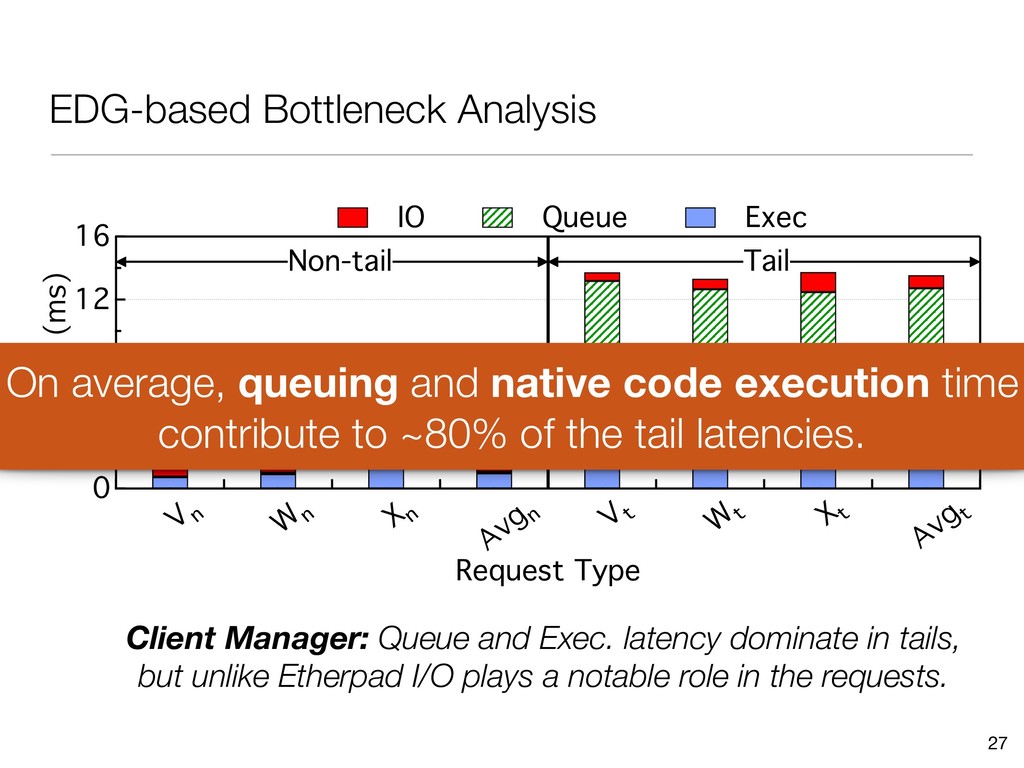
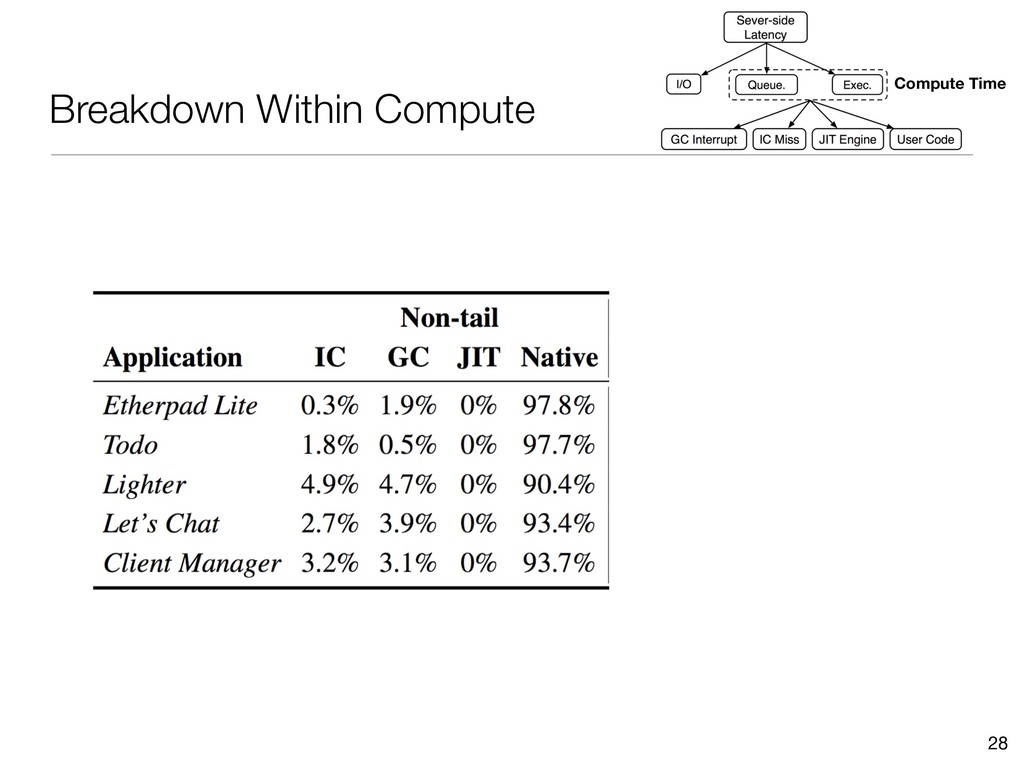
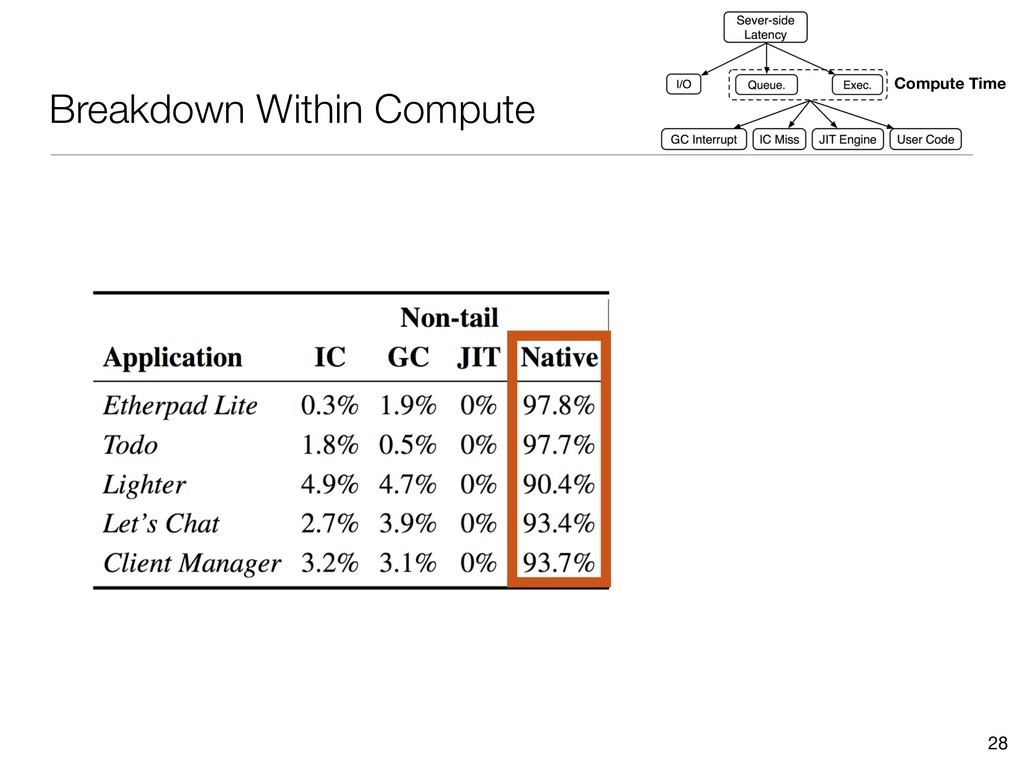
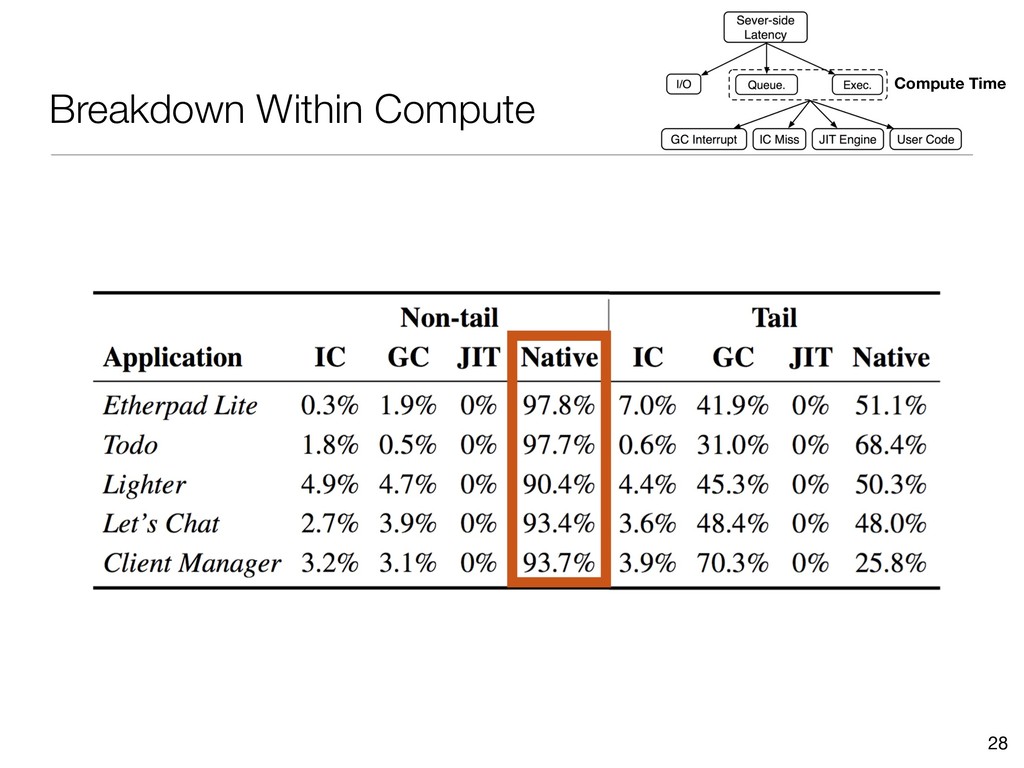
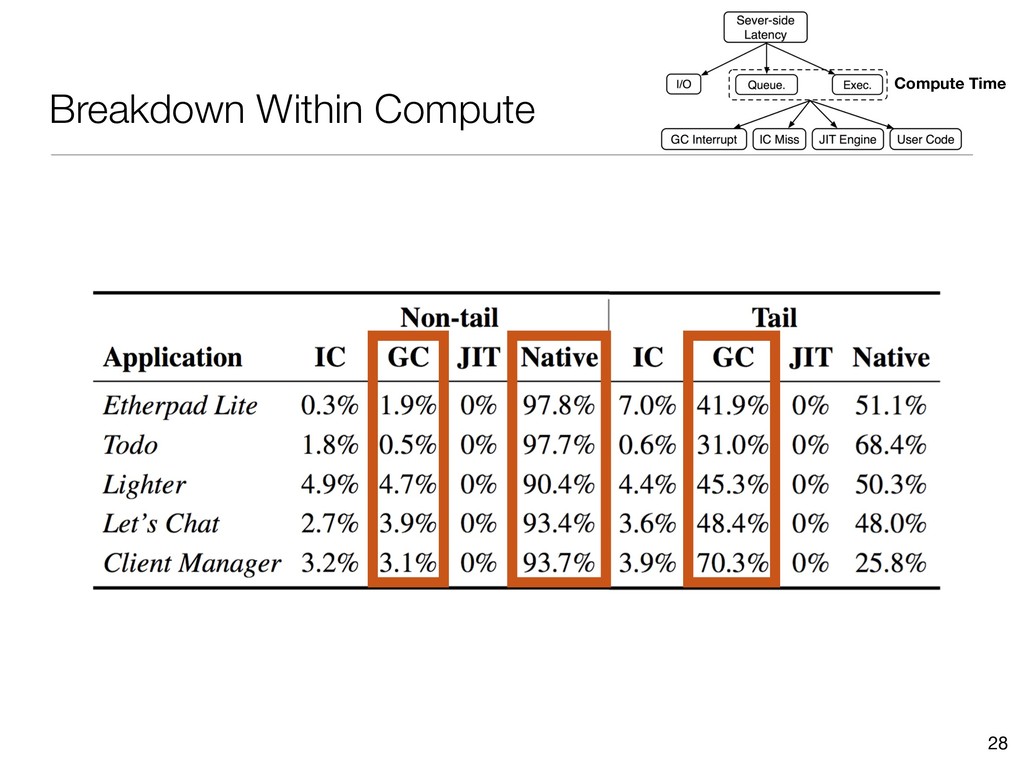
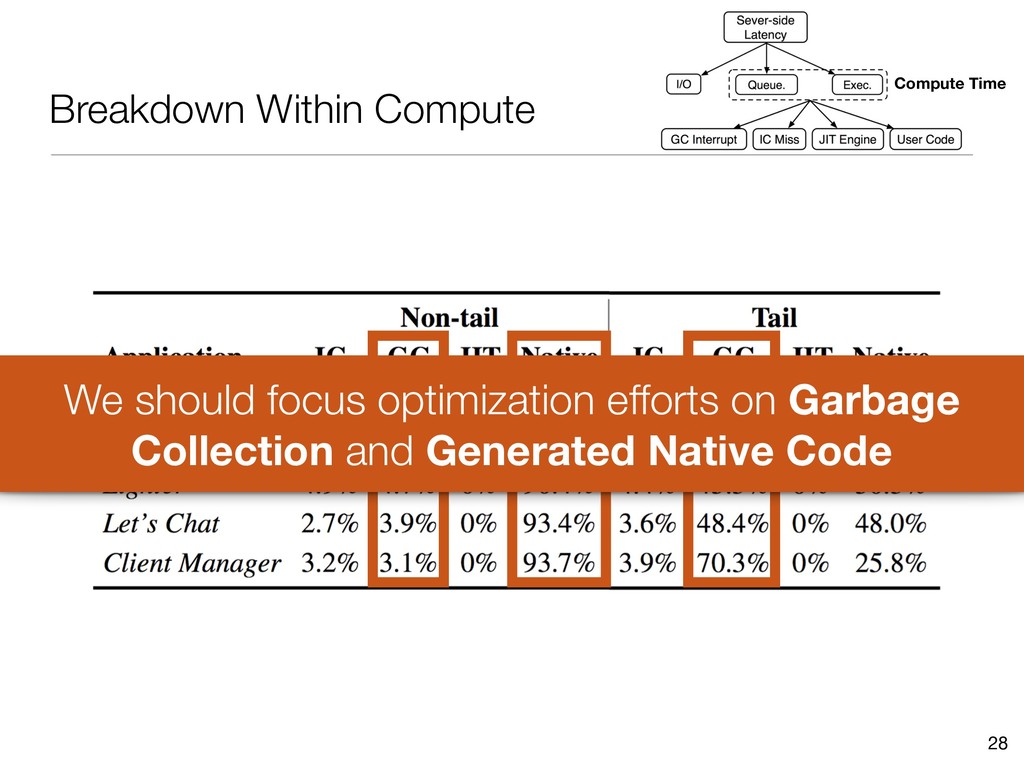
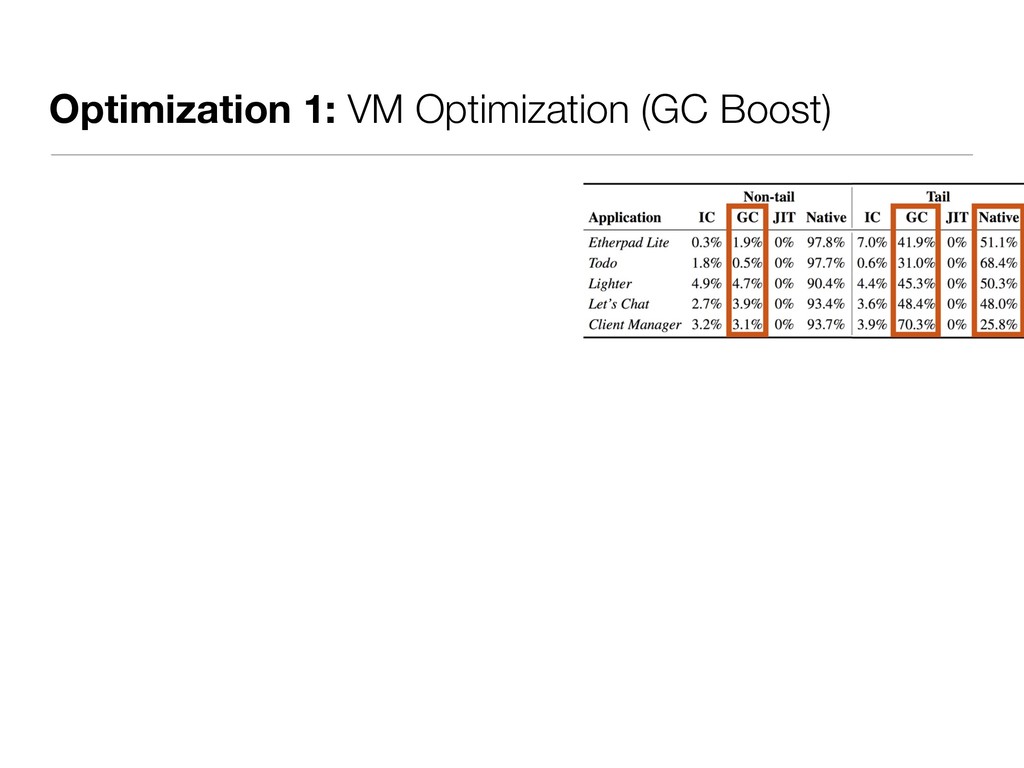
(ms) V n W n X n Avg n V t W t X t Avg t Request Type IO Queue Exec Tail Non-tail Client Manager: Queue and Exec. latency dominate in tails, but unlike Etherpad I/O plays a notable role in the requests. On average, queuing and native code execution time contribute to ~80% of the tail latencies.
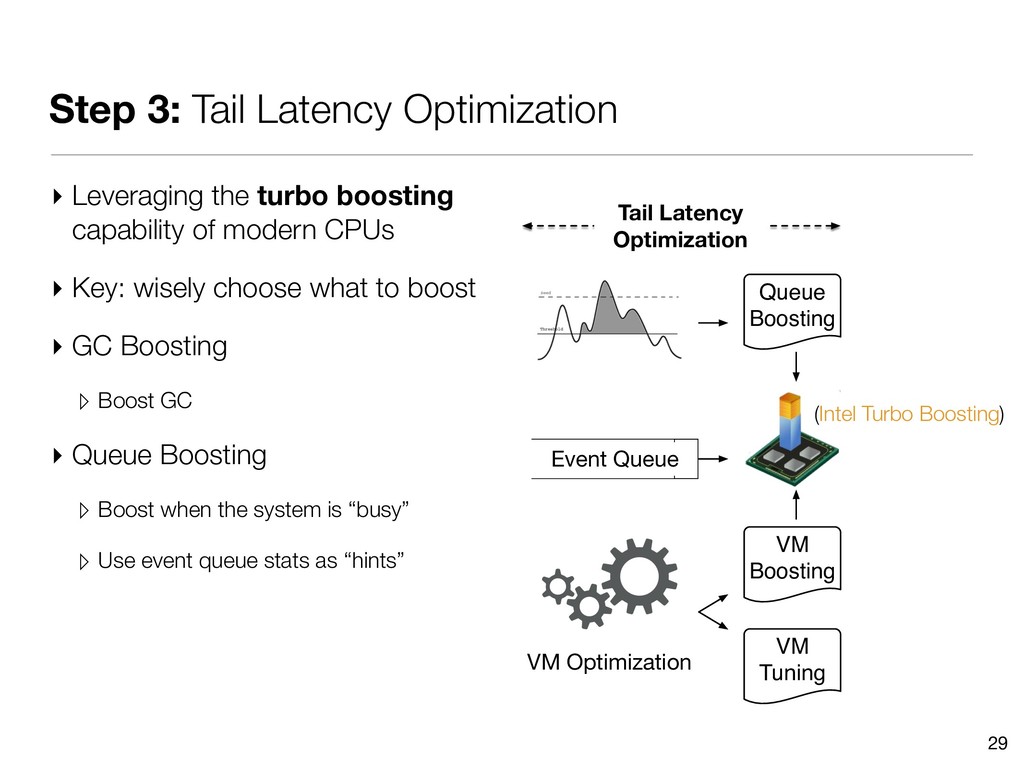
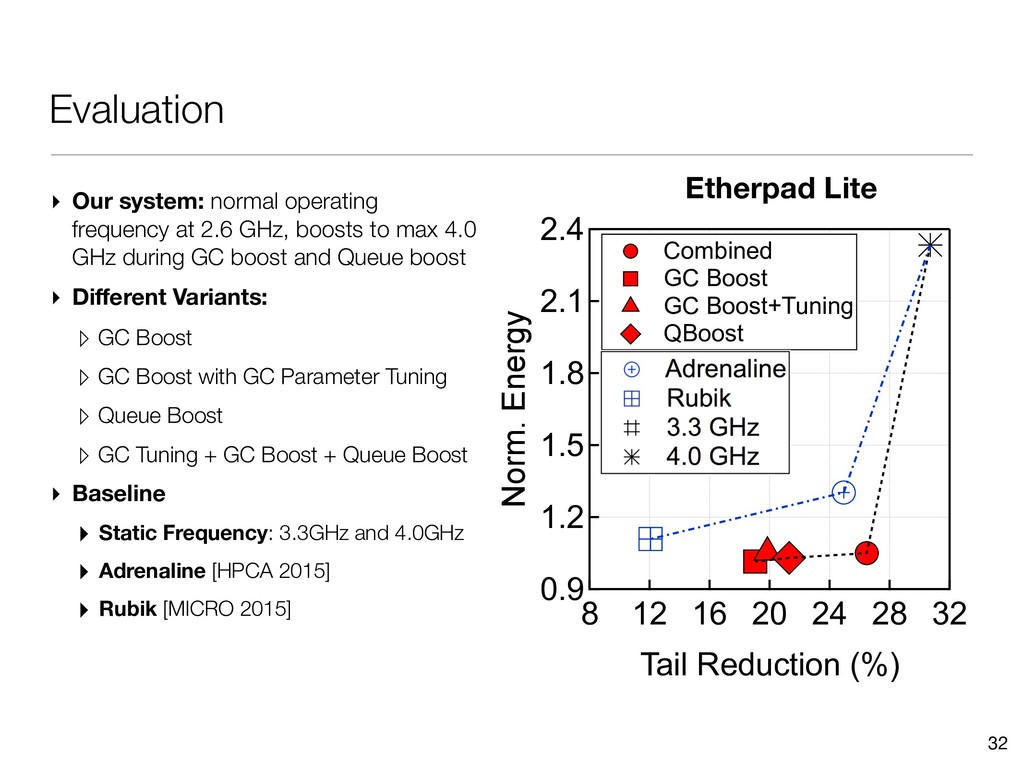
capability of modern CPUs ▸ Key: wisely choose what to boost ▸ GC Boosting ▹ Boost GC ▸ Queue Boosting ▹ Boost when the system is “busy” ▹ Use event queue stats as “hints” 29 Tail Latency Optimization Queue Boosting VM Boosting VM Optimization VM Tuning Event Queue (Intel Turbo Boosting)
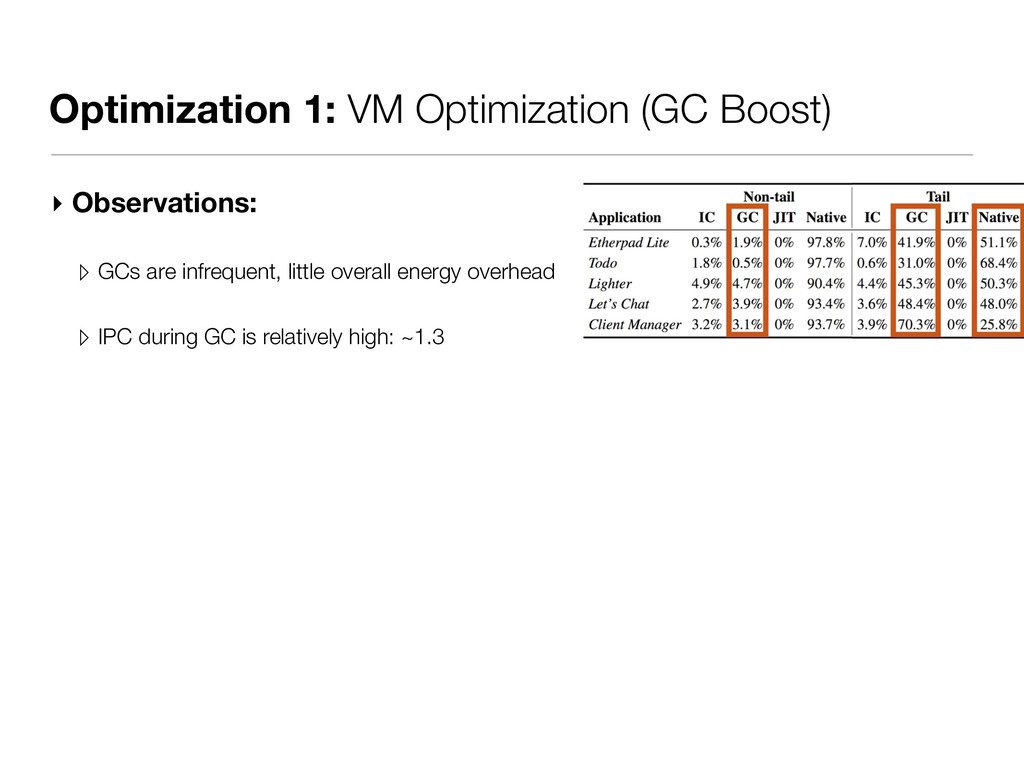
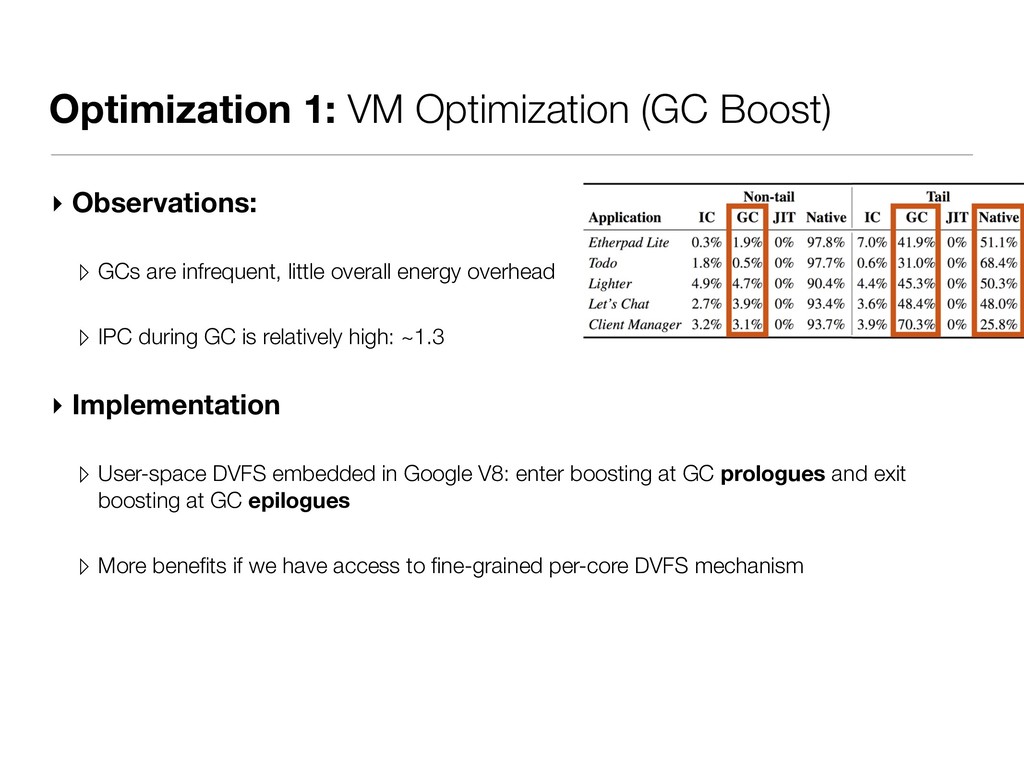
are infrequent, little overall energy overhead ▹ IPC during GC is relatively high: ~1.3 ▸ Implementation ▹ User-space DVFS embedded in Google V8: enter boosting at GC prologues and exit boosting at GC epilogues ▹ More benefits if we have access to fine-grained per-core DVFS mechanism
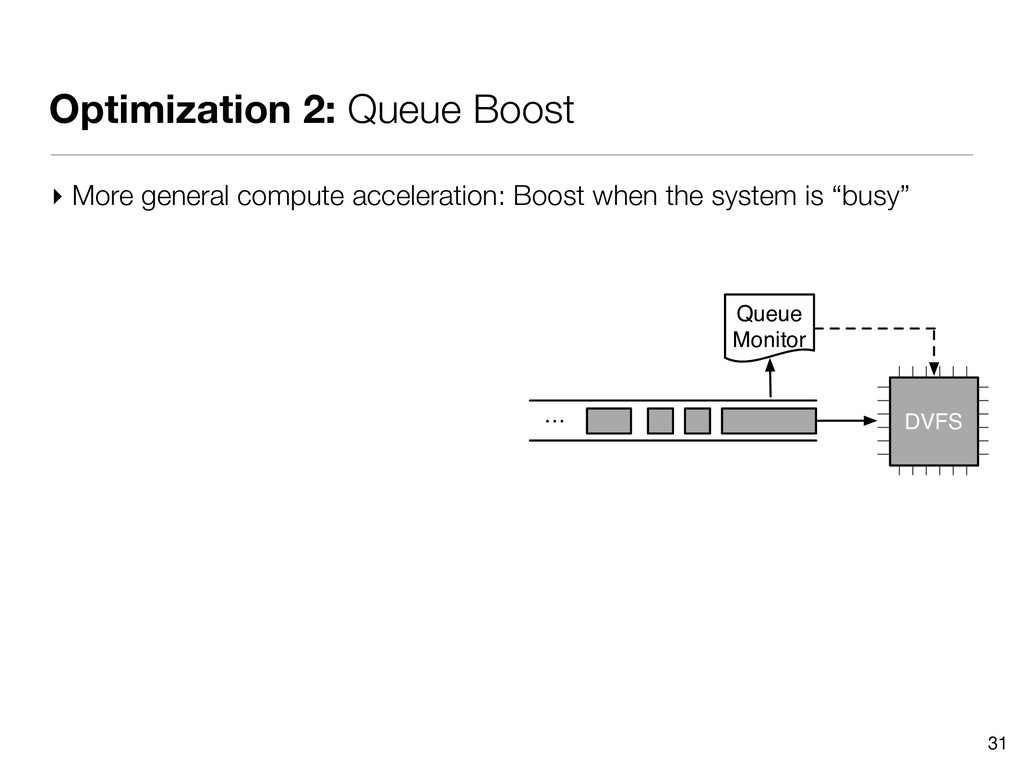
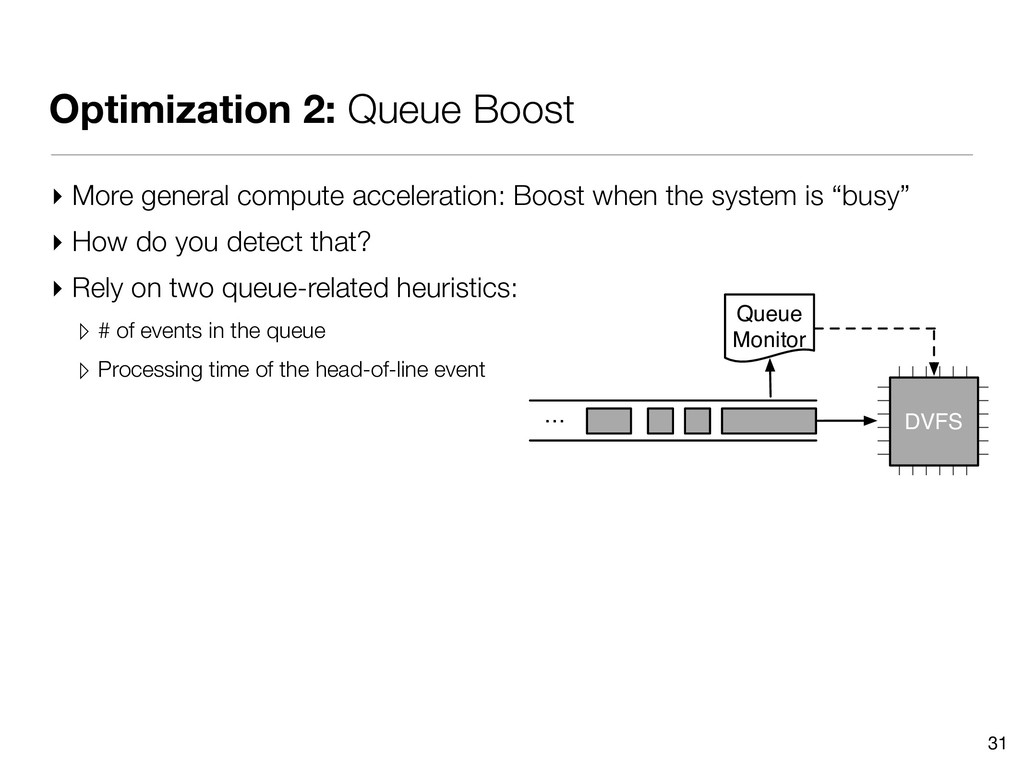
Boost when the system is “busy” ▸ How do you detect that? ▸ Rely on two queue-related heuristics: ▹ # of events in the queue ▹ Processing time of the head-of-line event … Queue Monitor DVFS
Boost when the system is “busy” ▸ How do you detect that? ▸ Rely on two queue-related heuristics: ▹ # of events in the queue ▹ Processing time of the head-of-line event … Queue Monitor DVFS ▸ Implementation: ▸ Periodic Sampling: Every 1 ms ▸ Dynamic Thresholding ▹ Sample the average value of event number and per event processing time ▹ Amplify the average value to decide a dynamic threshold by 2-3x
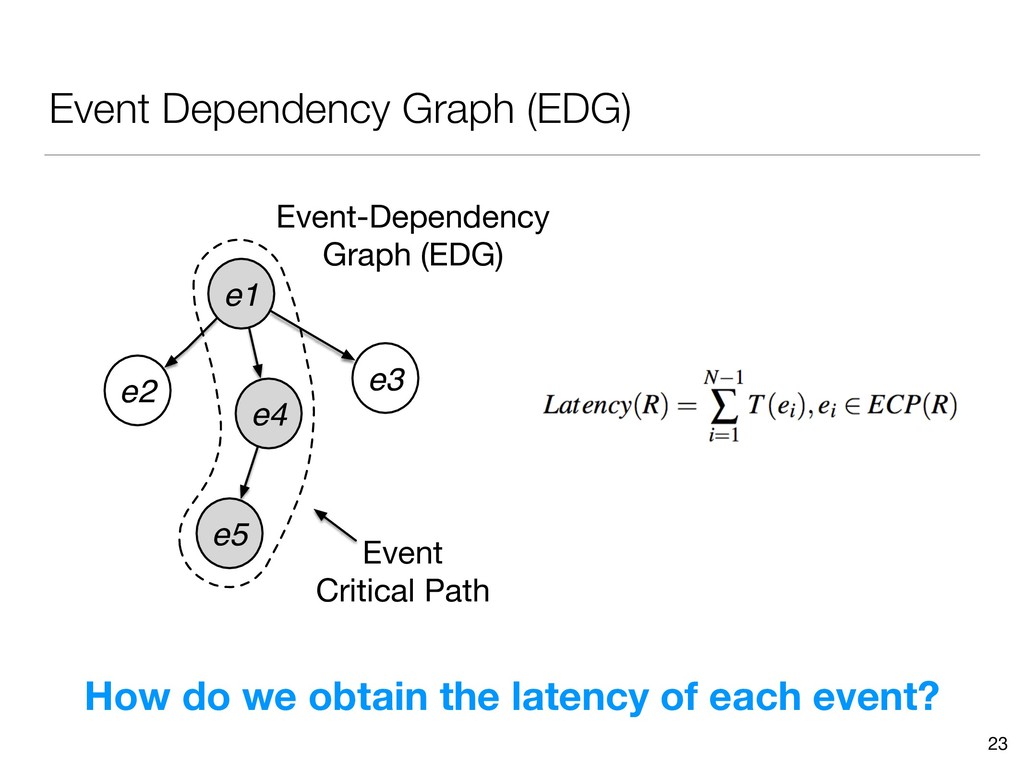
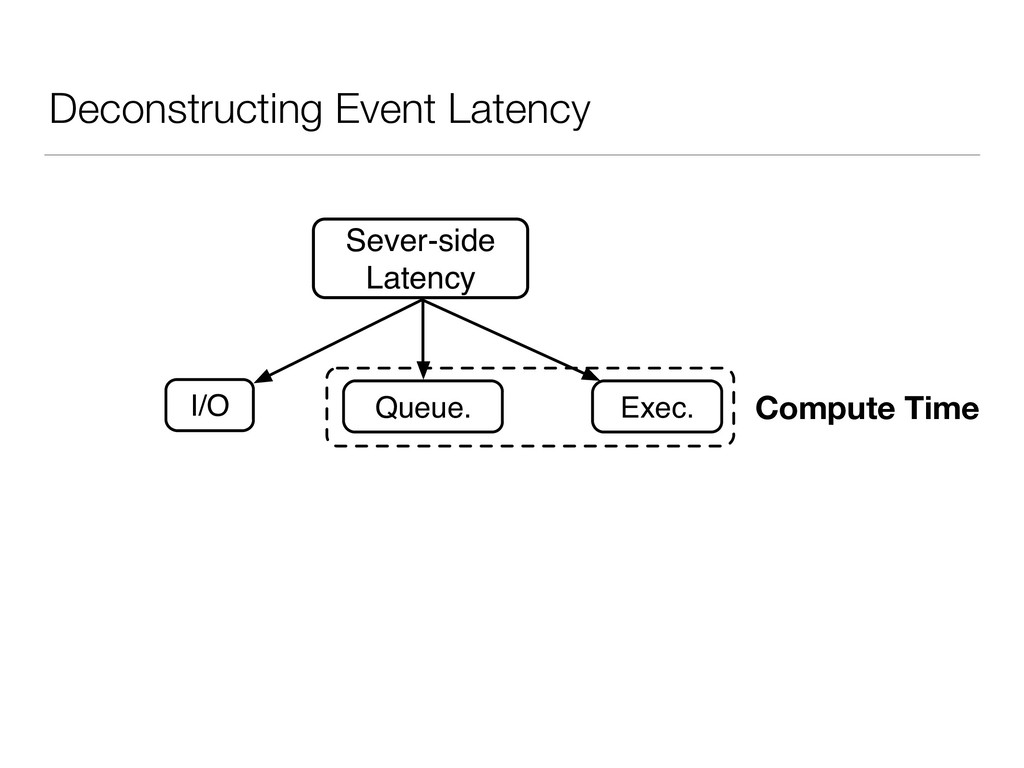
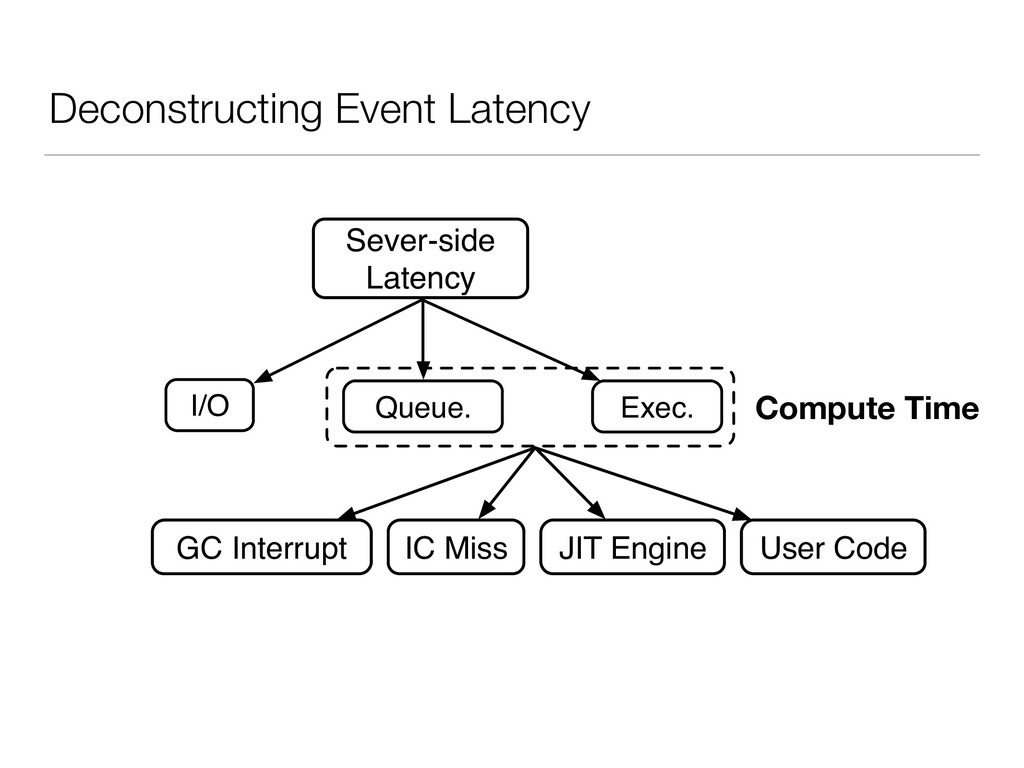
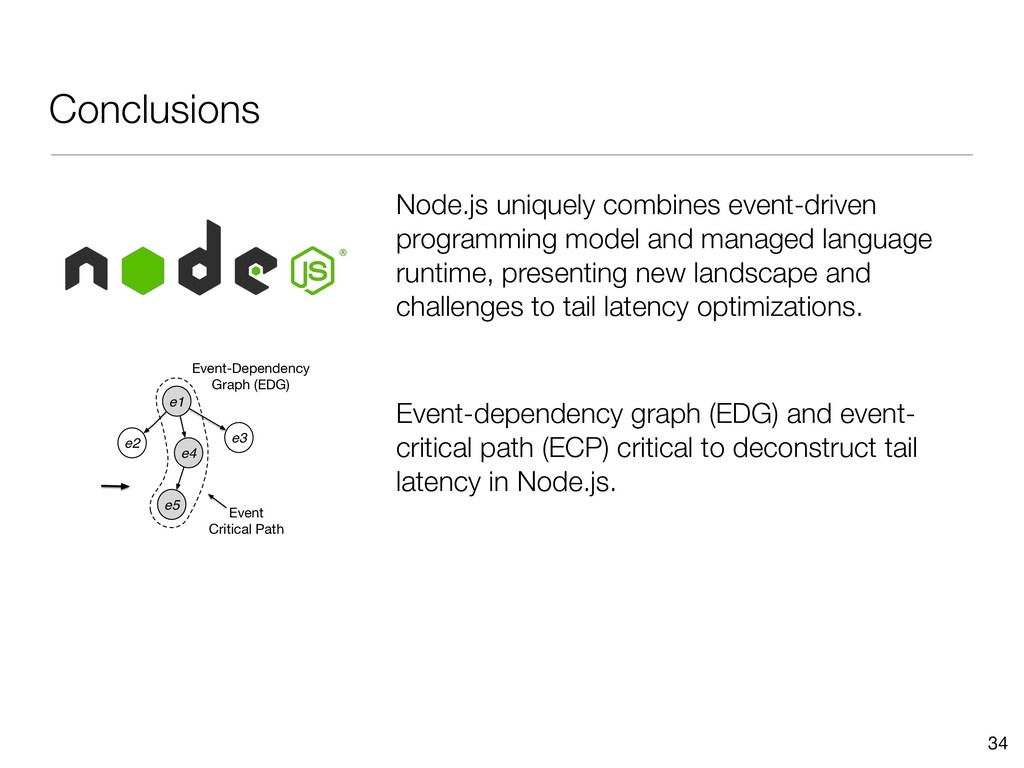
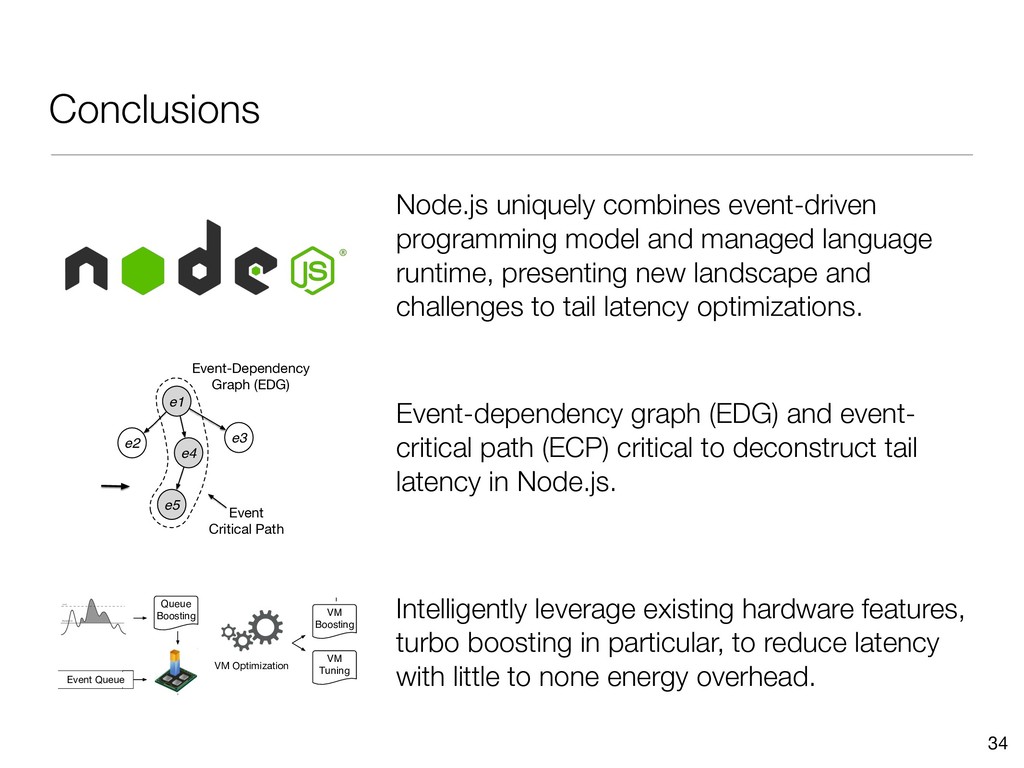
runtime, presenting new landscape and challenges to tail latency optimizations. 34 e1 e5 e3 e4 e2 Event Critical Path Event-Dependency Graph (EDG) Event-dependency graph (EDG) and event- critical path (ECP) critical to deconstruct tail latency in Node.js. Tail Latency Optimization Queue Boosting VM Boosting VM Event Queue Tail Latency Optimization Queue Boosting VM Boosting VM Optimization VM Tuning Event Queue Intelligently leverage existing hardware features, turbo boosting in particular, to reduce latency with little to none energy overhead.
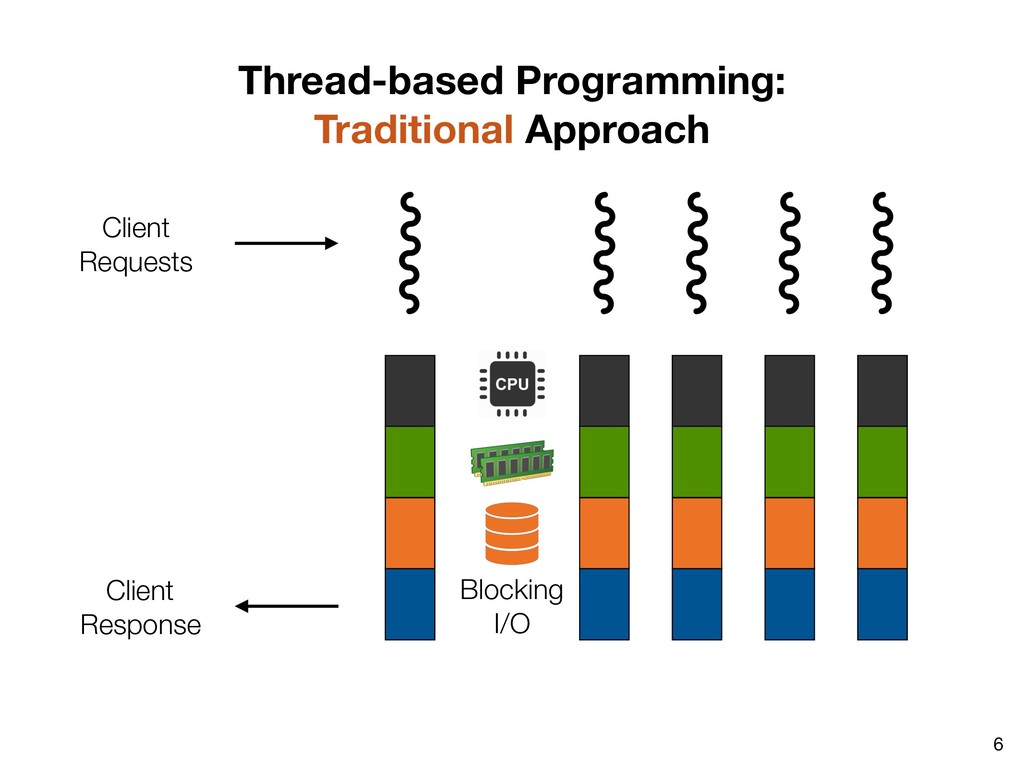
![7 Thread-based Programming [Welsh et al. ’00]](https://files.speakerdeck.com/presentations/9c3de237cd08416b86d0599992ed7e7d/slide_10.jpg)
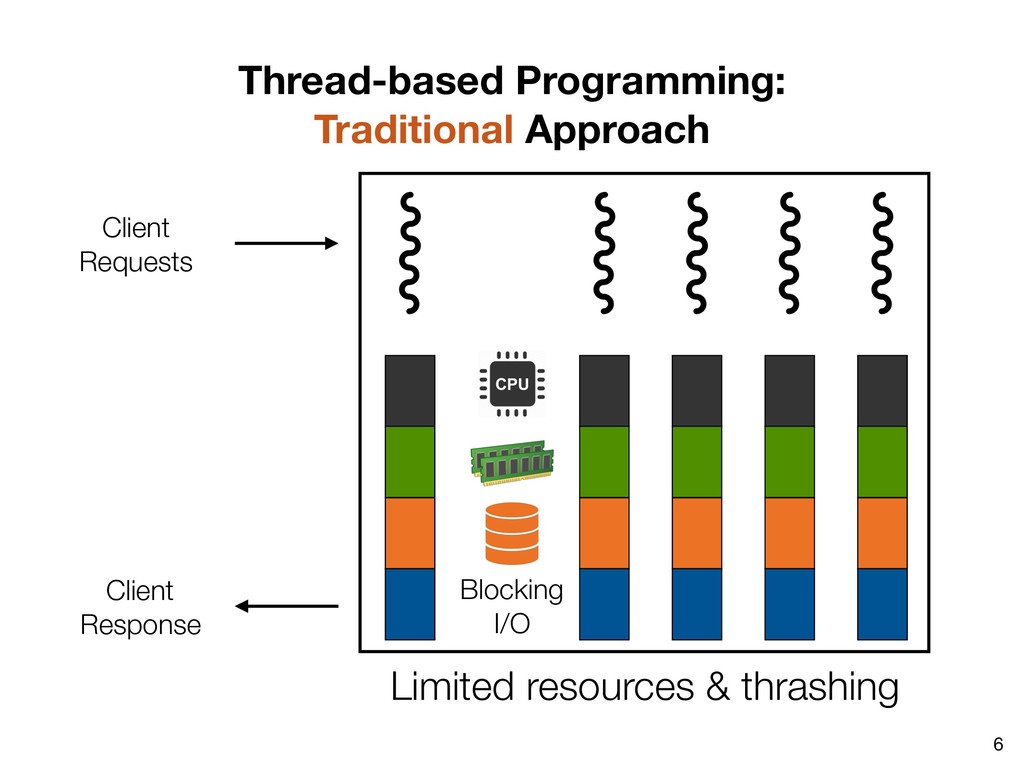
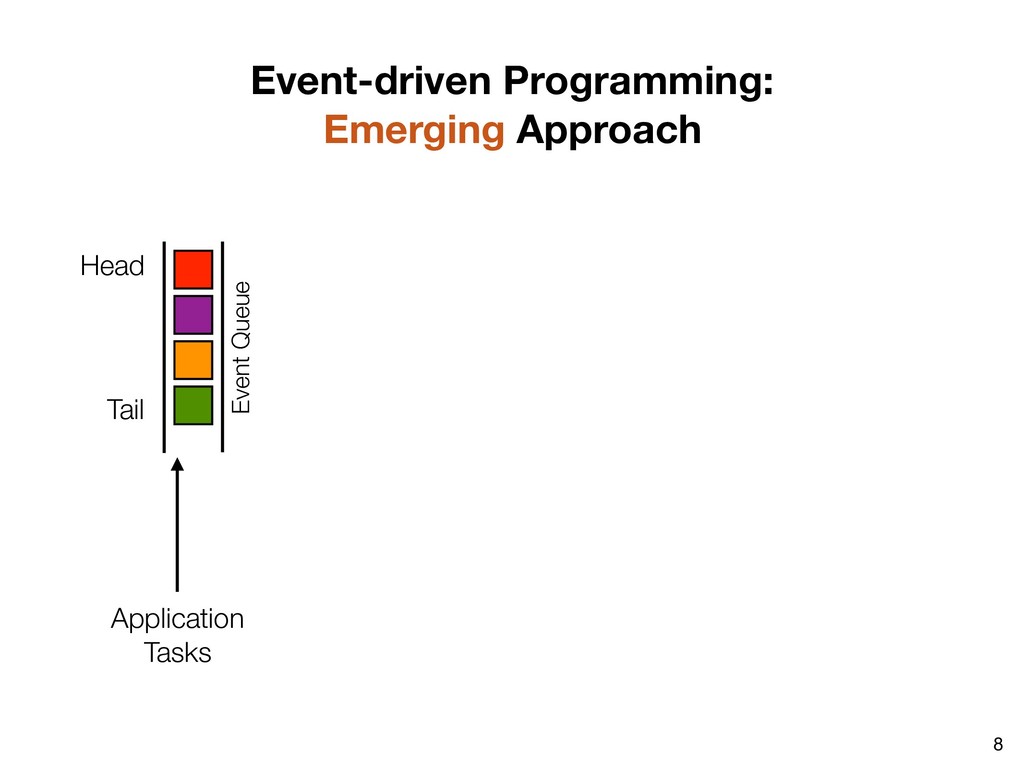
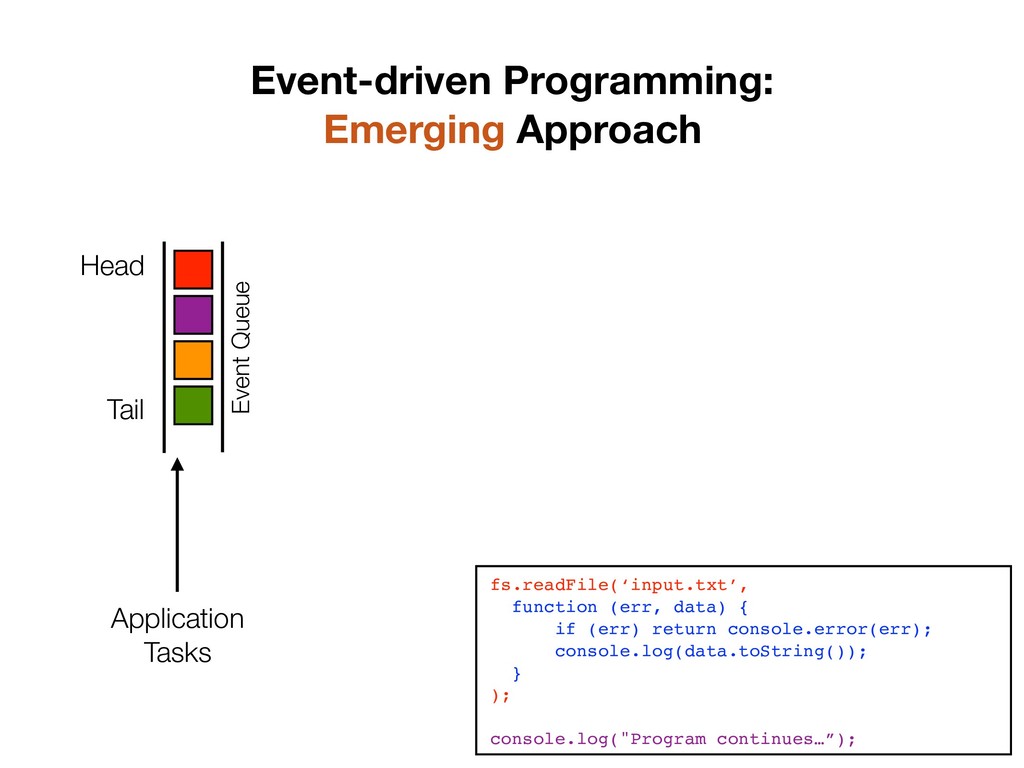
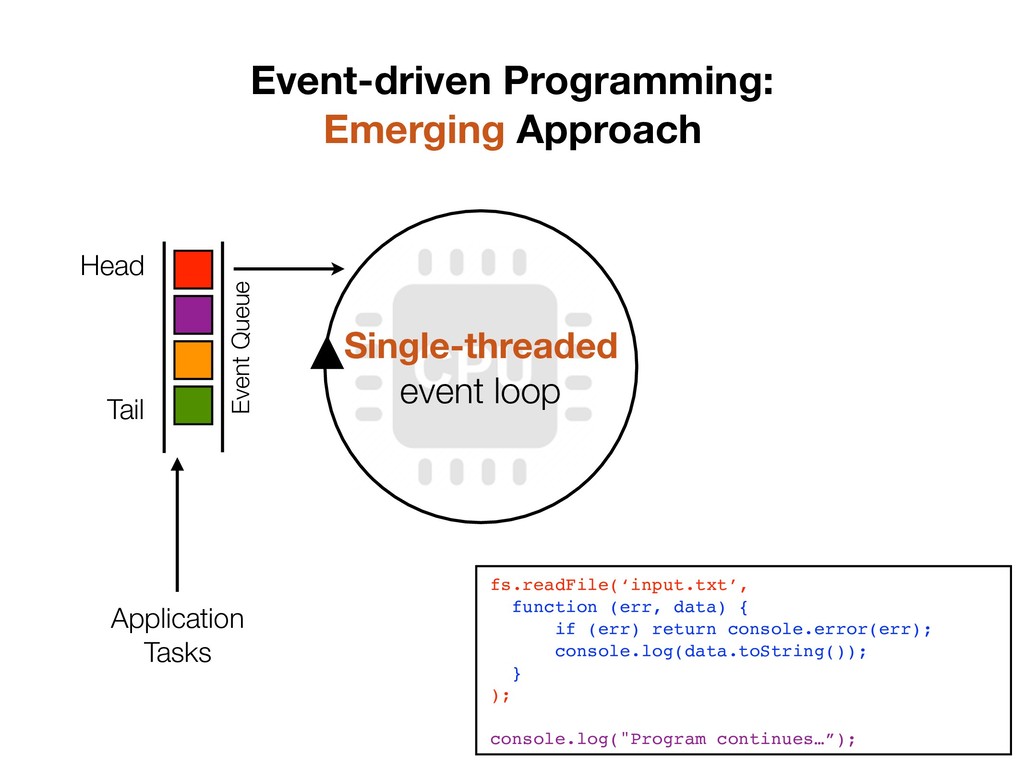
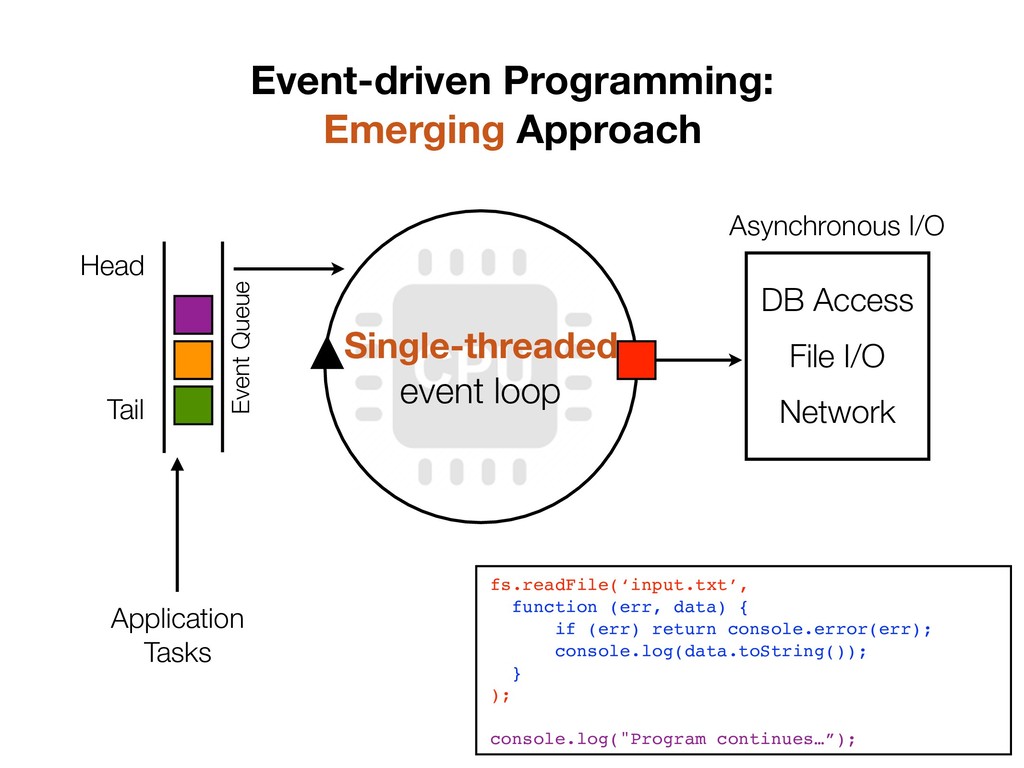
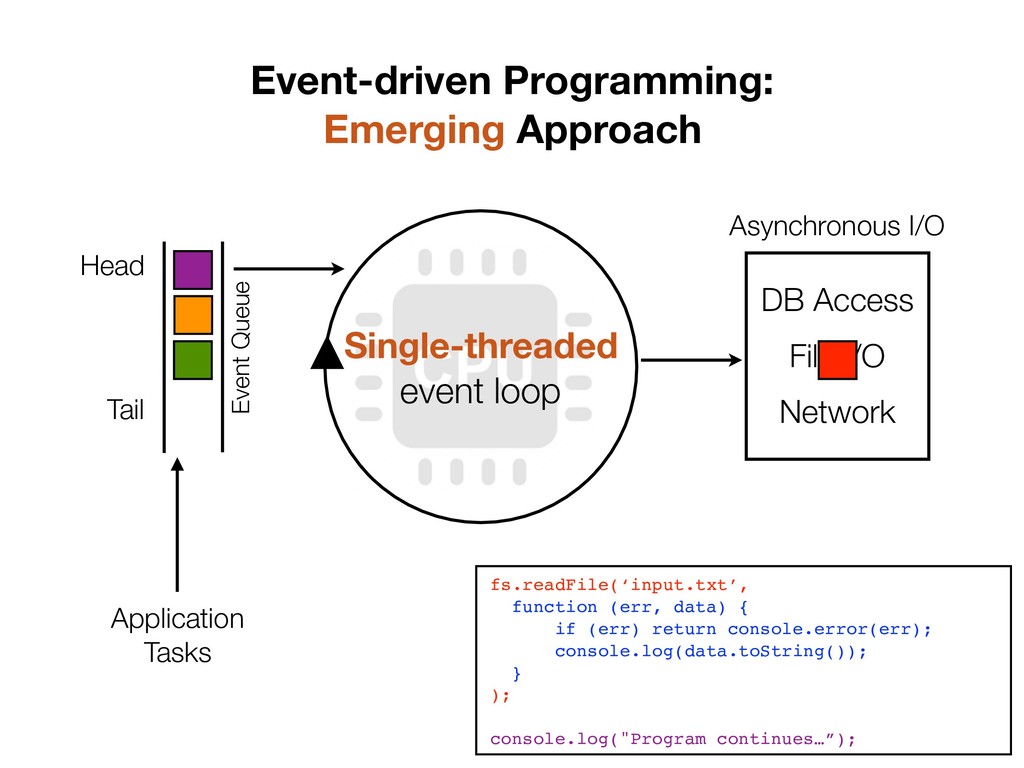
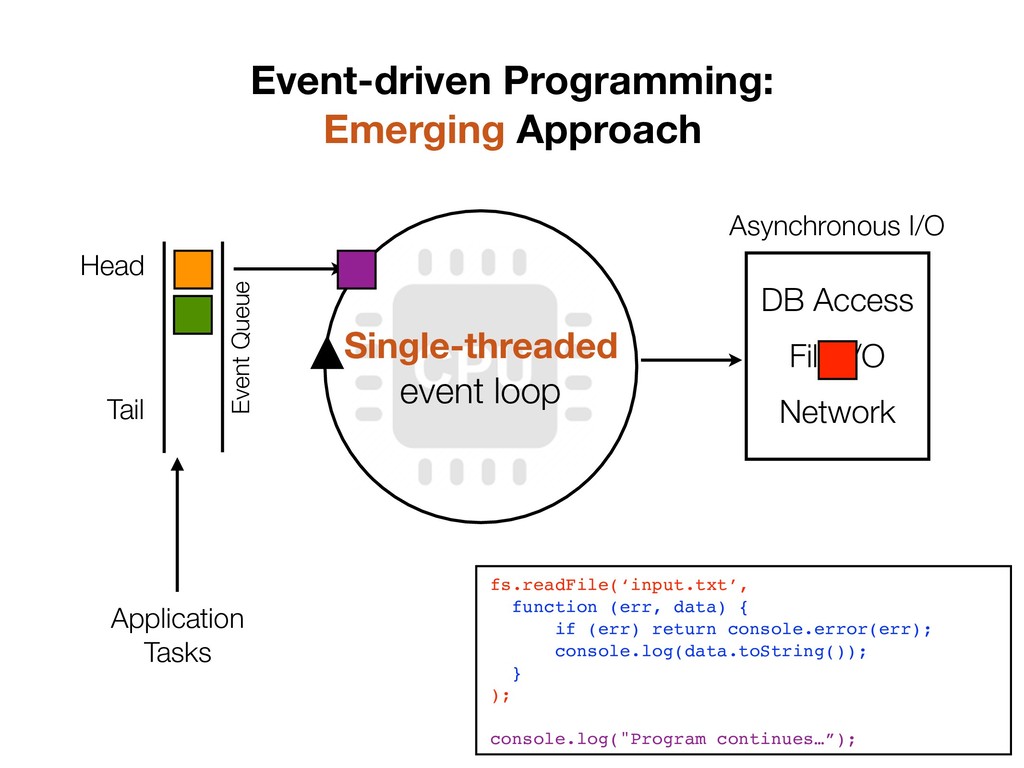
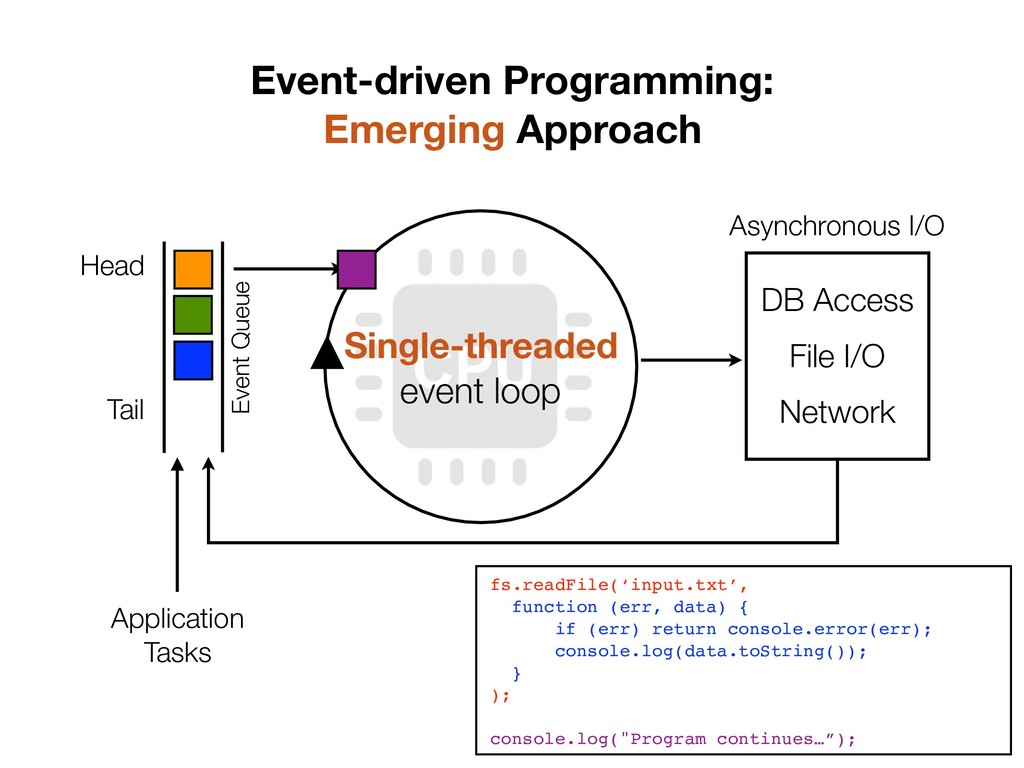
![9 Thread-based Programming Event-driven Programming [Welsh et al. ’00]](https://files.speakerdeck.com/presentations/9c3de237cd08416b86d0599992ed7e7d/slide_21.jpg)