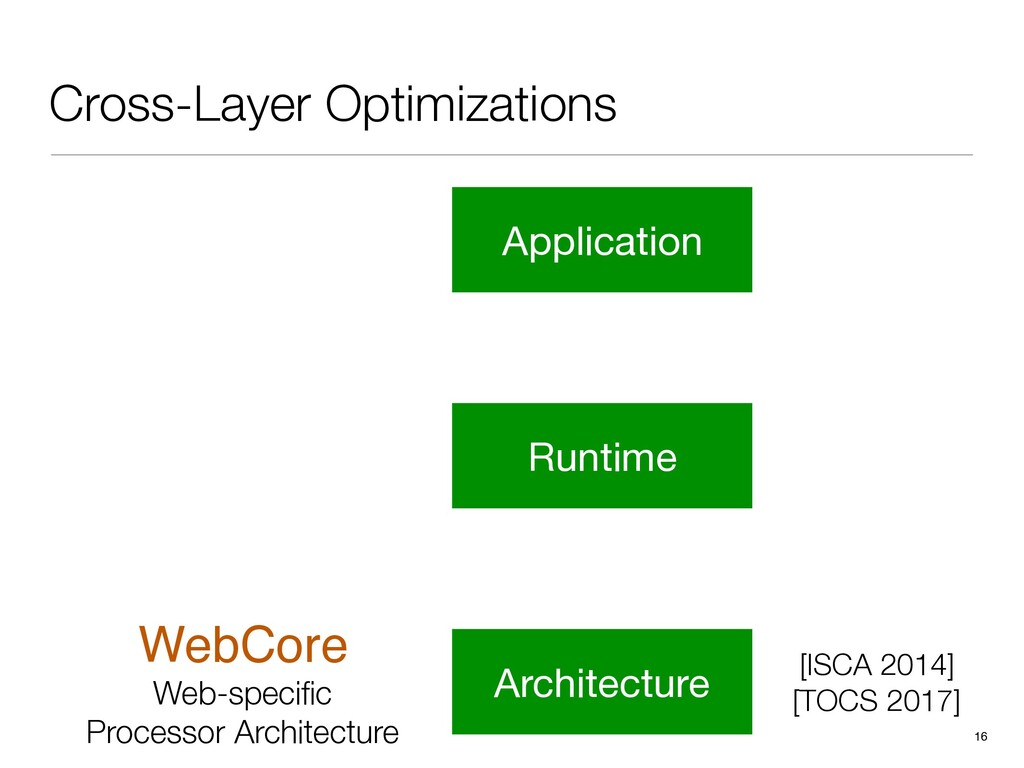
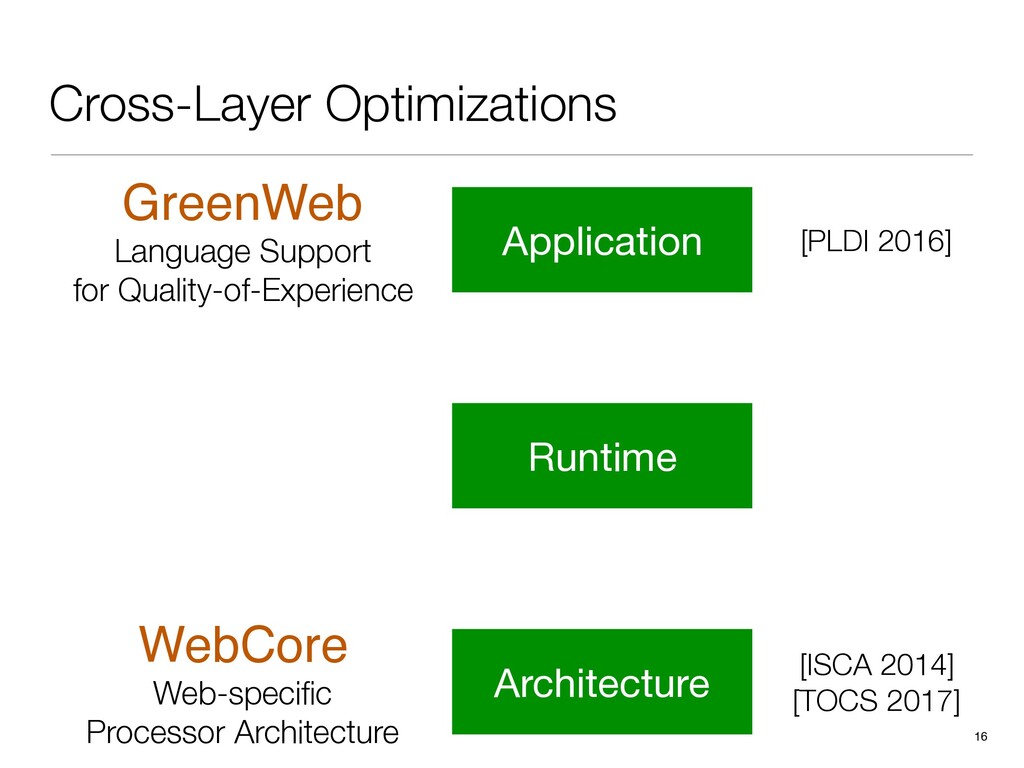
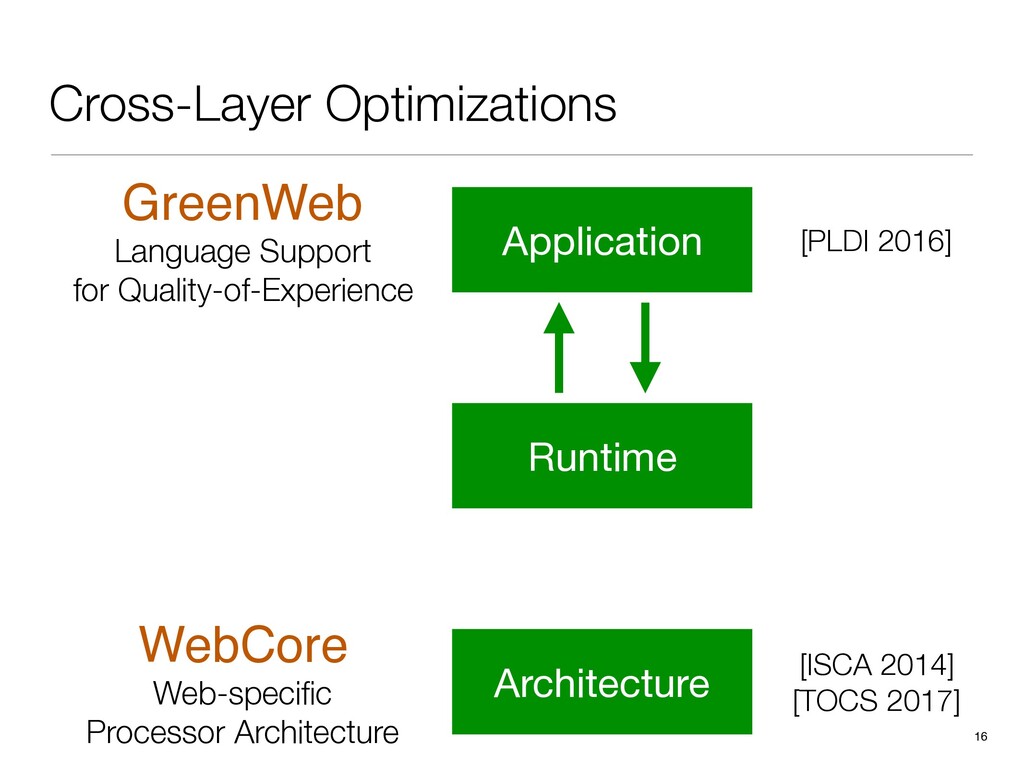
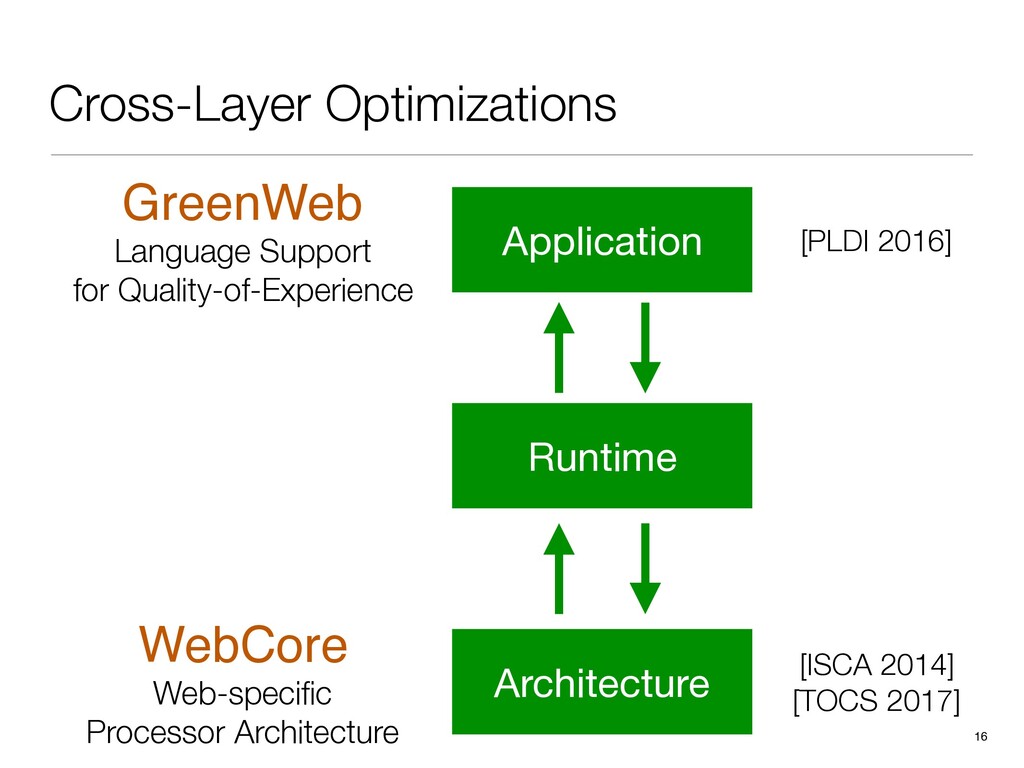
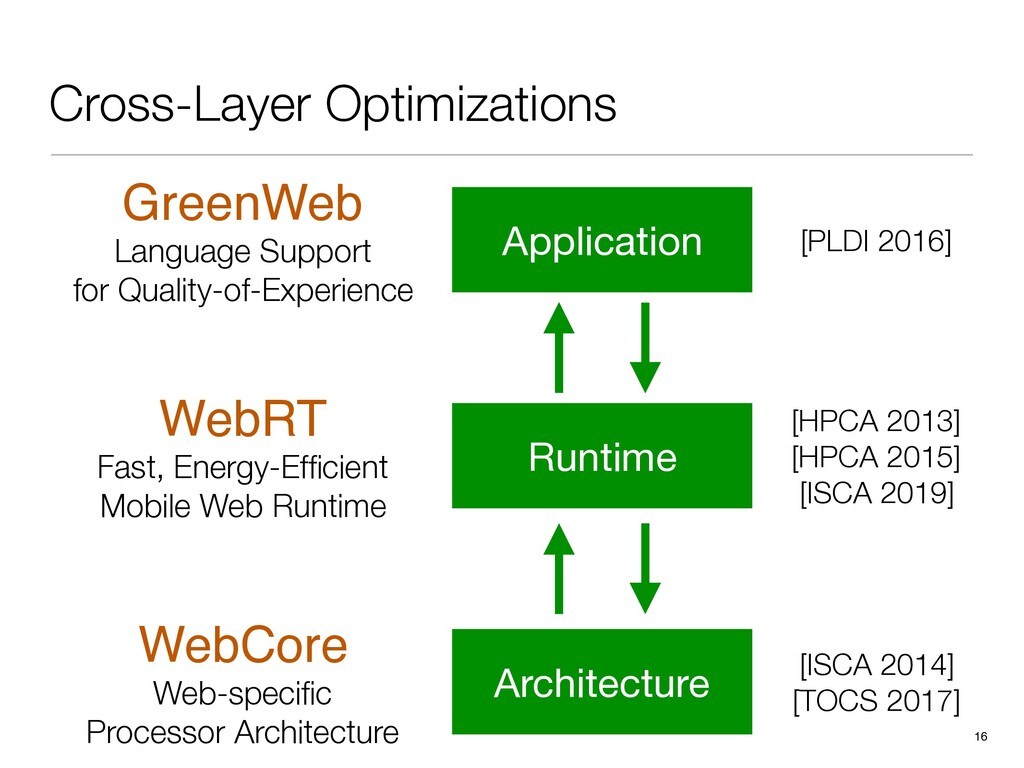
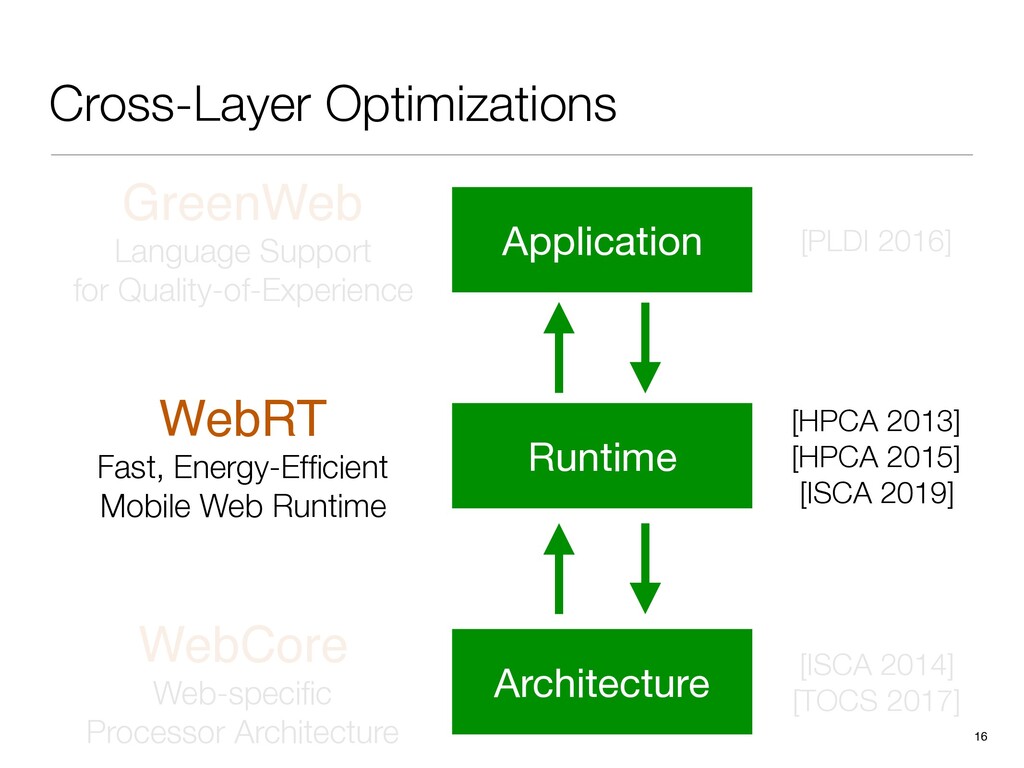
WebRT Fast, Energy-Efficient Mobile Web Runtime GreenWeb Language Support for Quality-of-Experience [PLDI 2016] [ISCA 2014] [TOCS 2017] [HPCA 2013] [HPCA 2015] [ISCA 2019]
WebRT Fast, Energy-Efficient Mobile Web Runtime GreenWeb Language Support for Quality-of-Experience [PLDI 2016] [ISCA 2014] [TOCS 2017] [HPCA 2013] [HPCA 2015] [ISCA 2019]
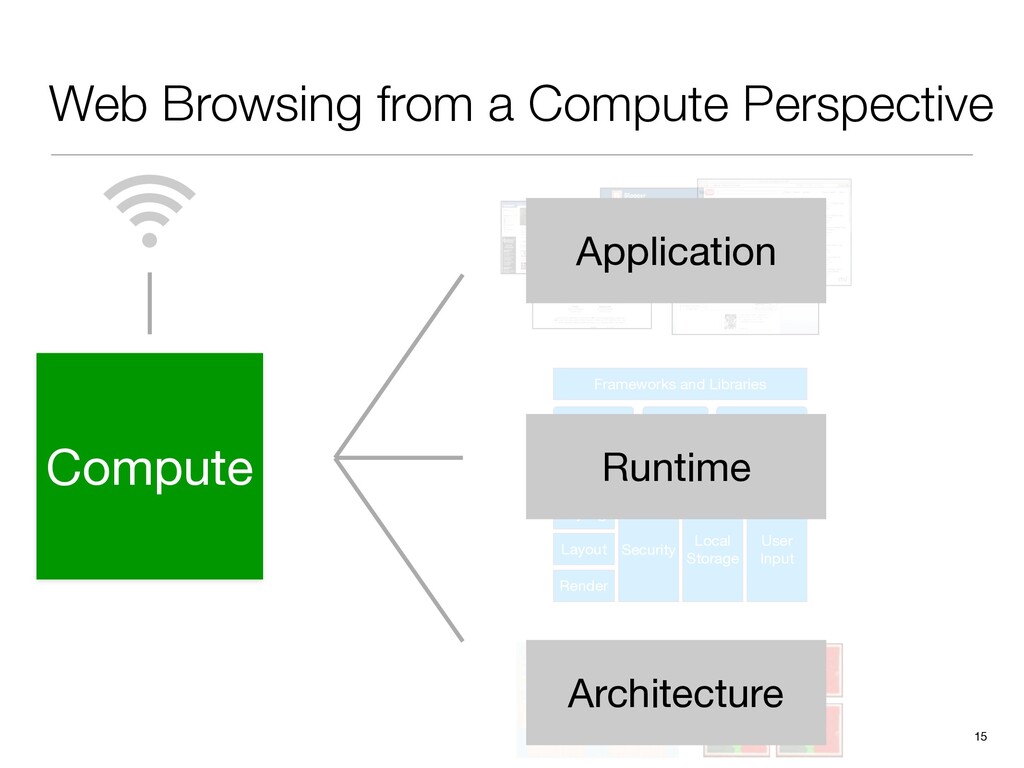
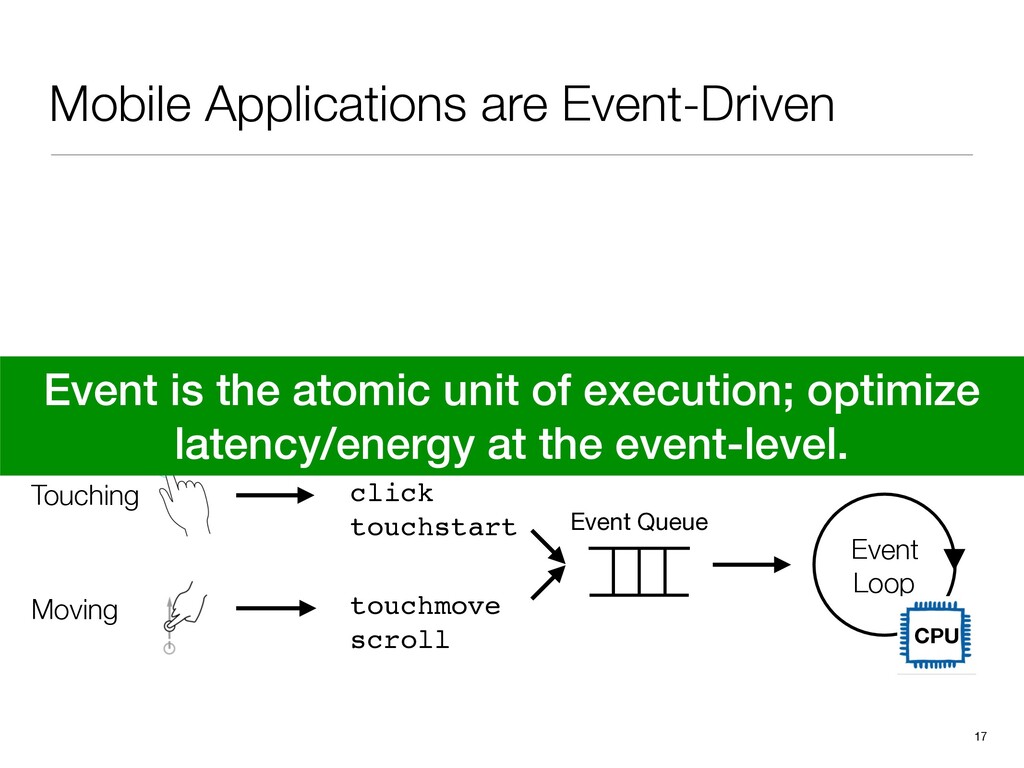
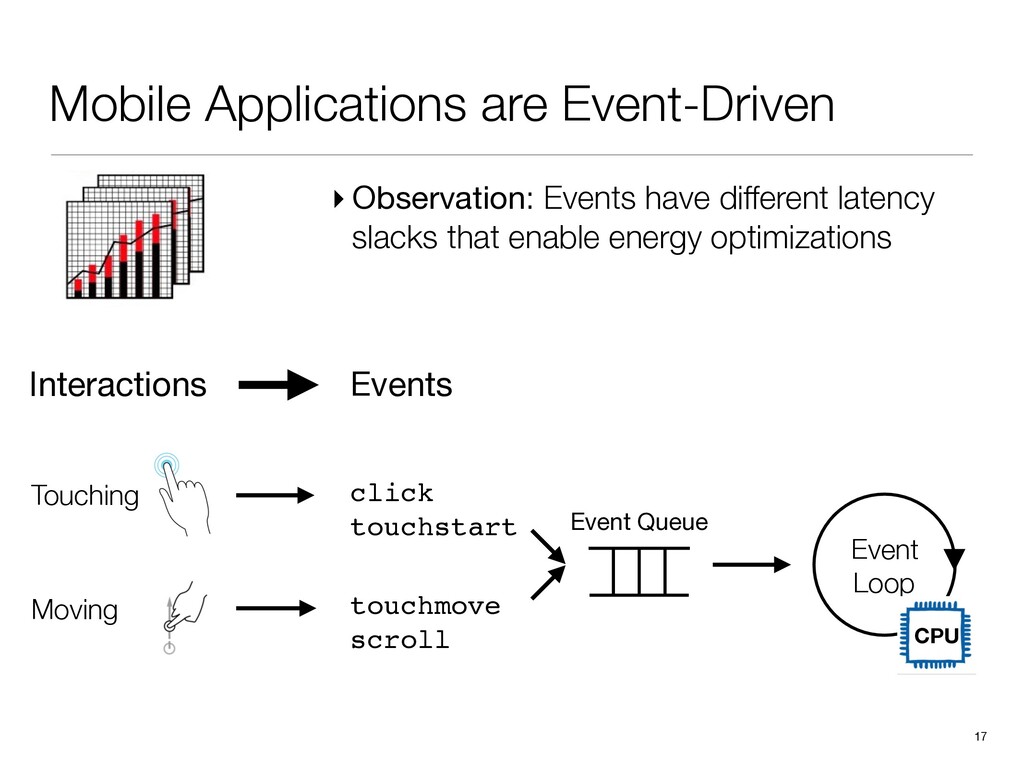
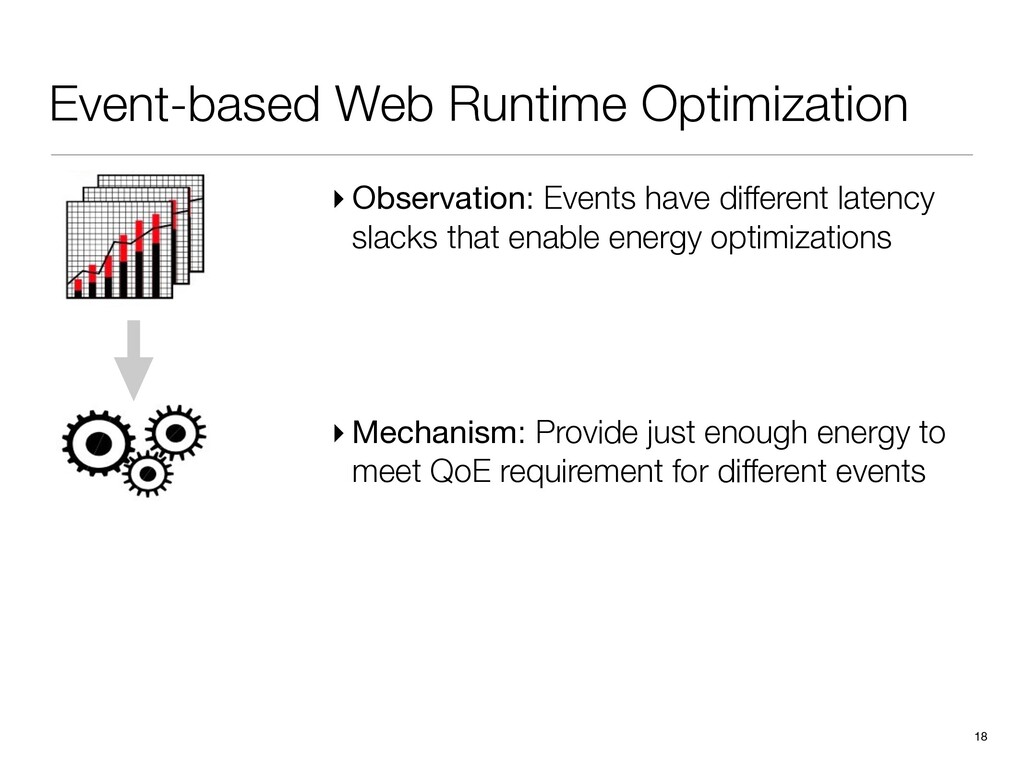
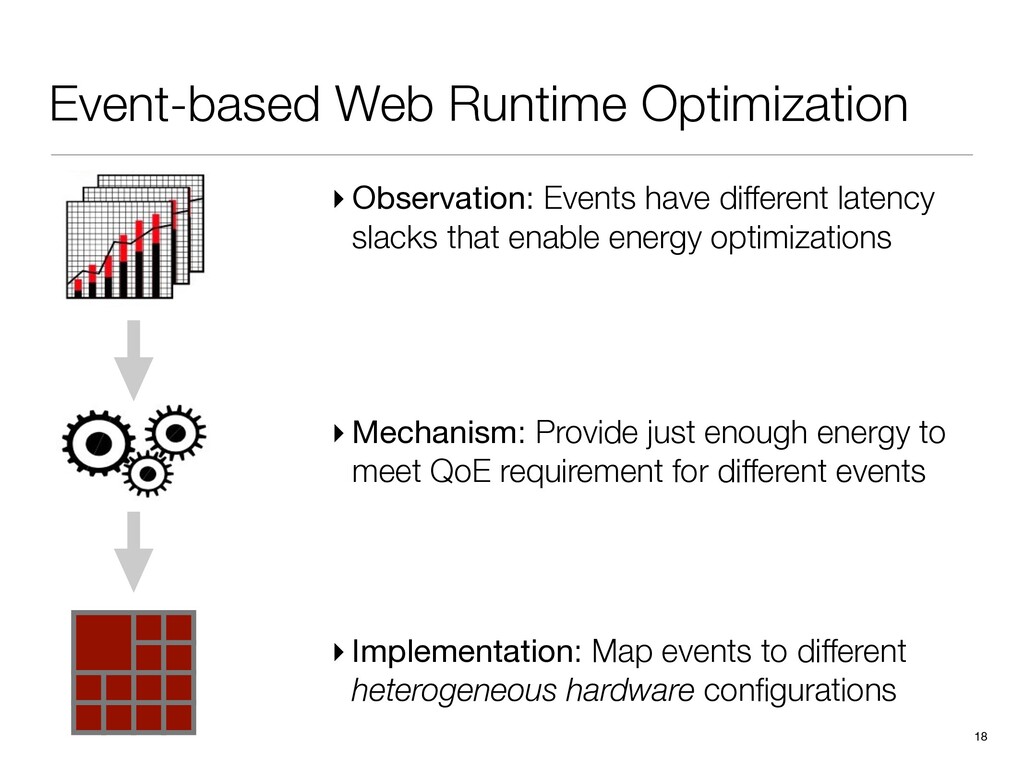
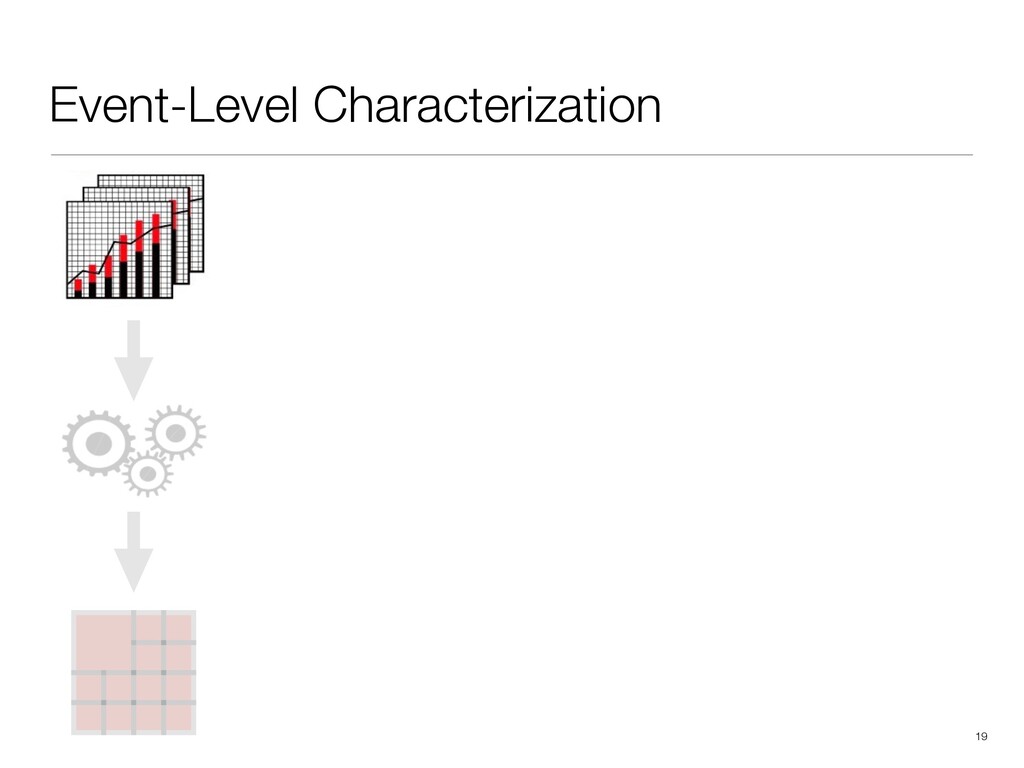
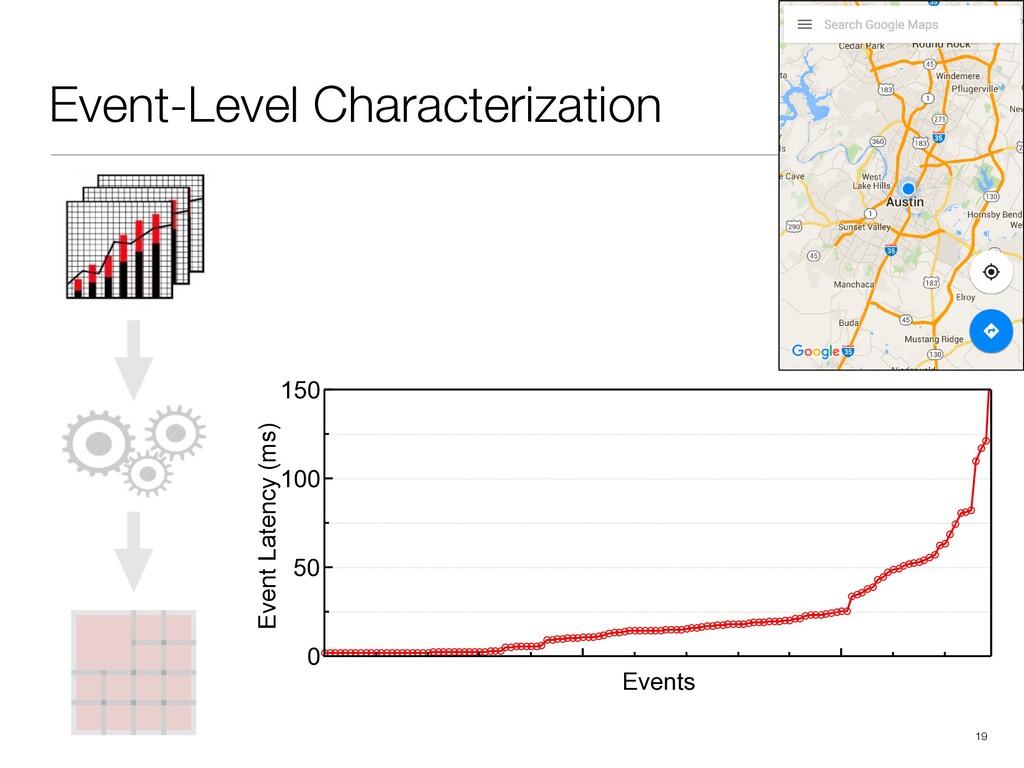
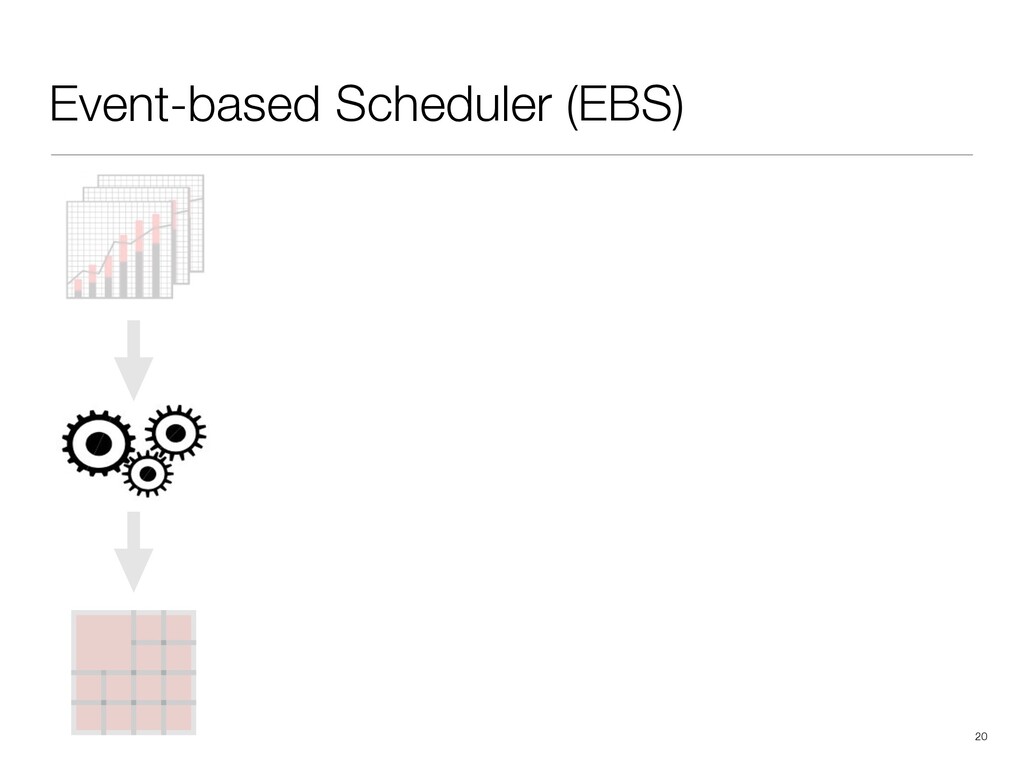
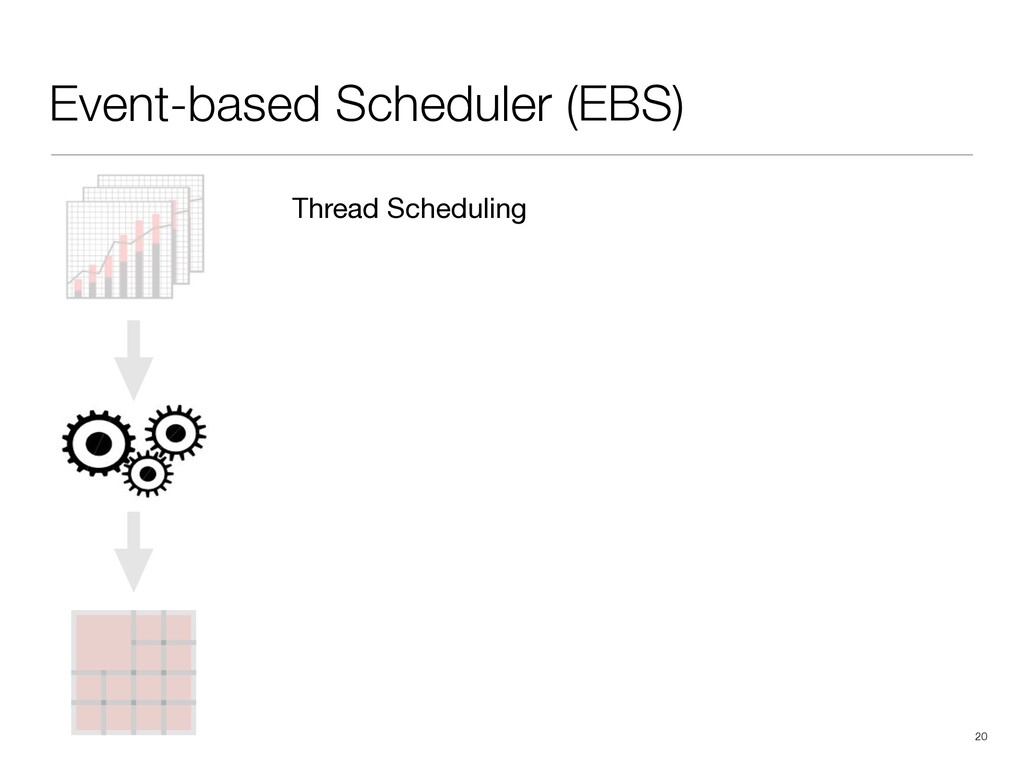
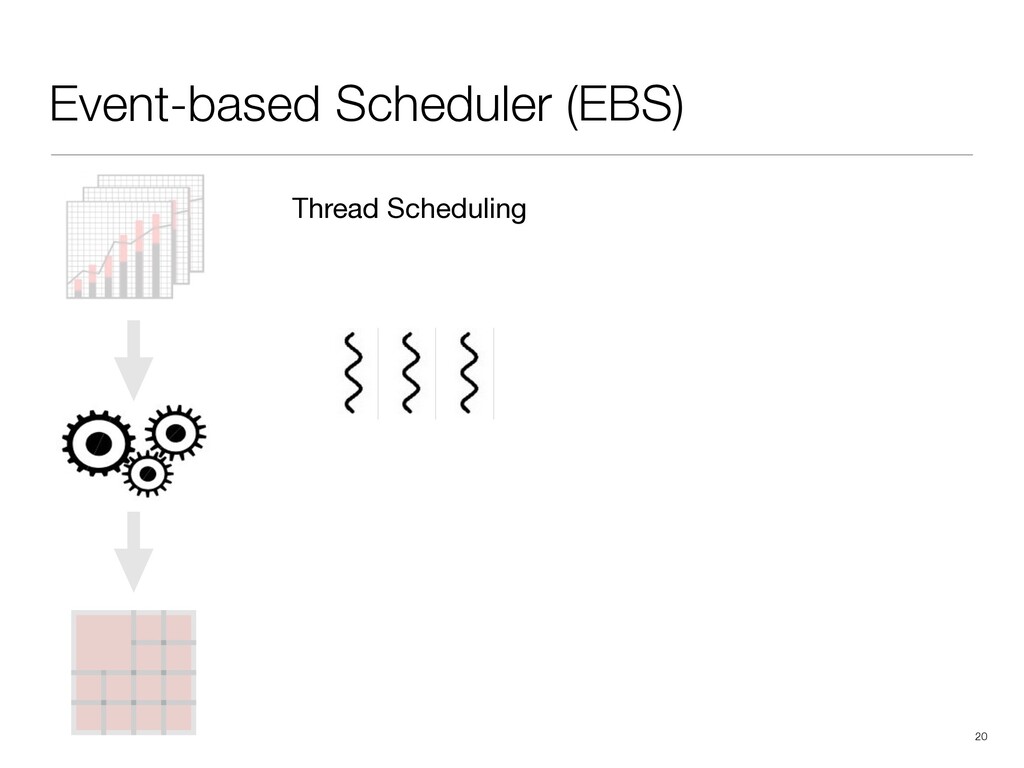
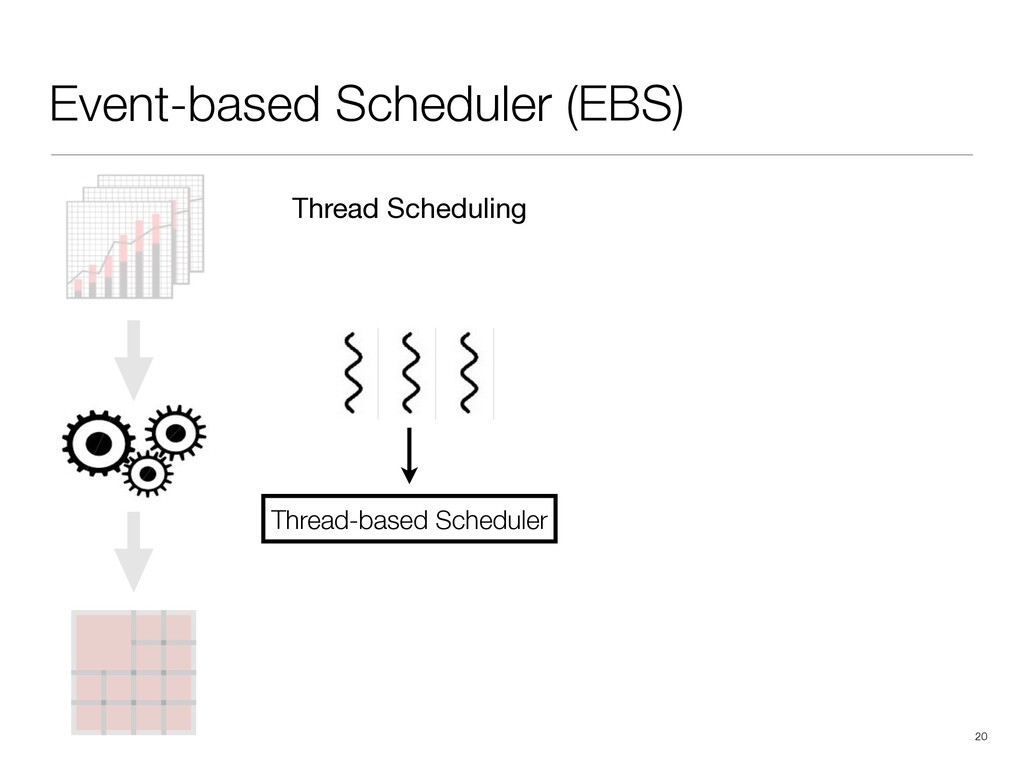
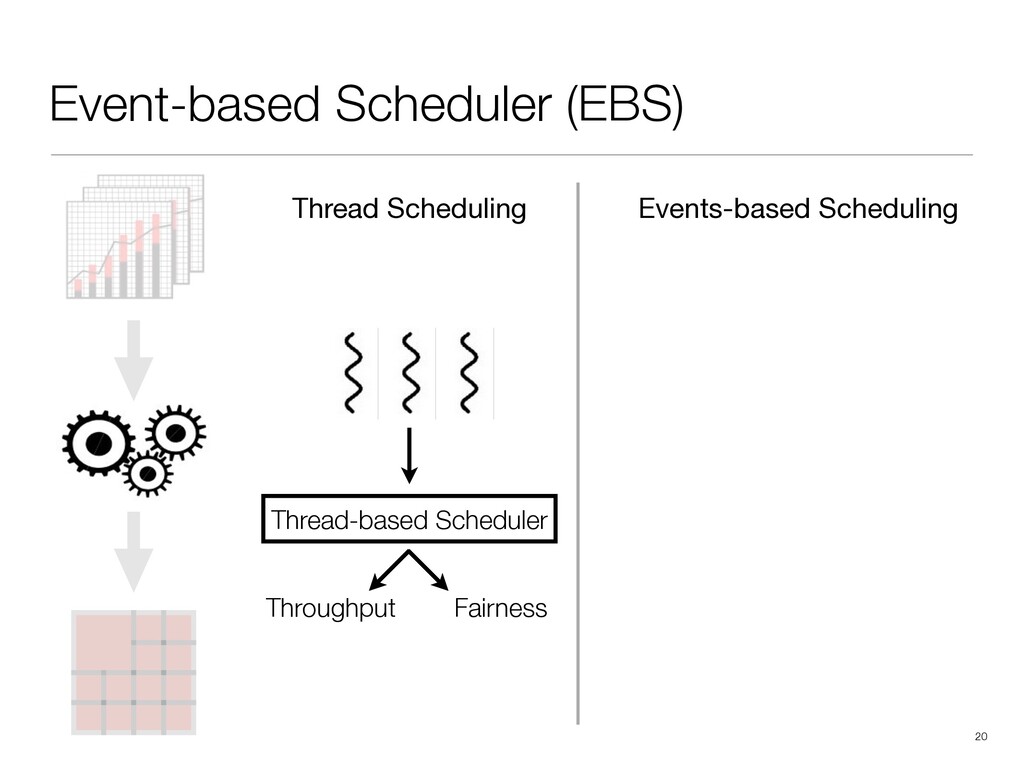
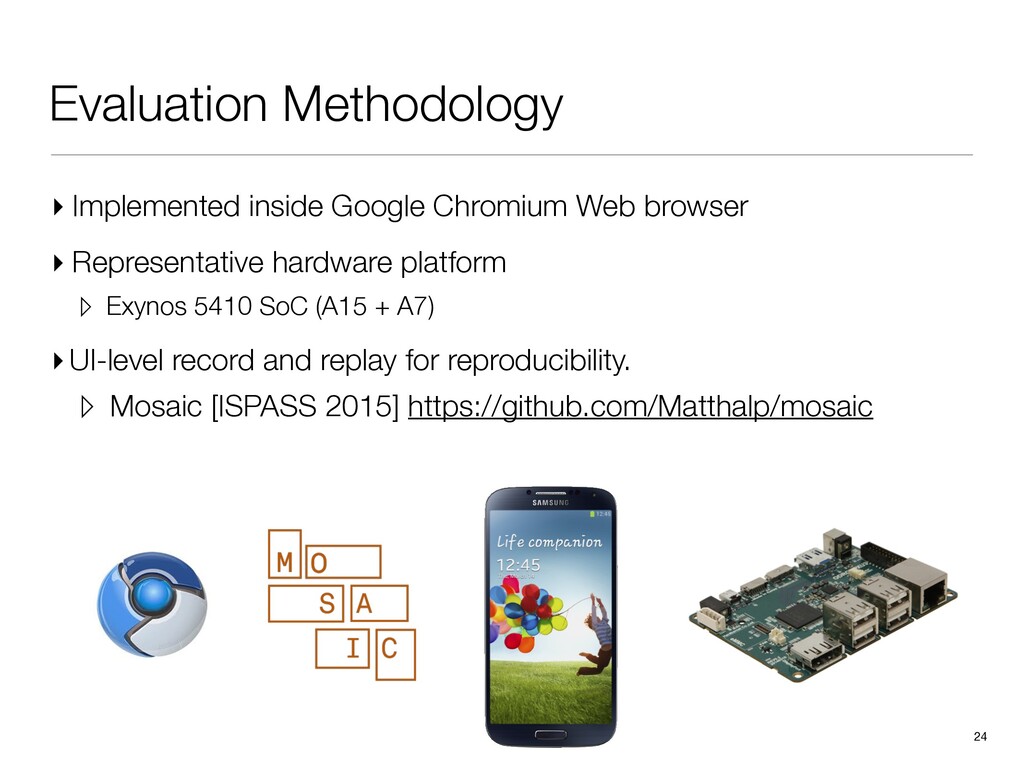
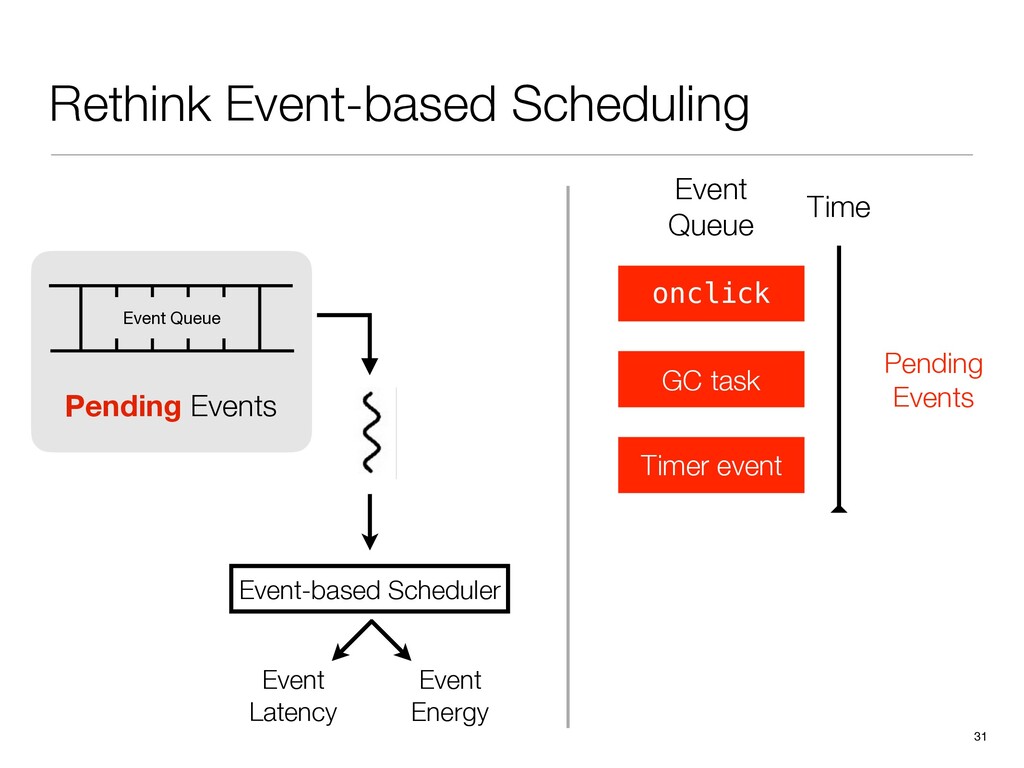
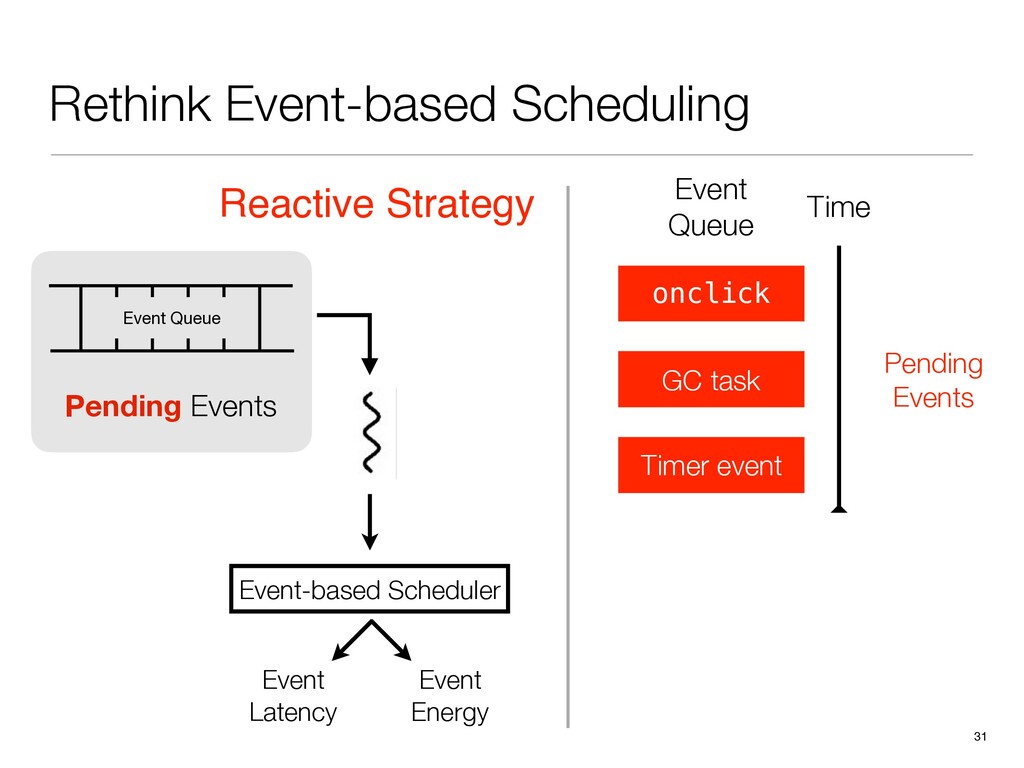
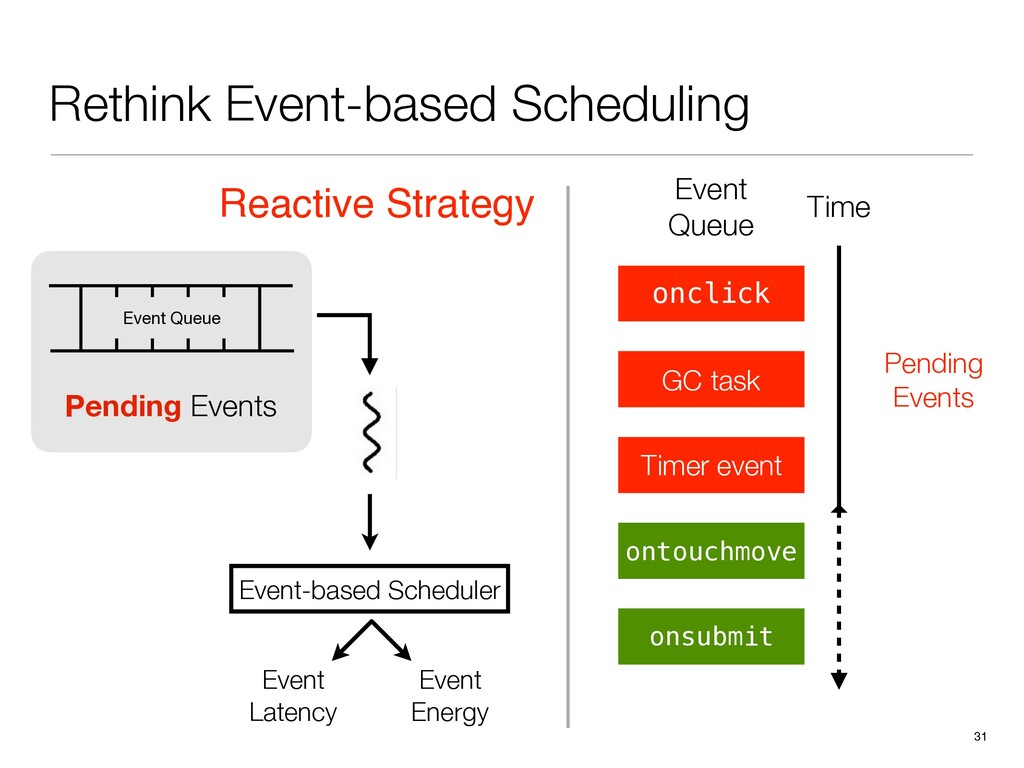
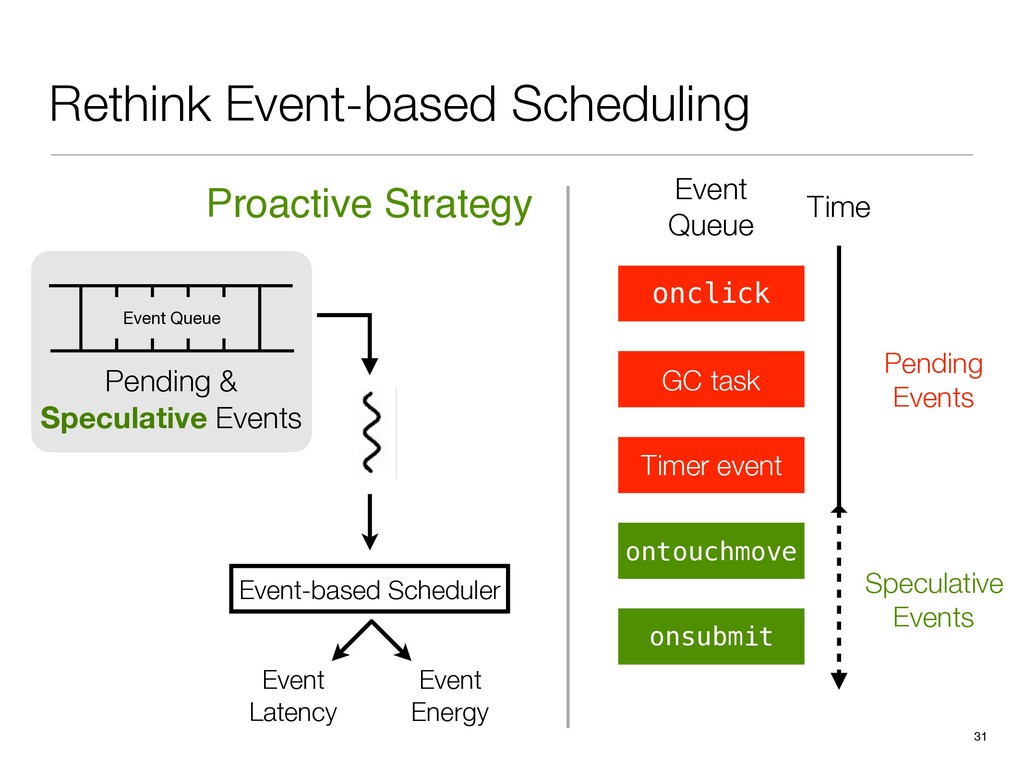
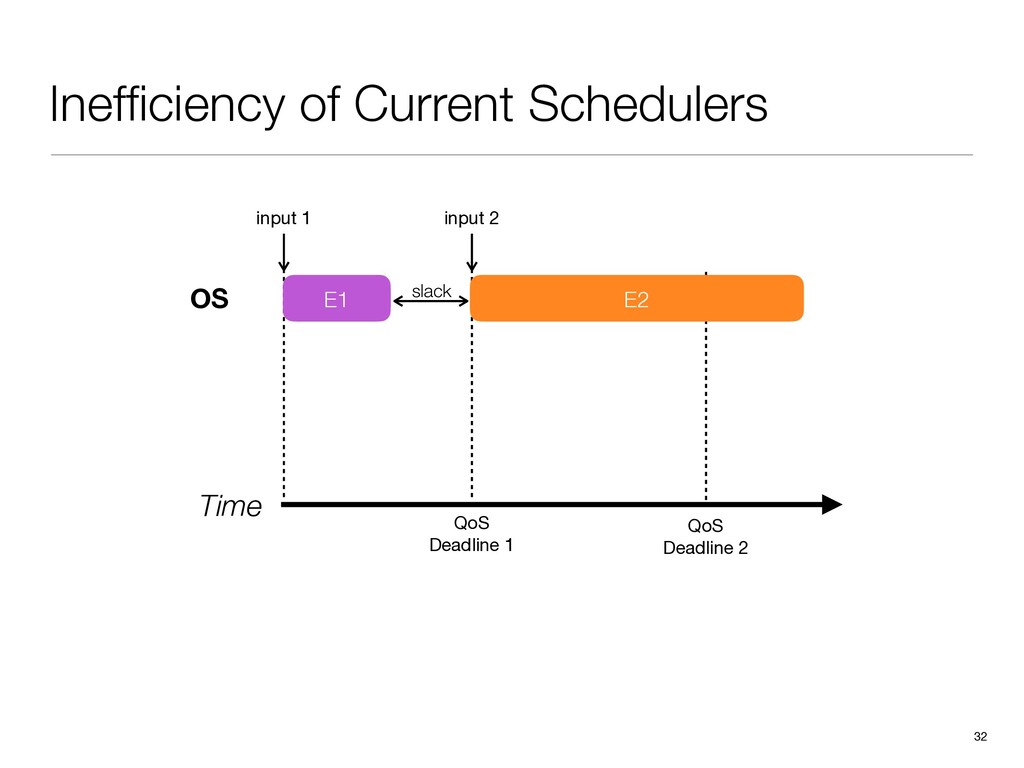
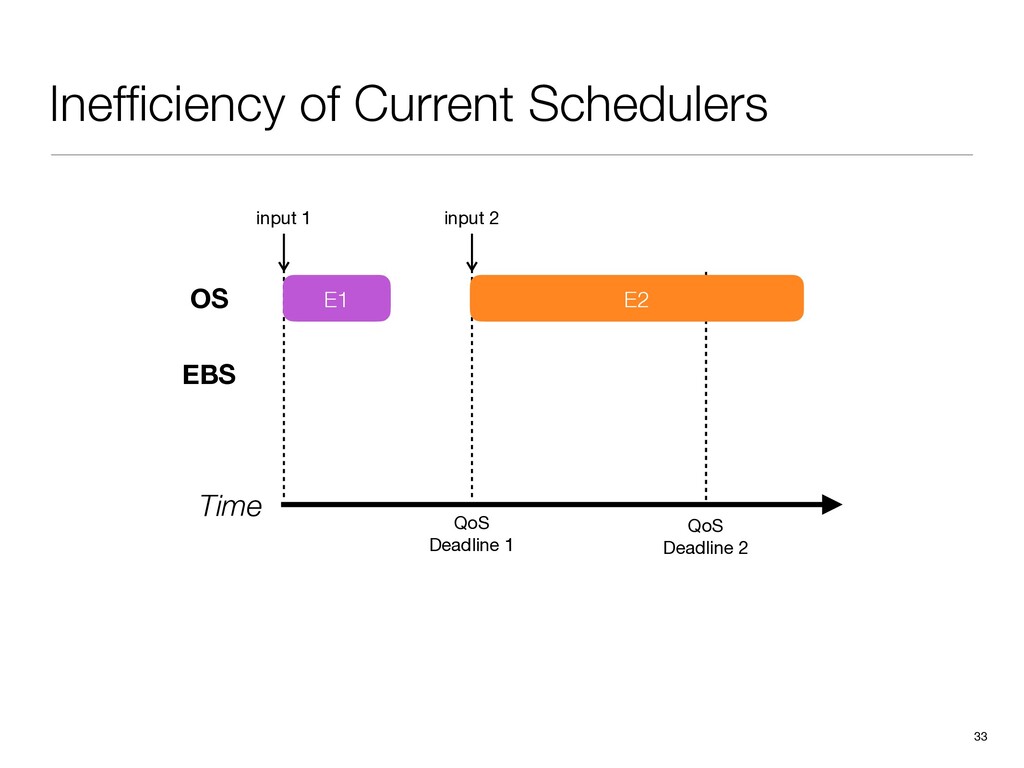
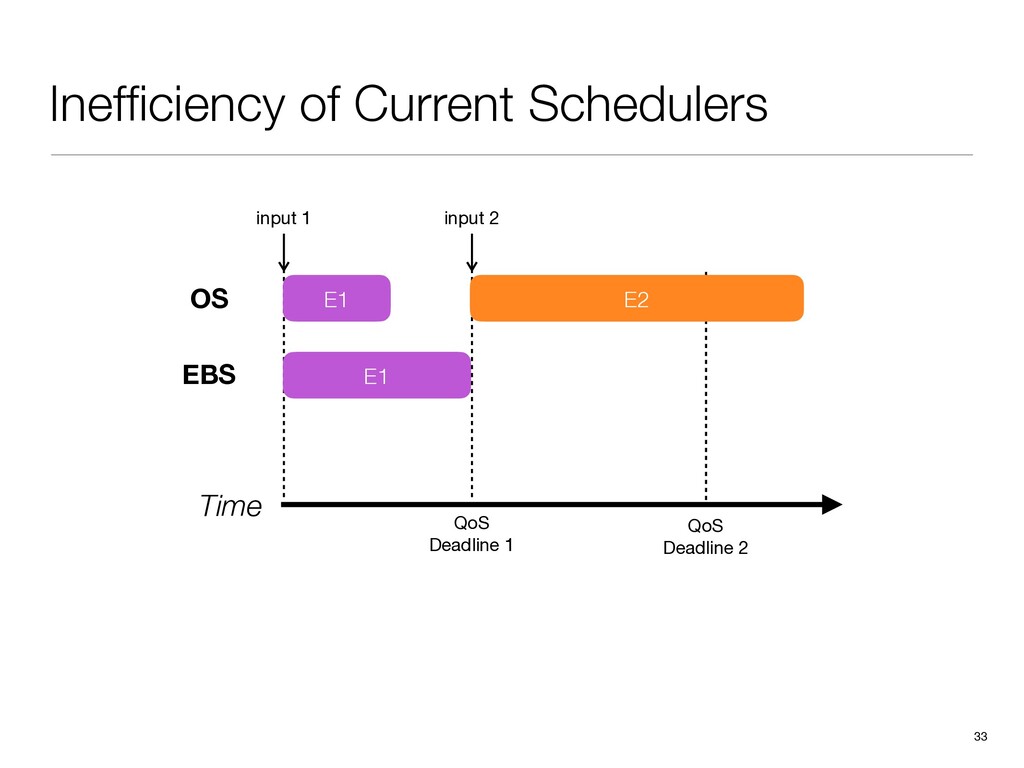
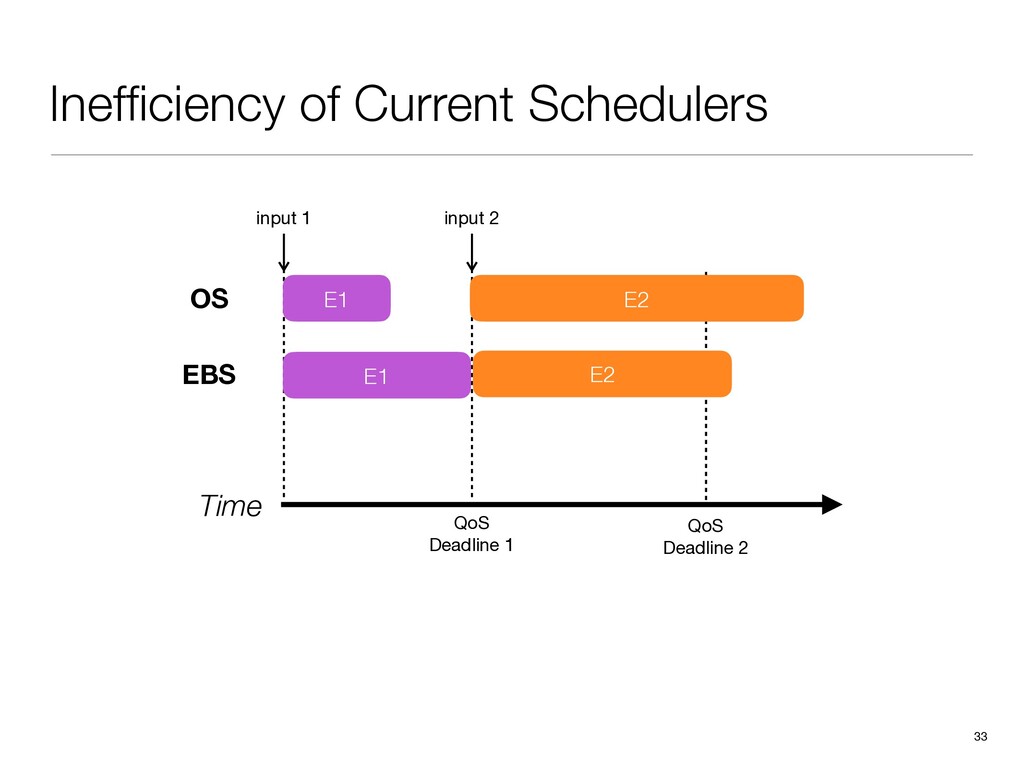
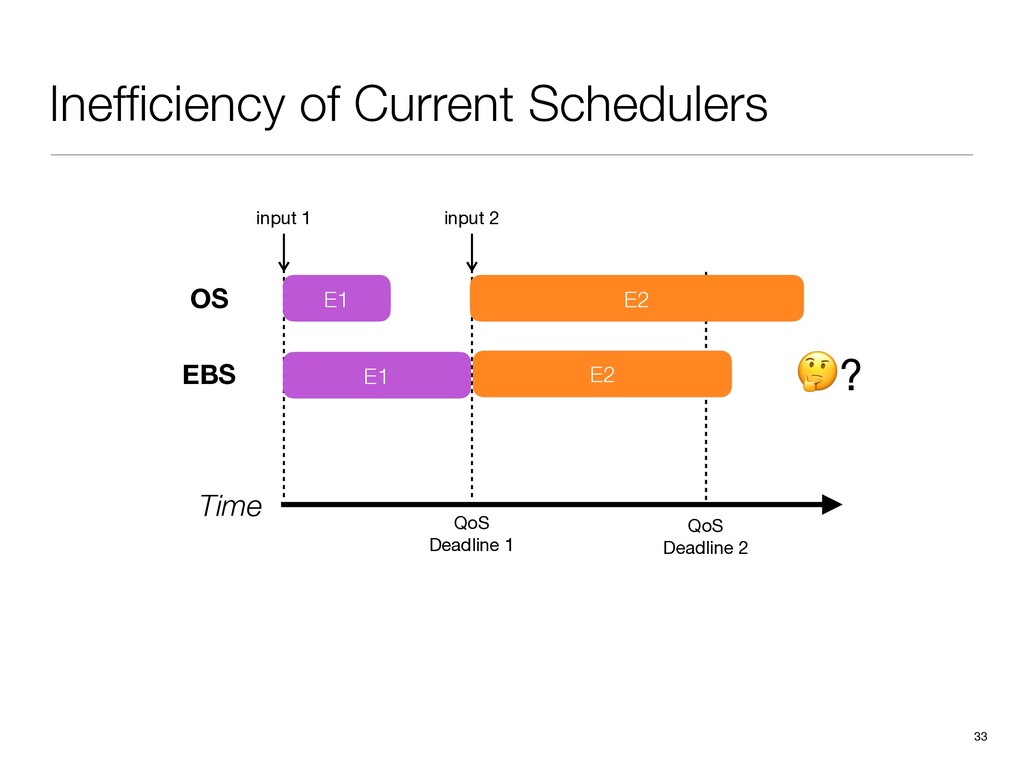
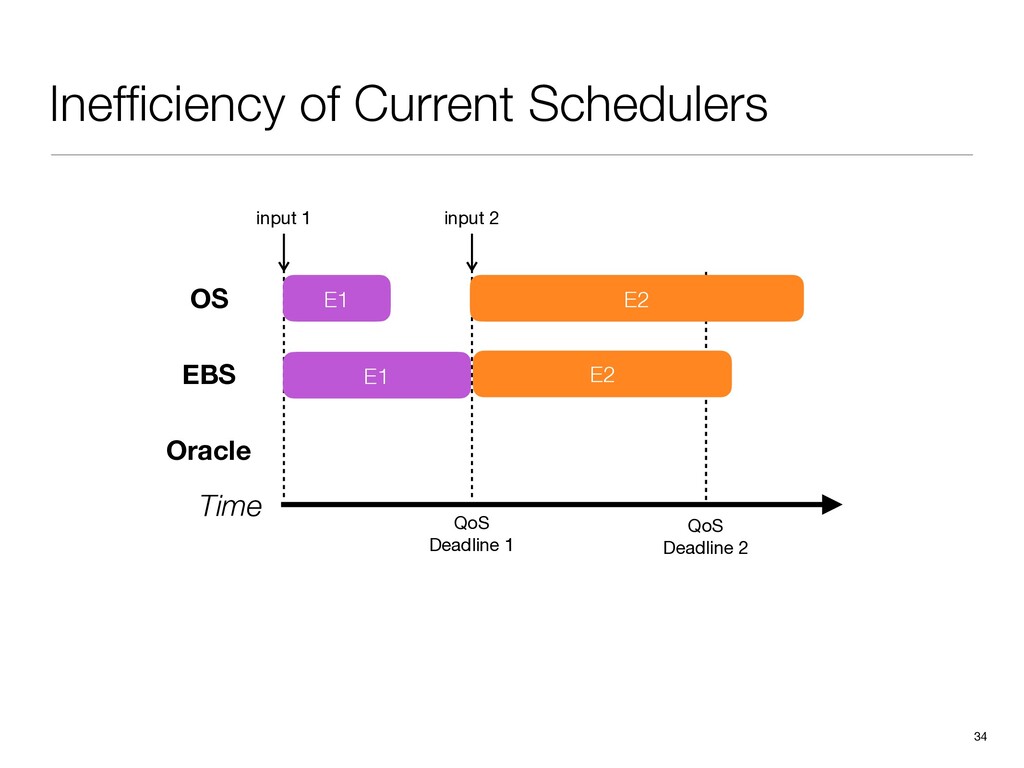
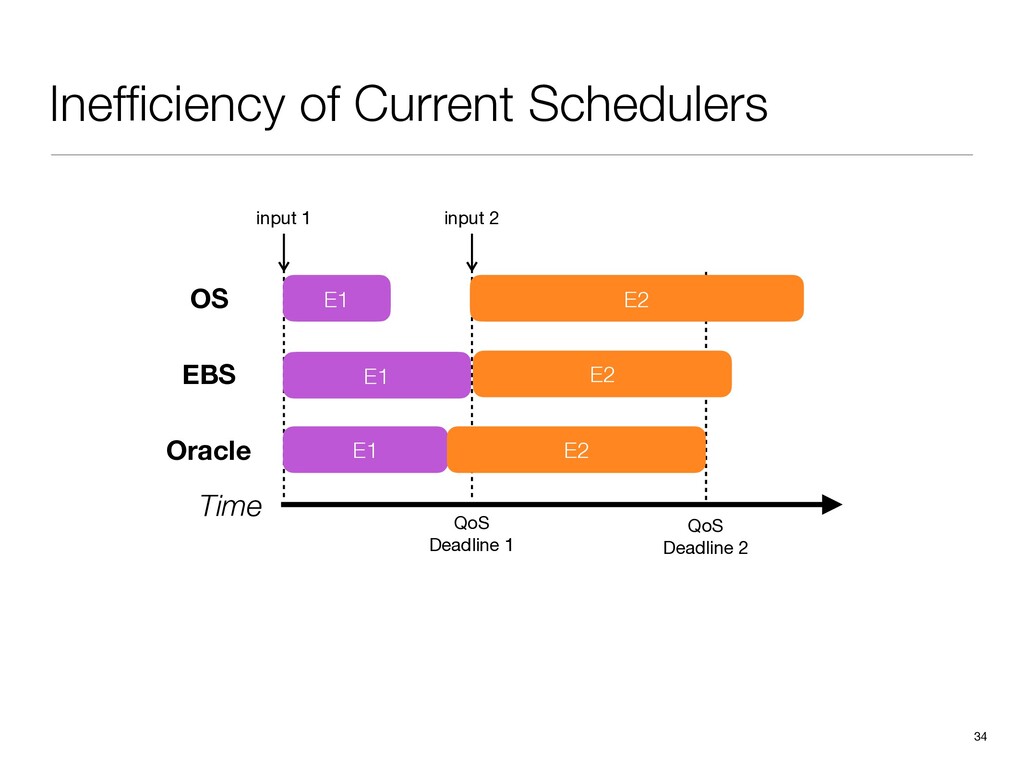
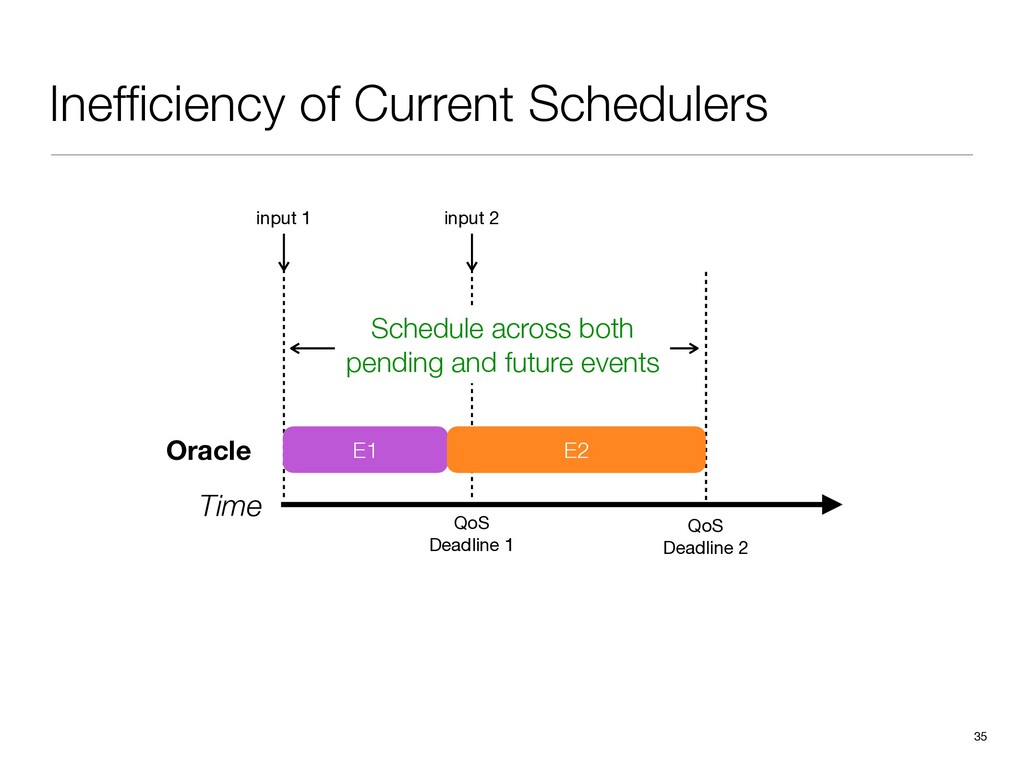
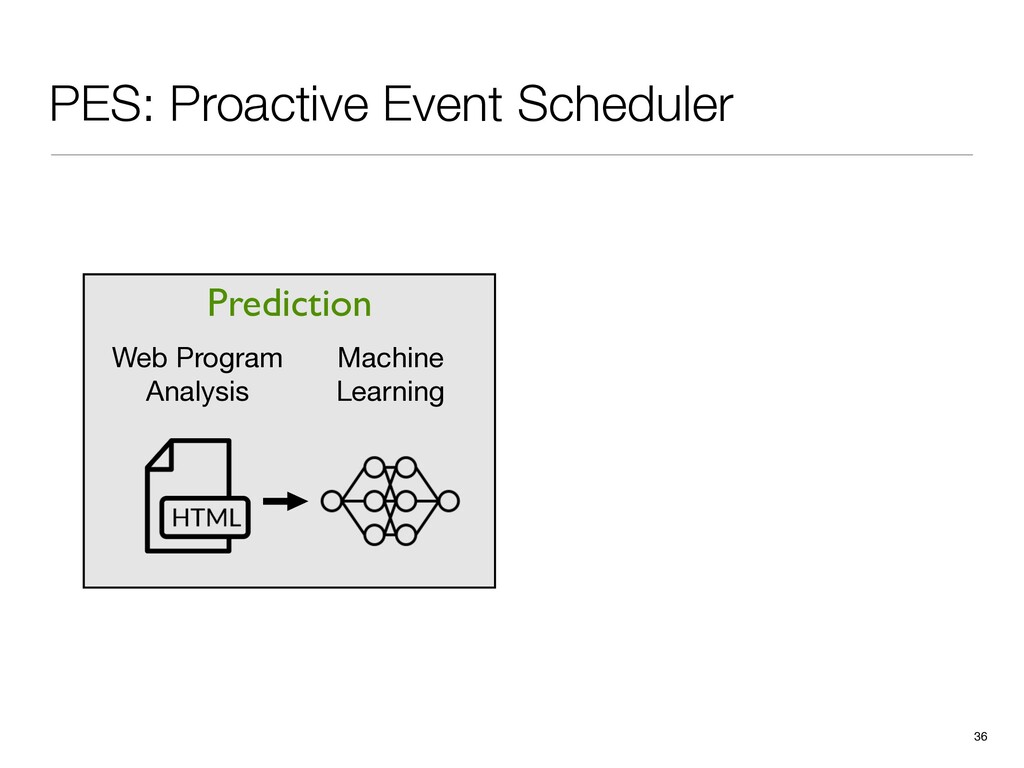
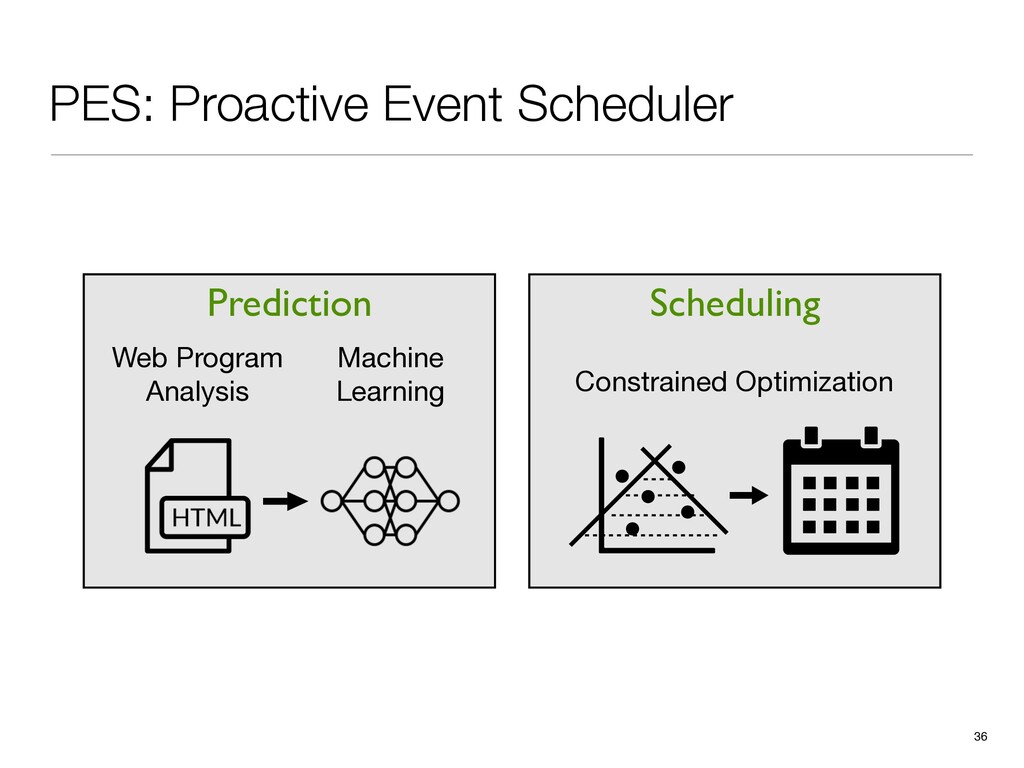
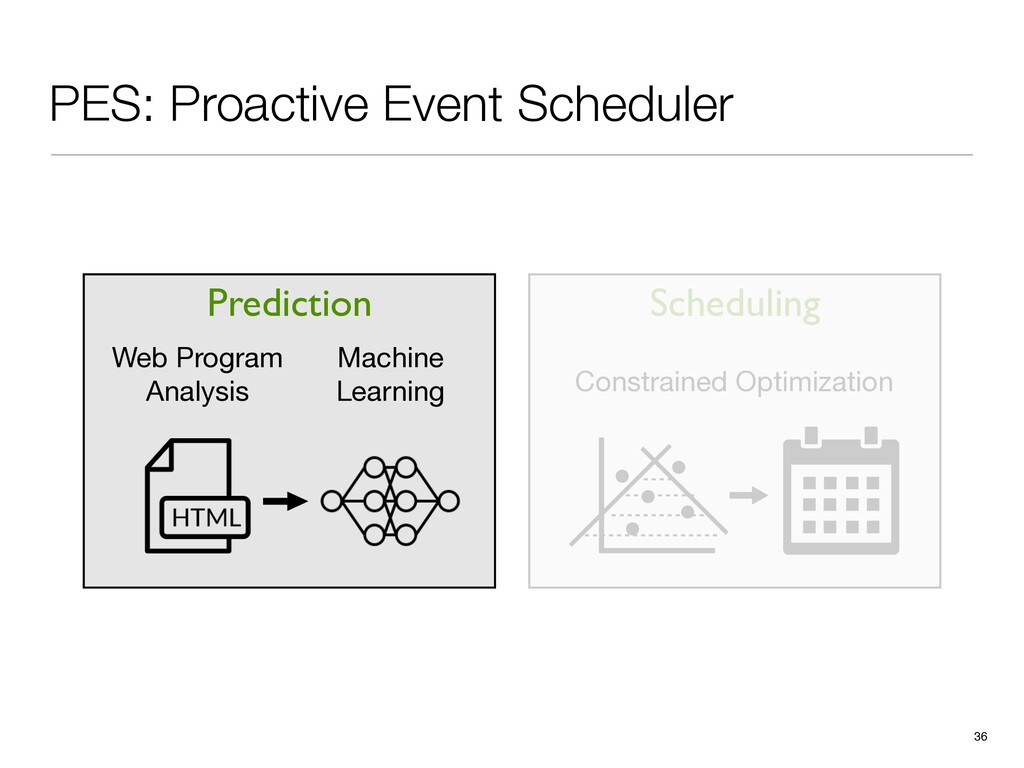
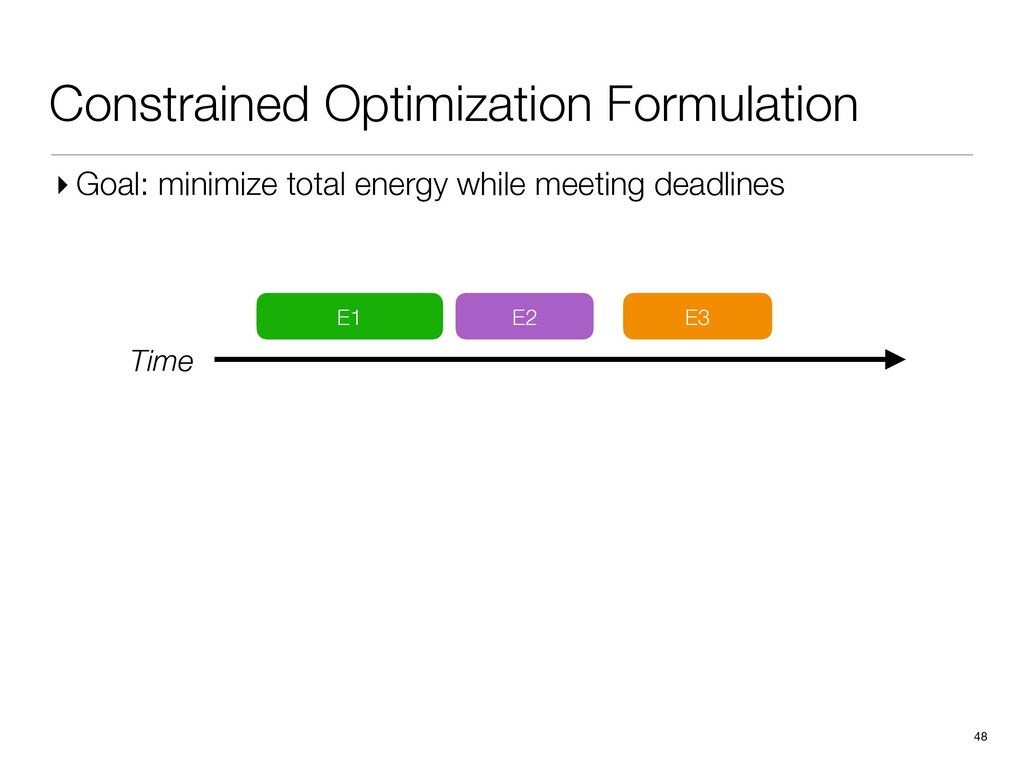
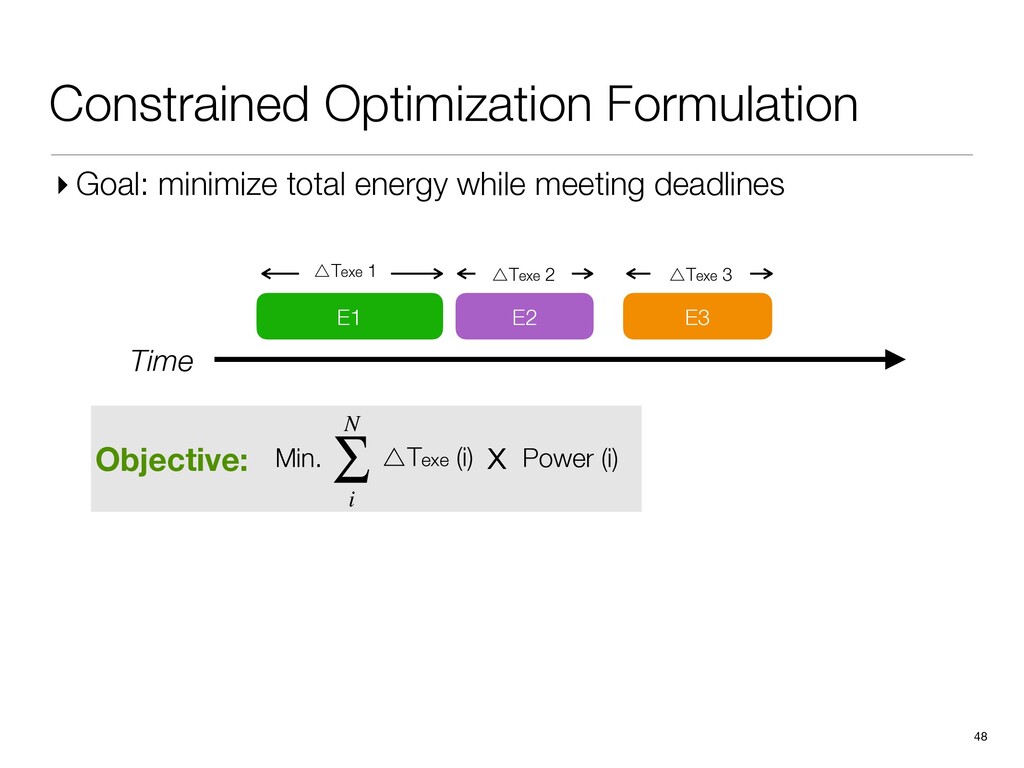
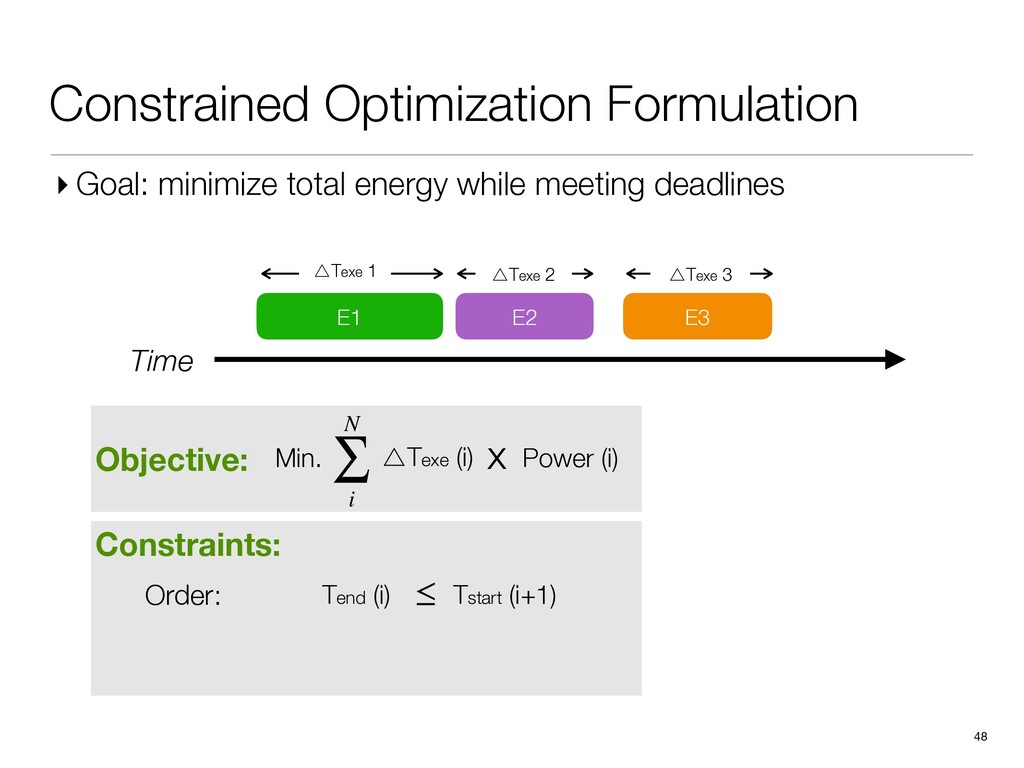
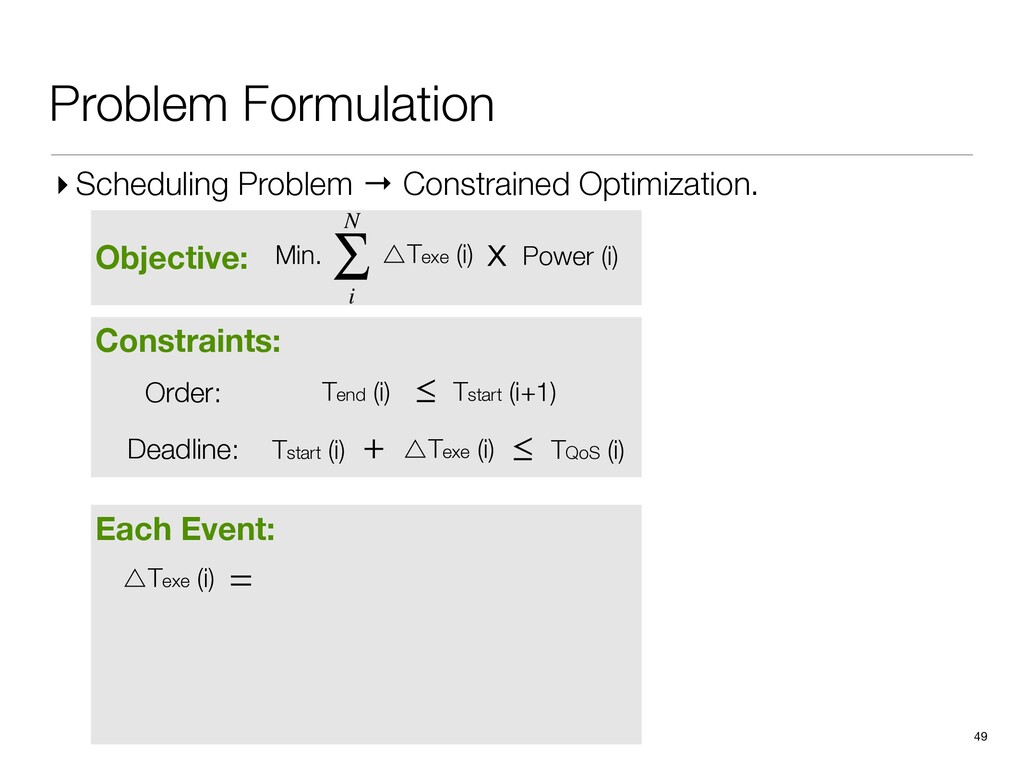
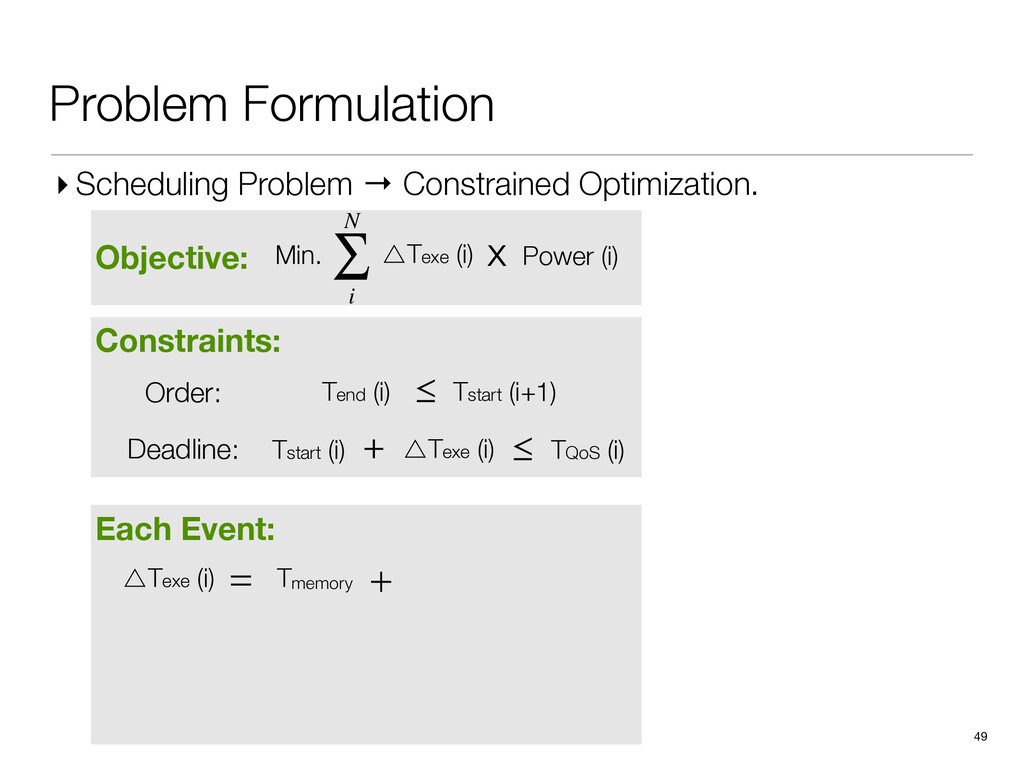
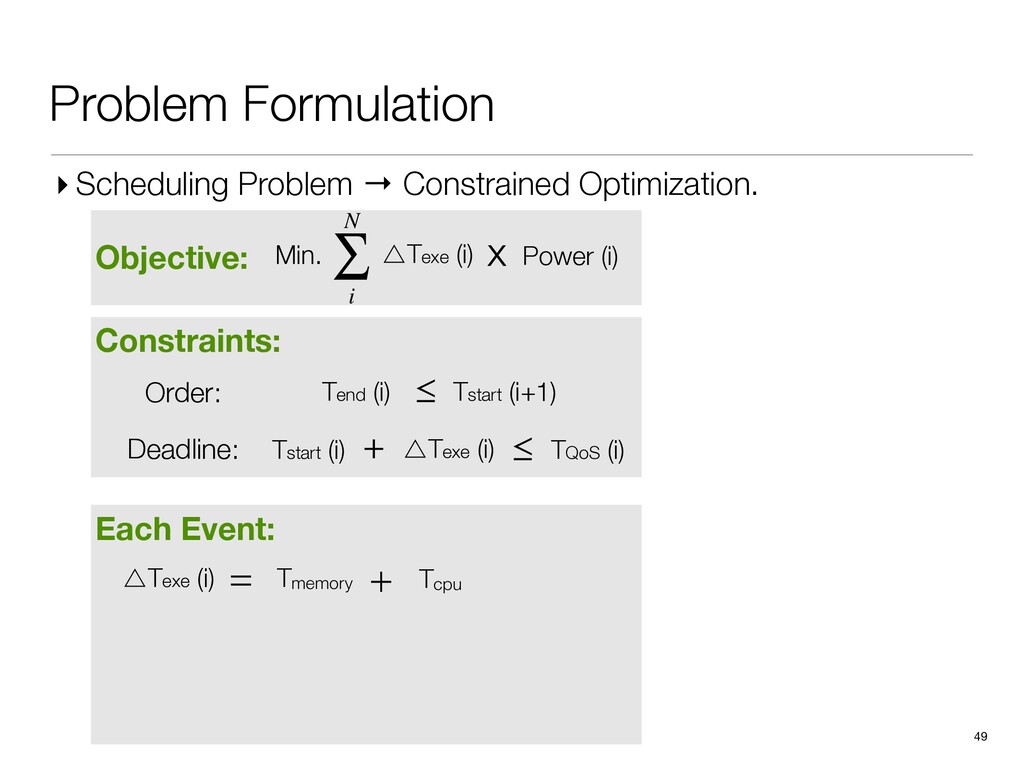
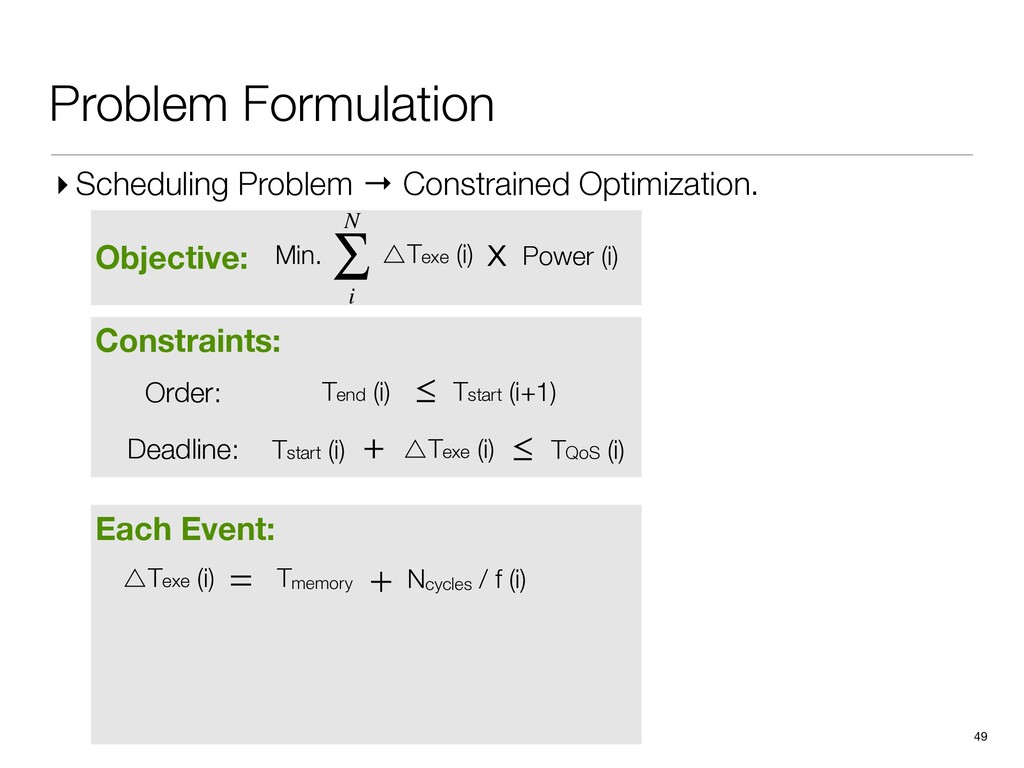
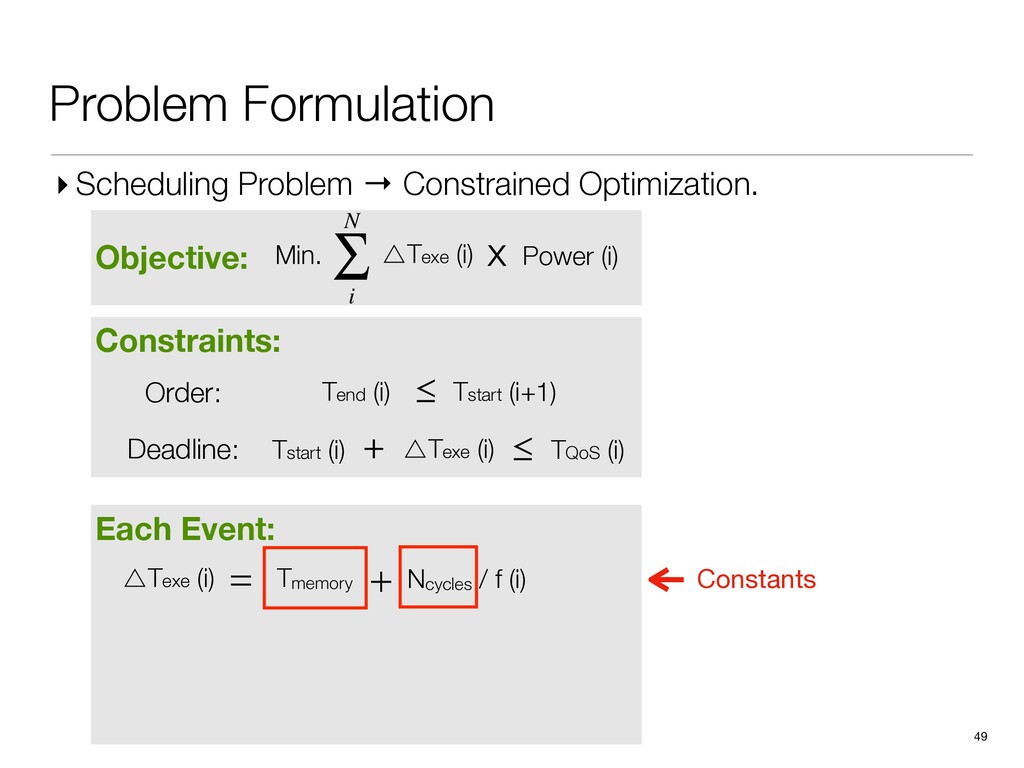
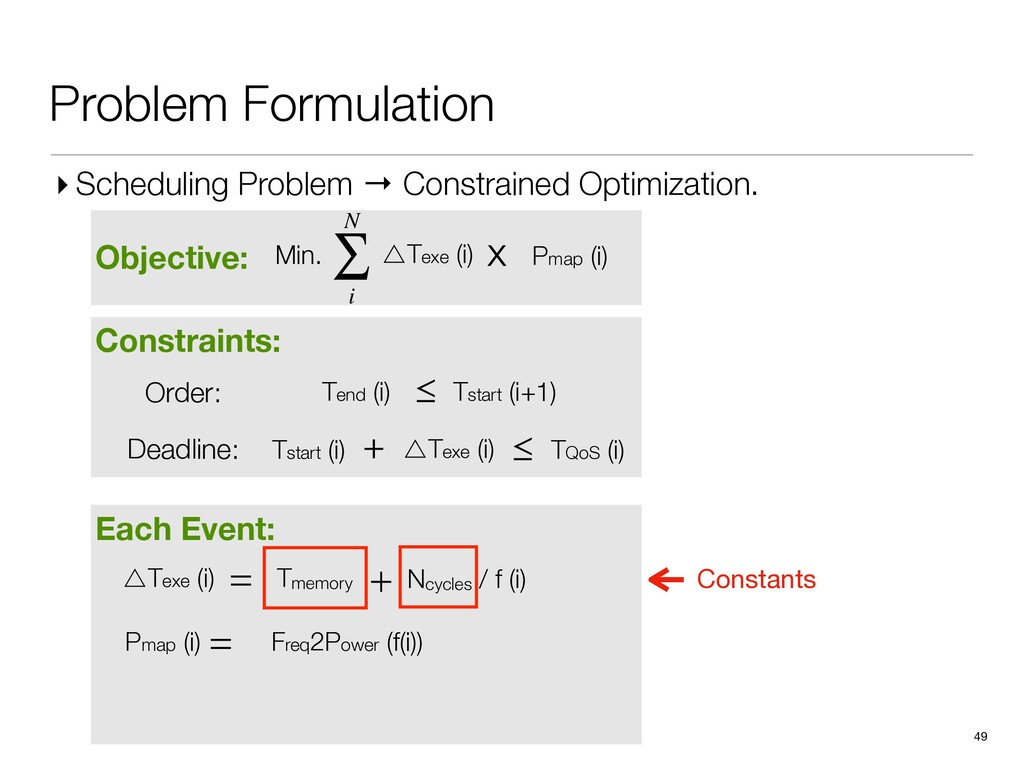
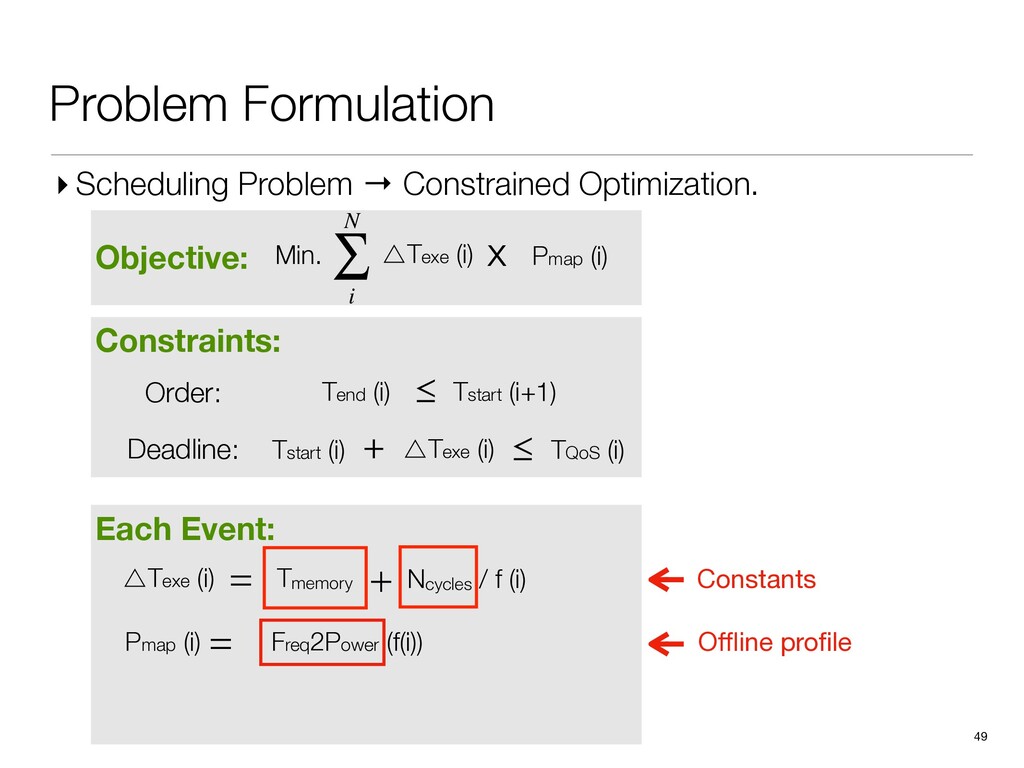
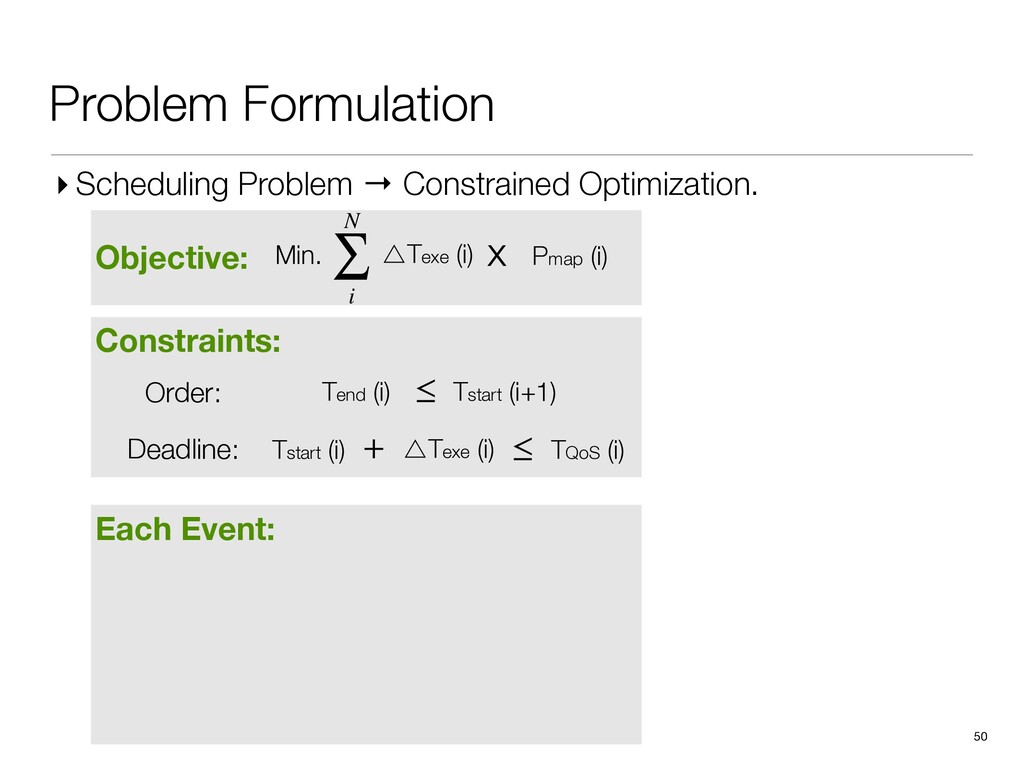
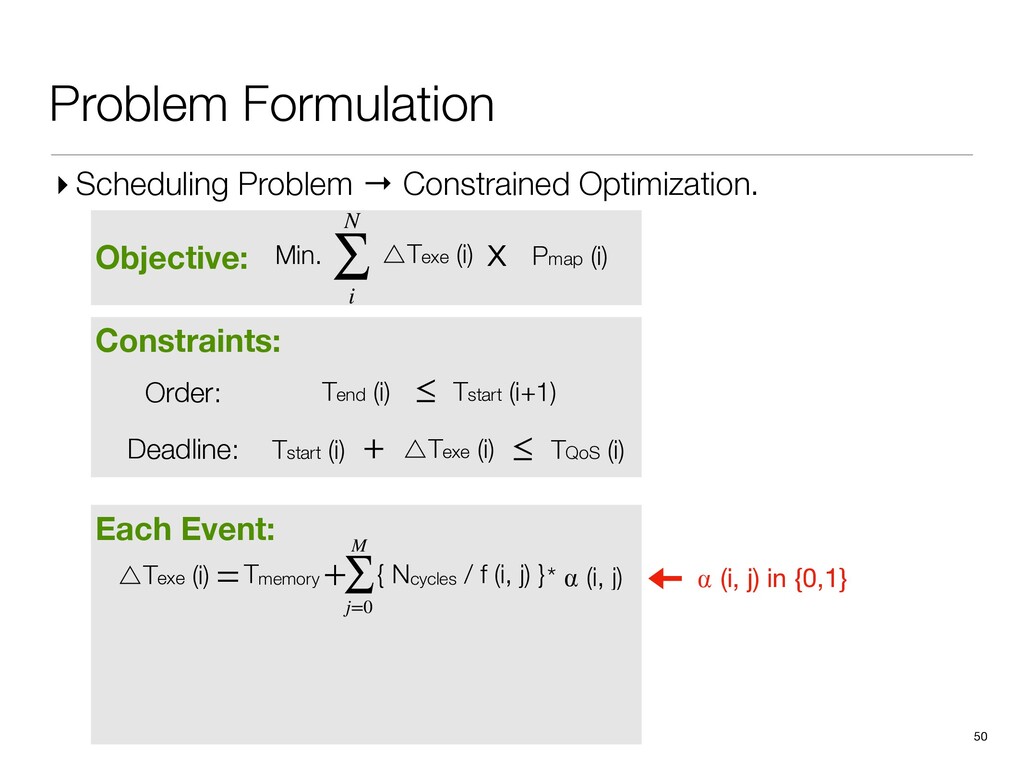
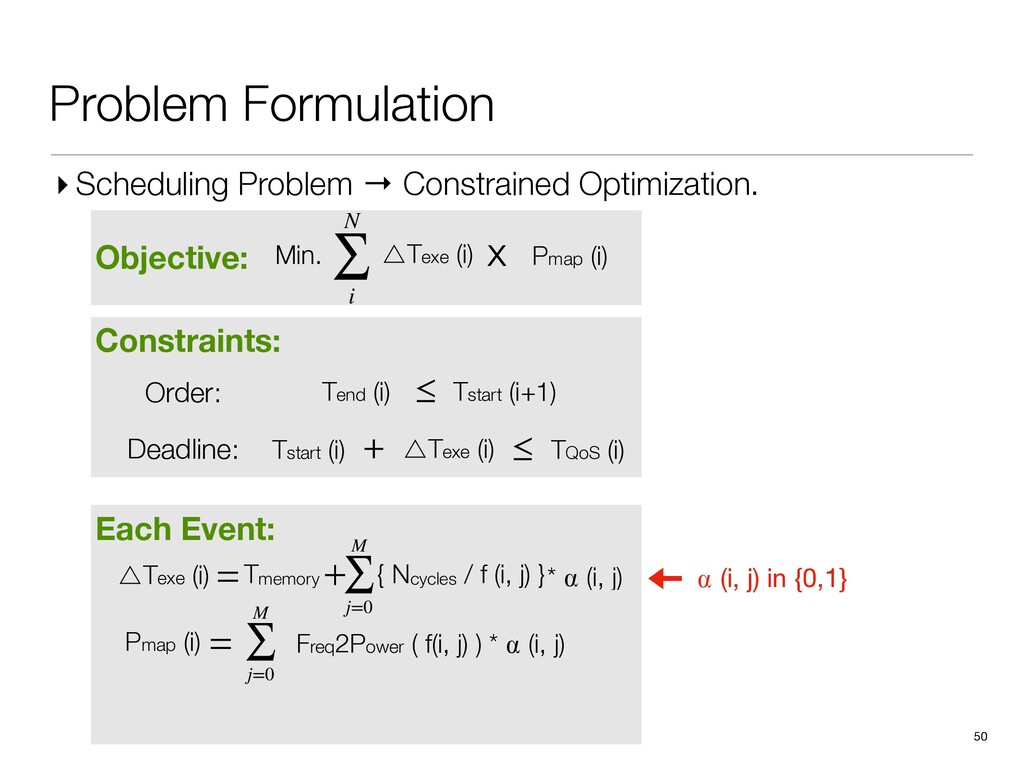
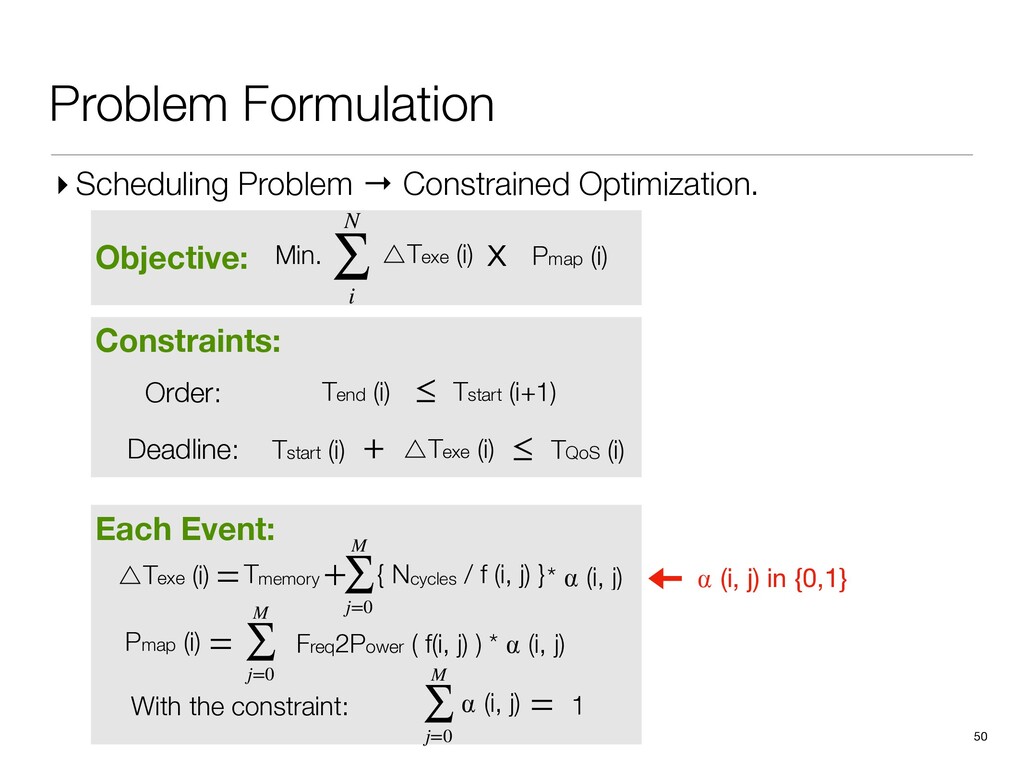
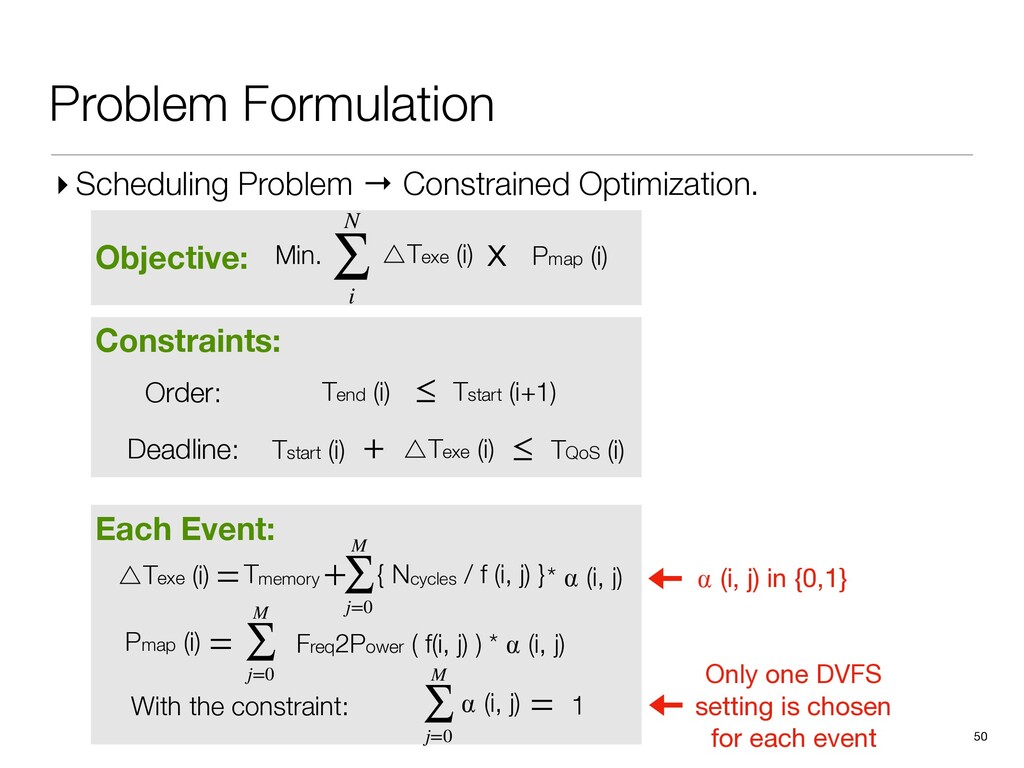
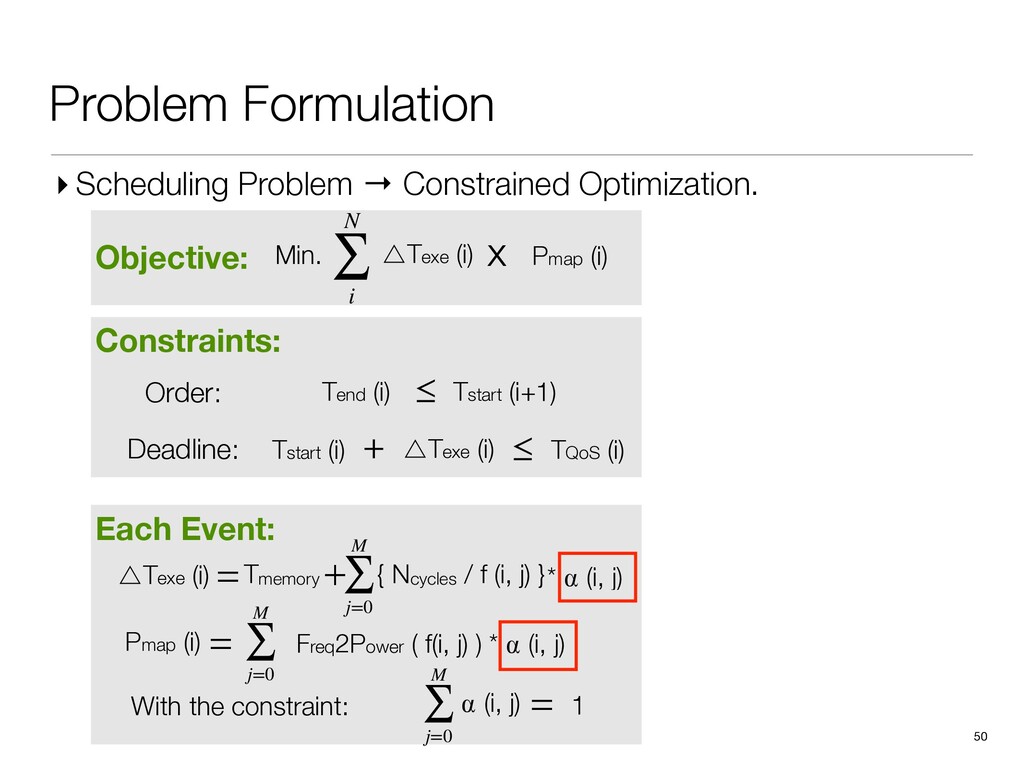
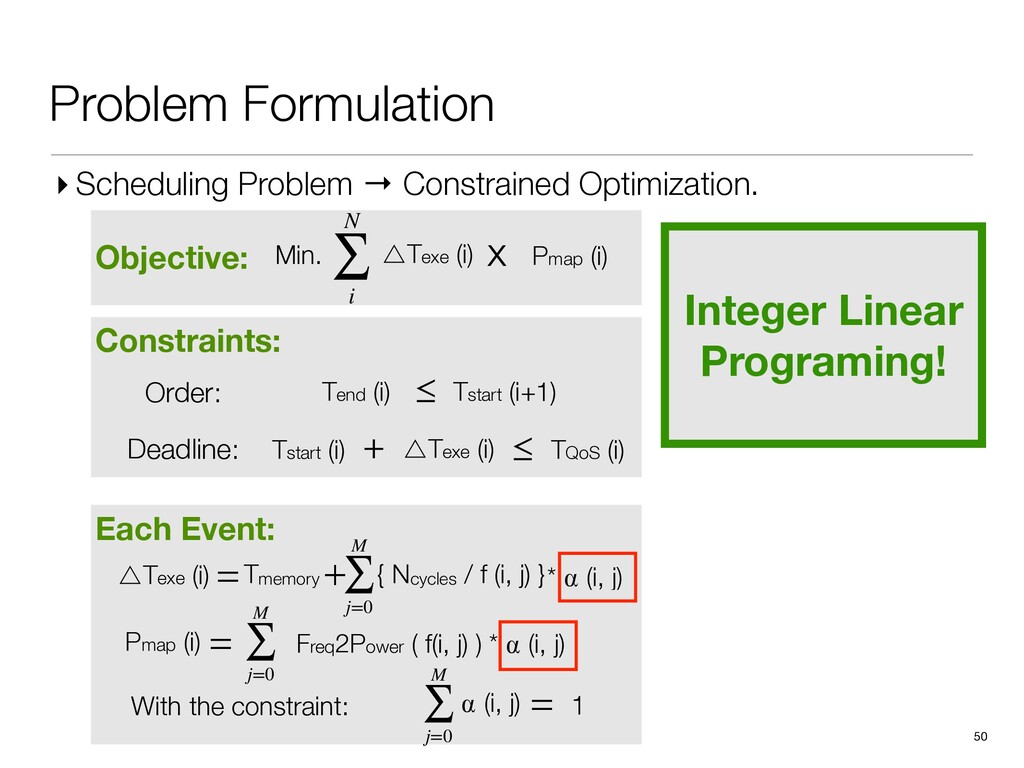
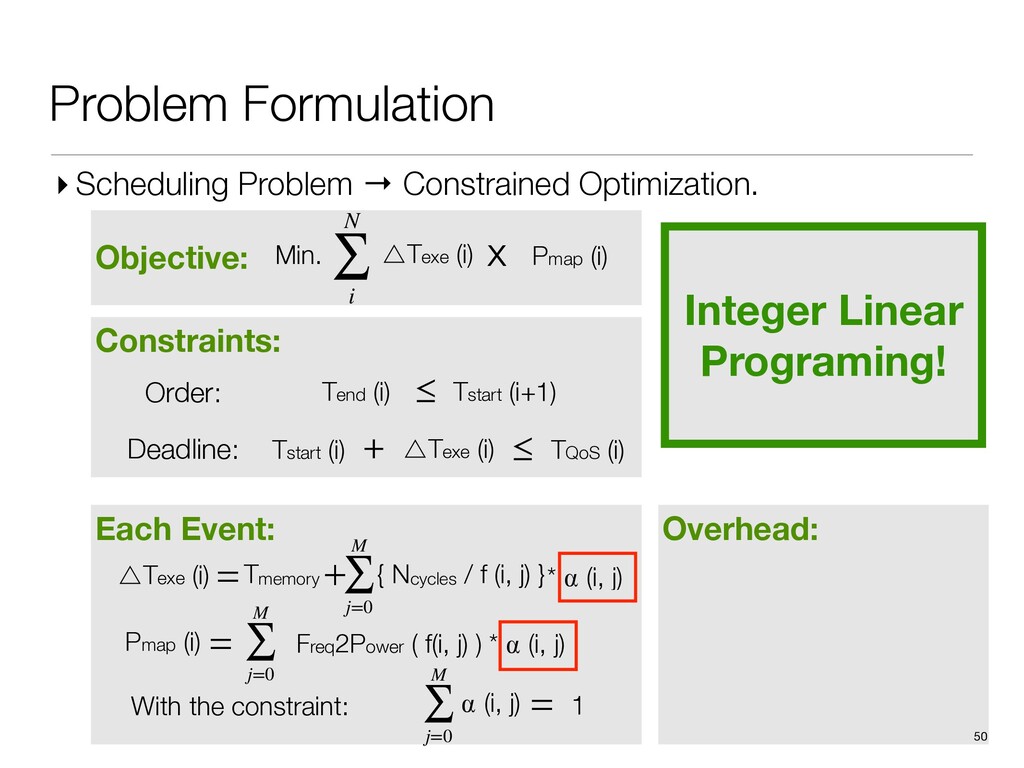
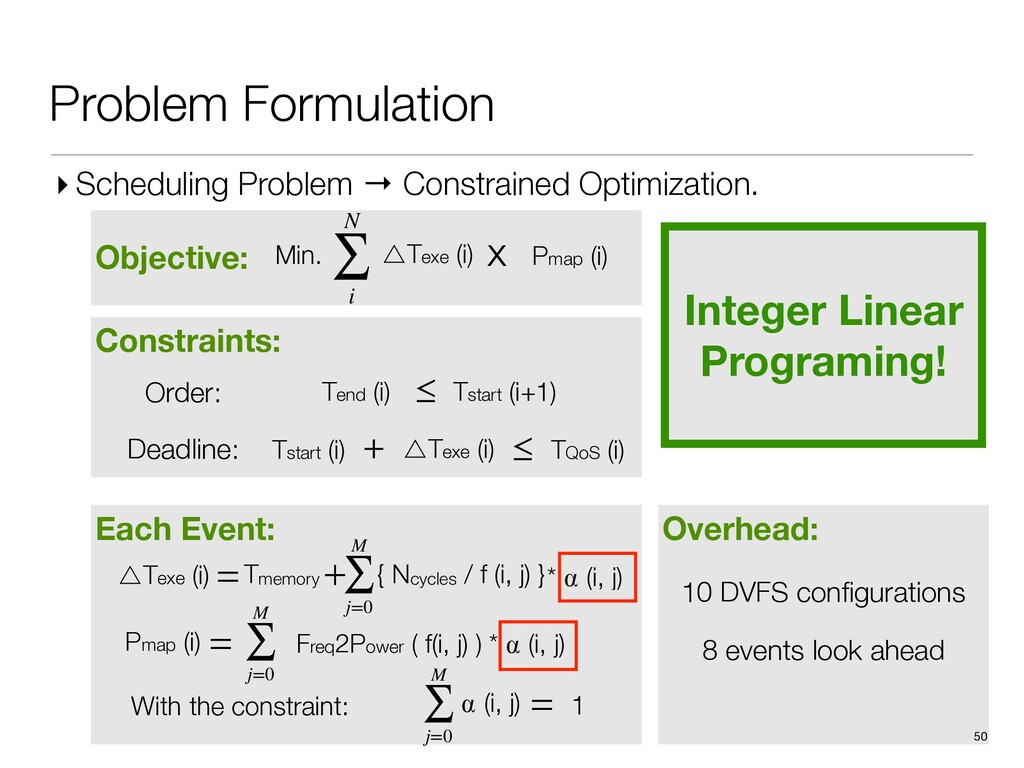
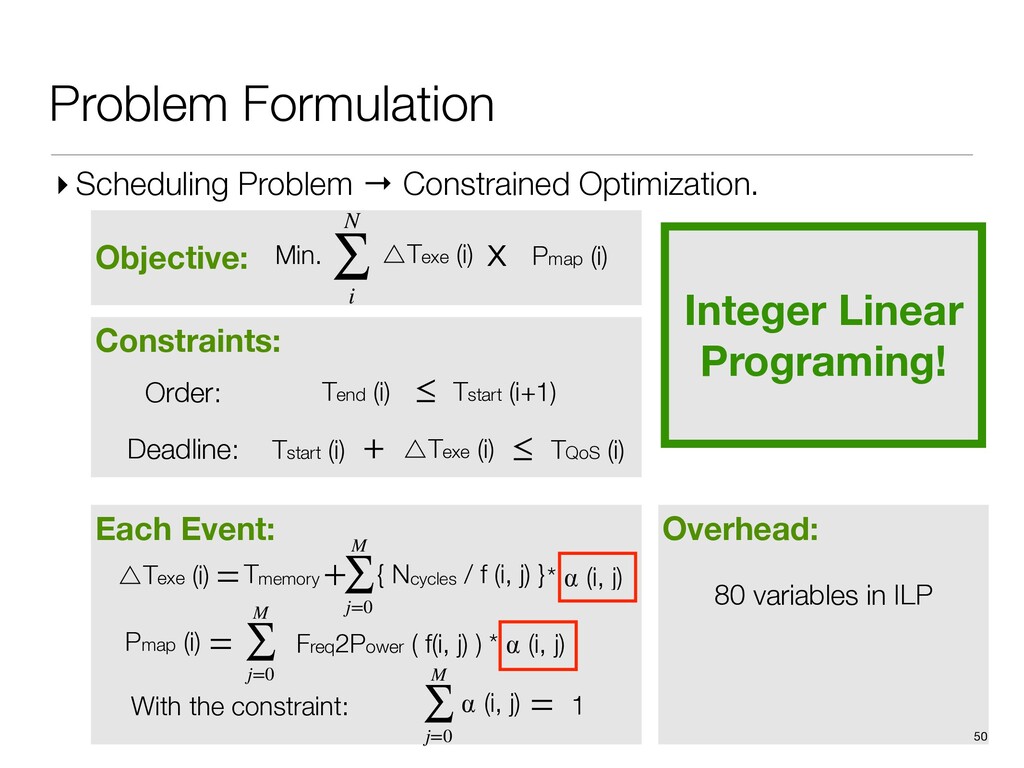
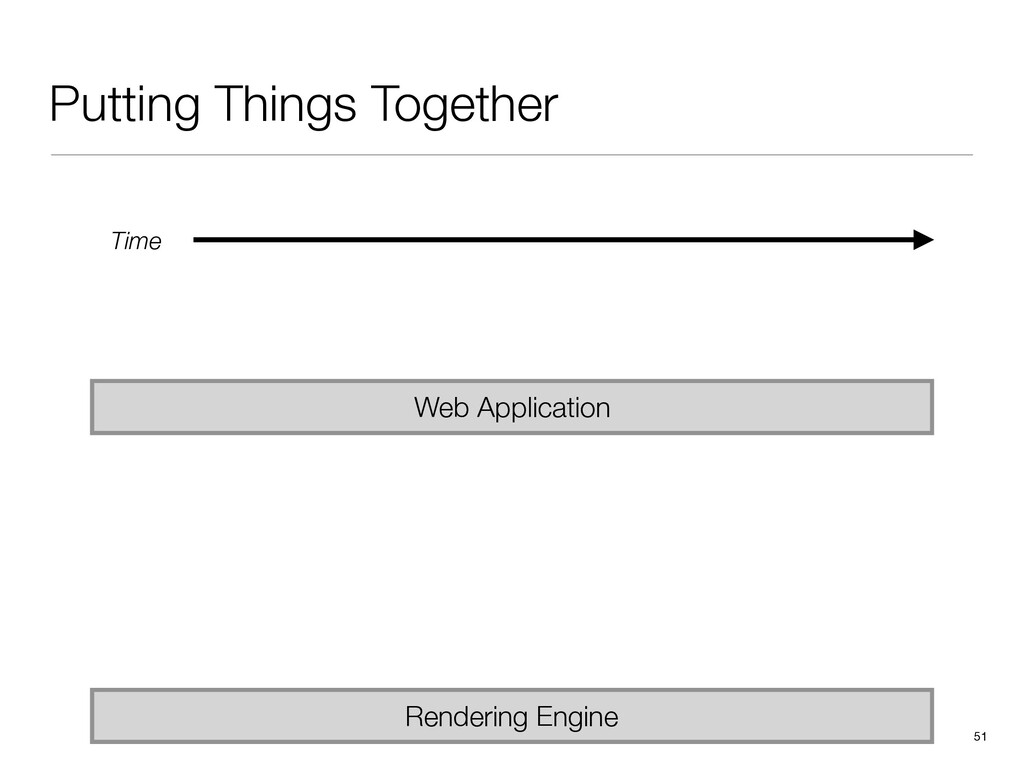
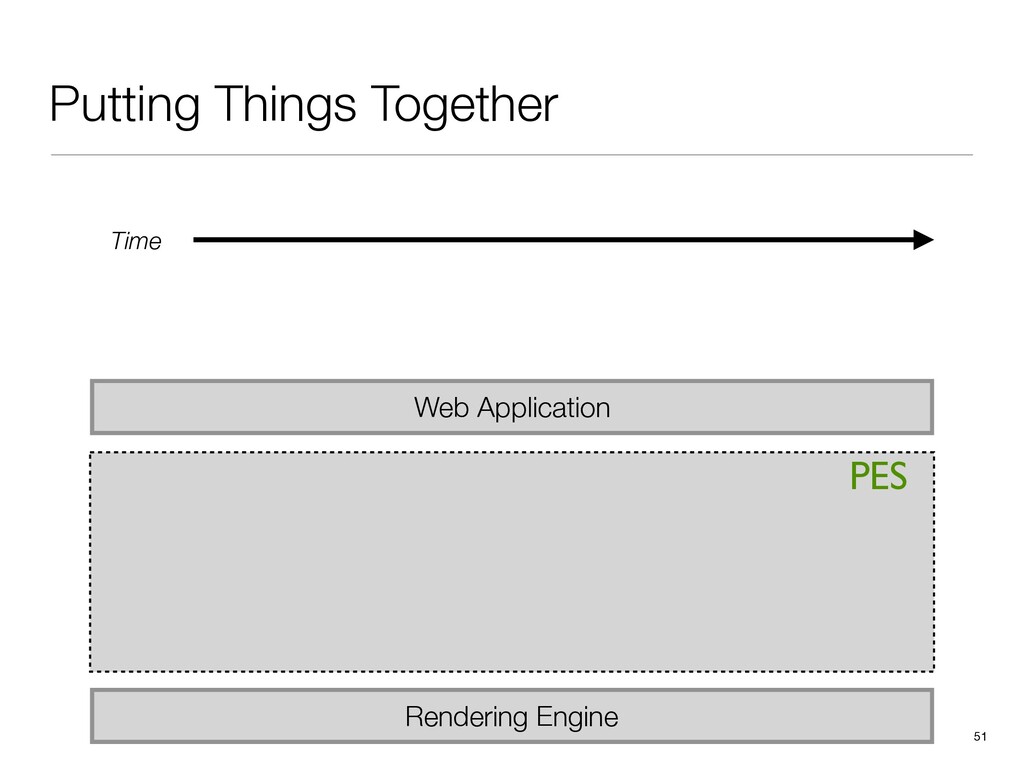
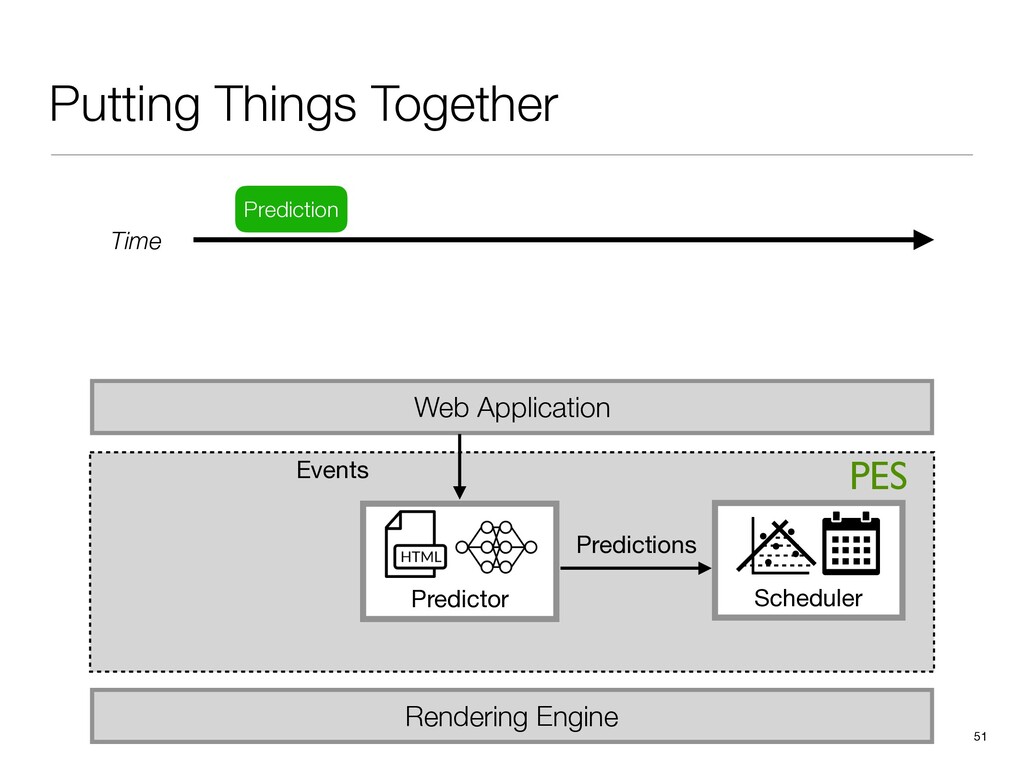
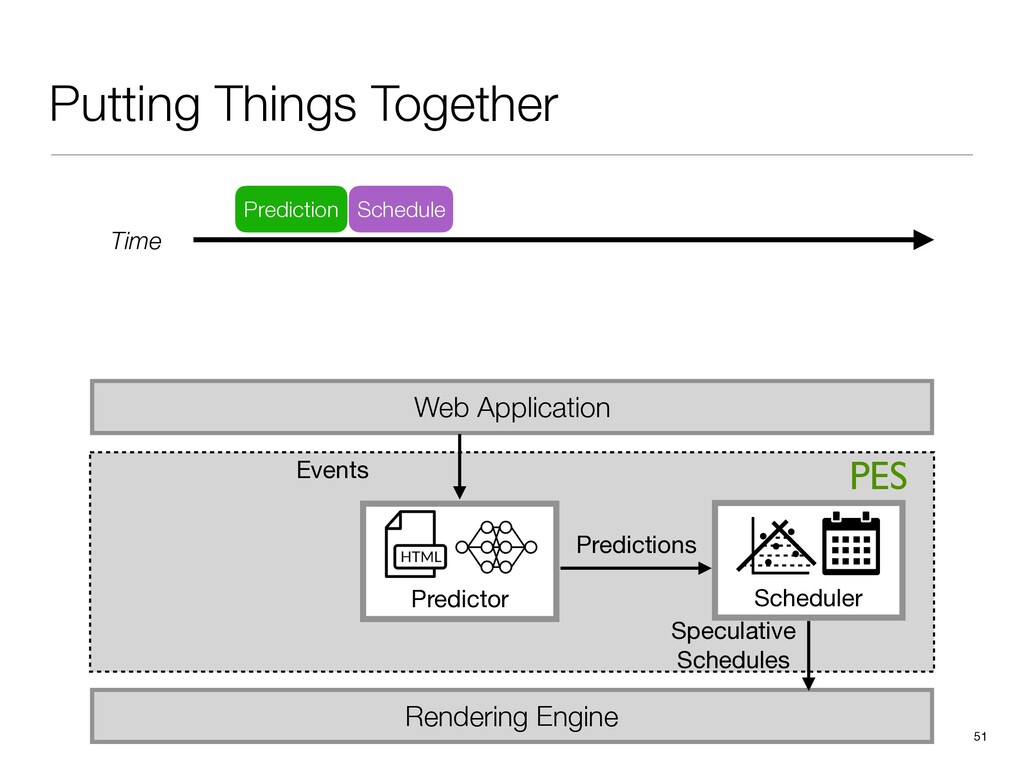
optimizations 18 ▸ Mechanism: Provide just enough energy to meet QoE requirement for different events ▸ Implementation: Map events to different heterogeneous hardware configurations Event-based Web Runtime Optimization
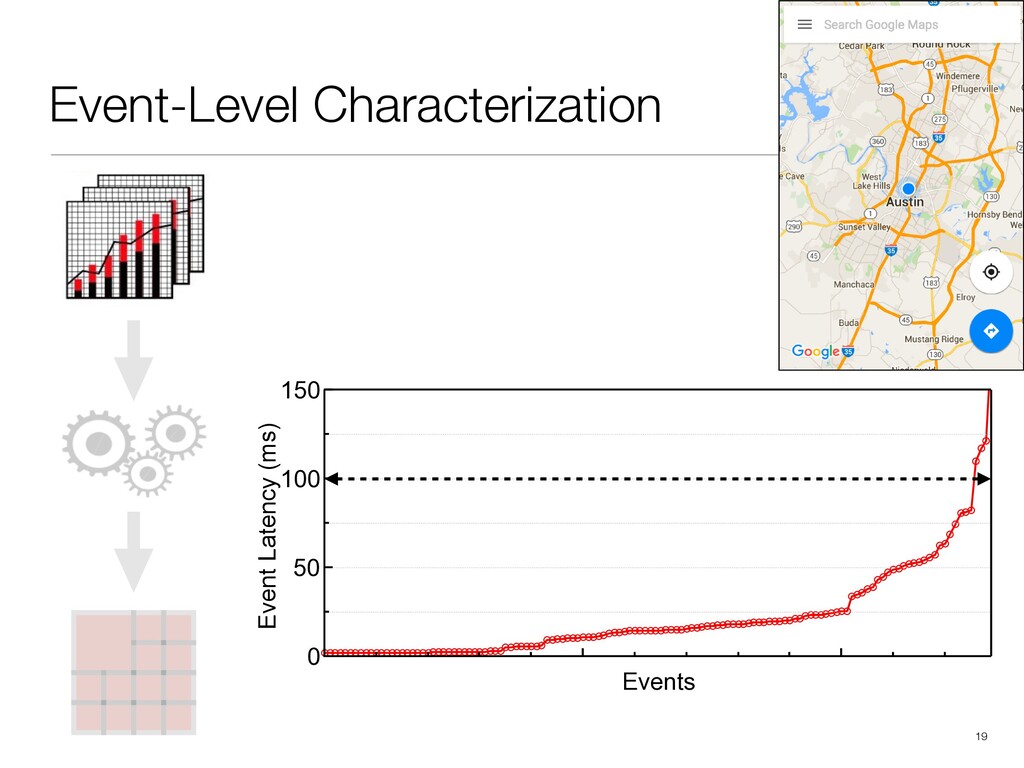
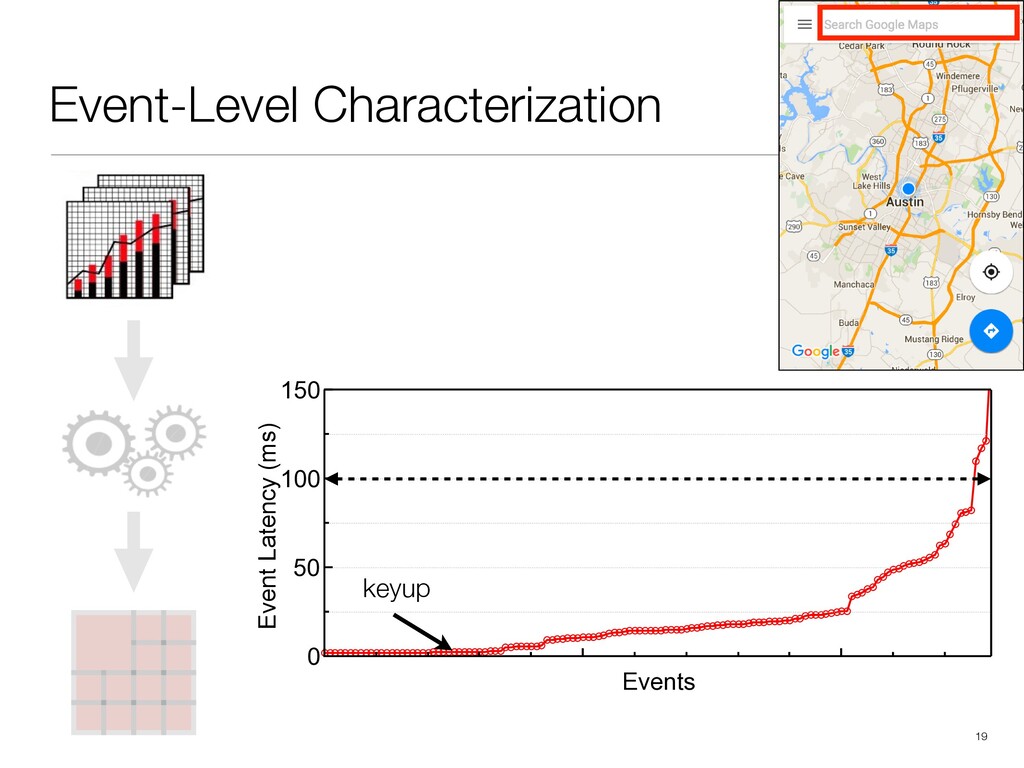
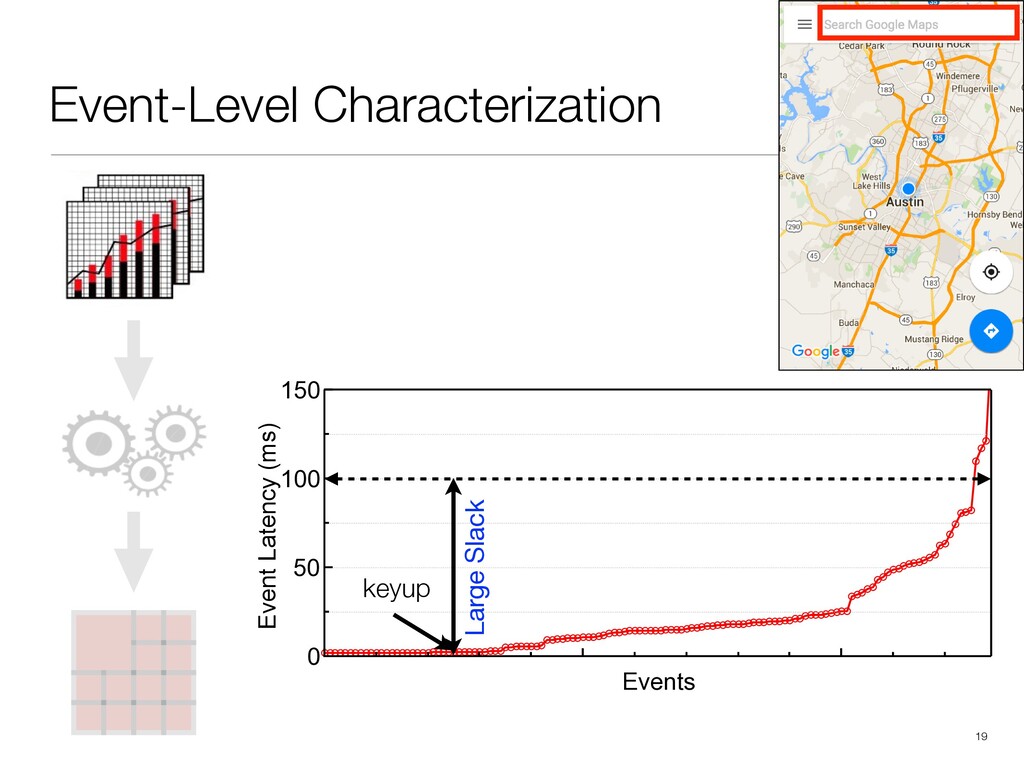
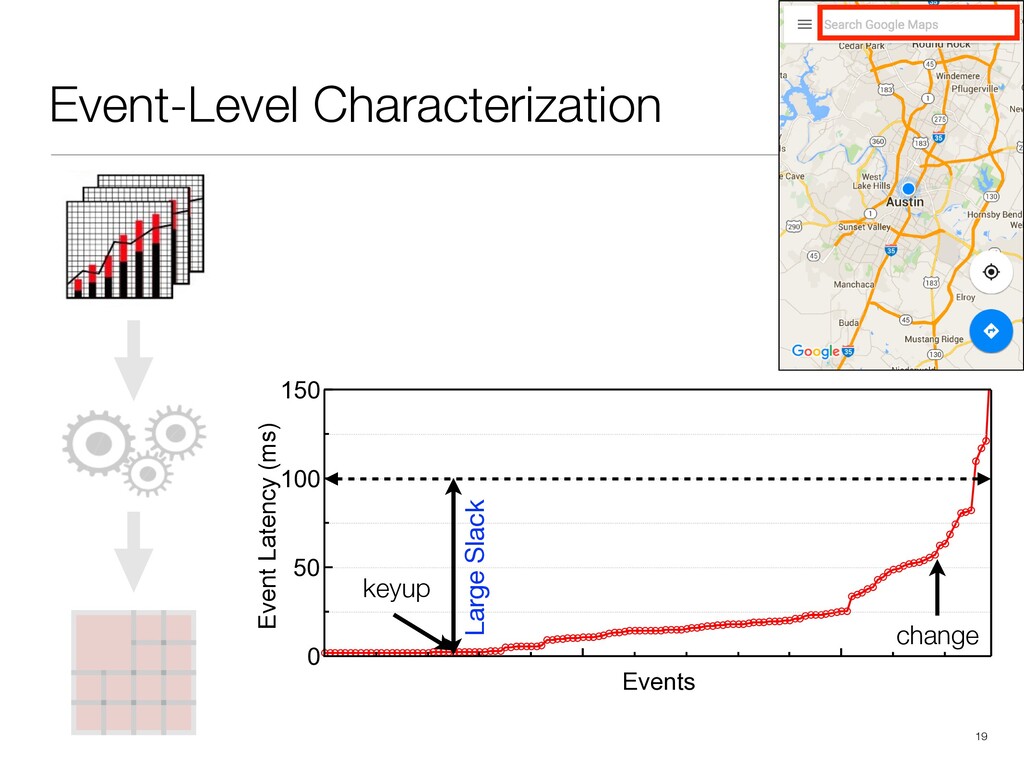
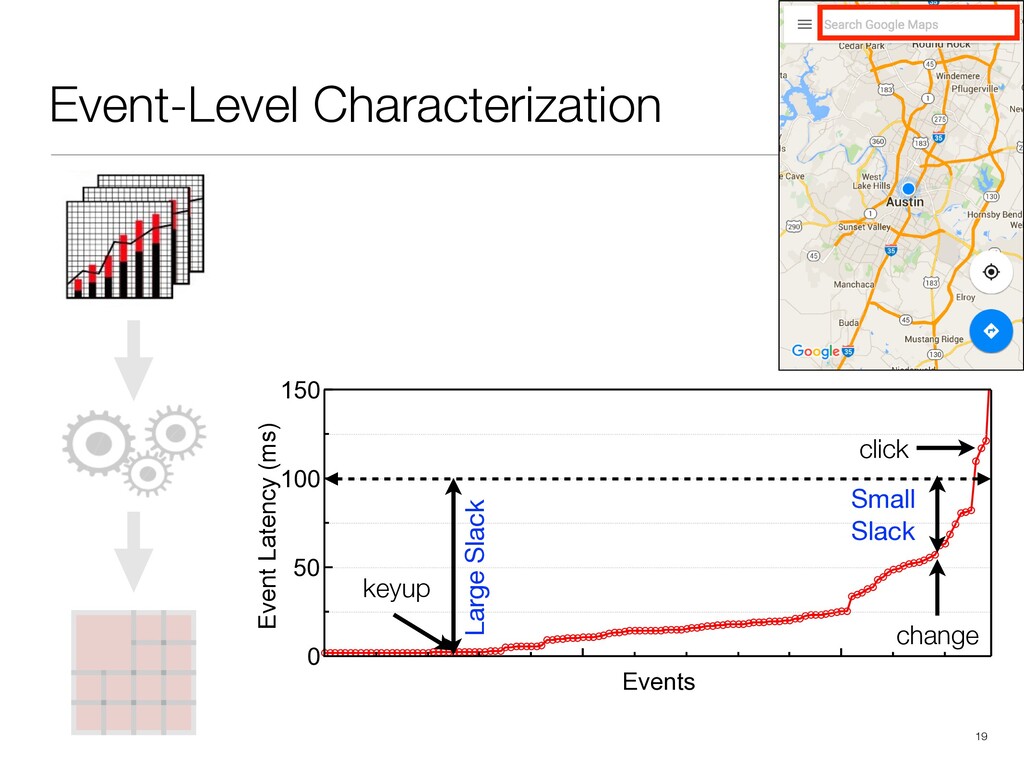
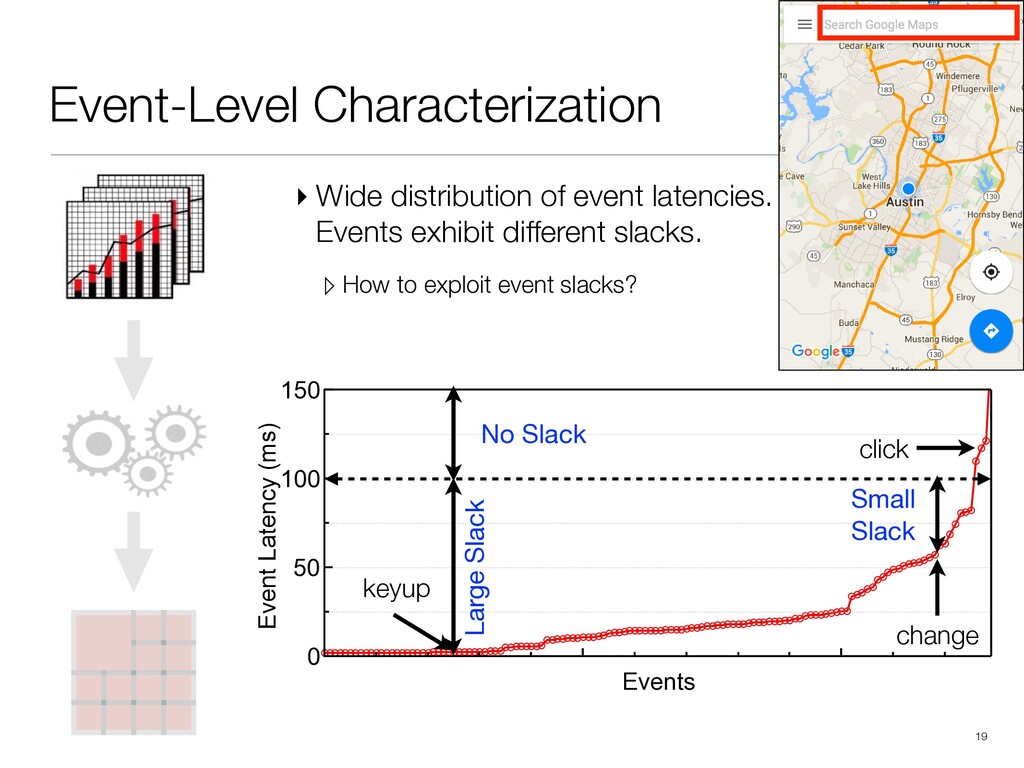
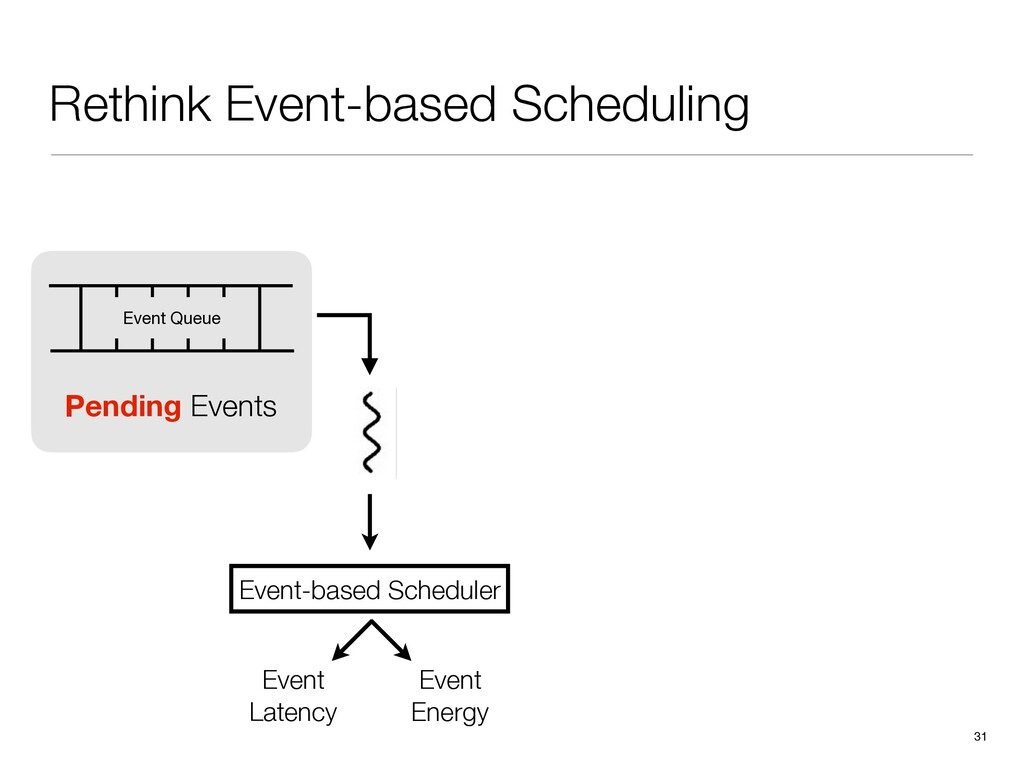
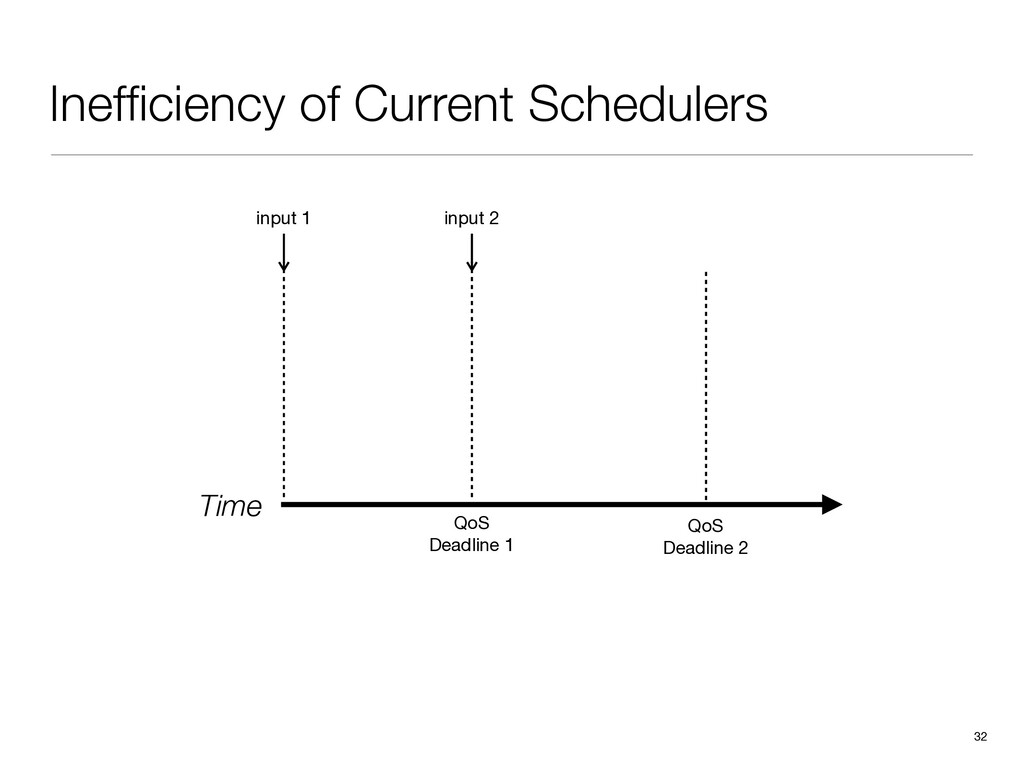
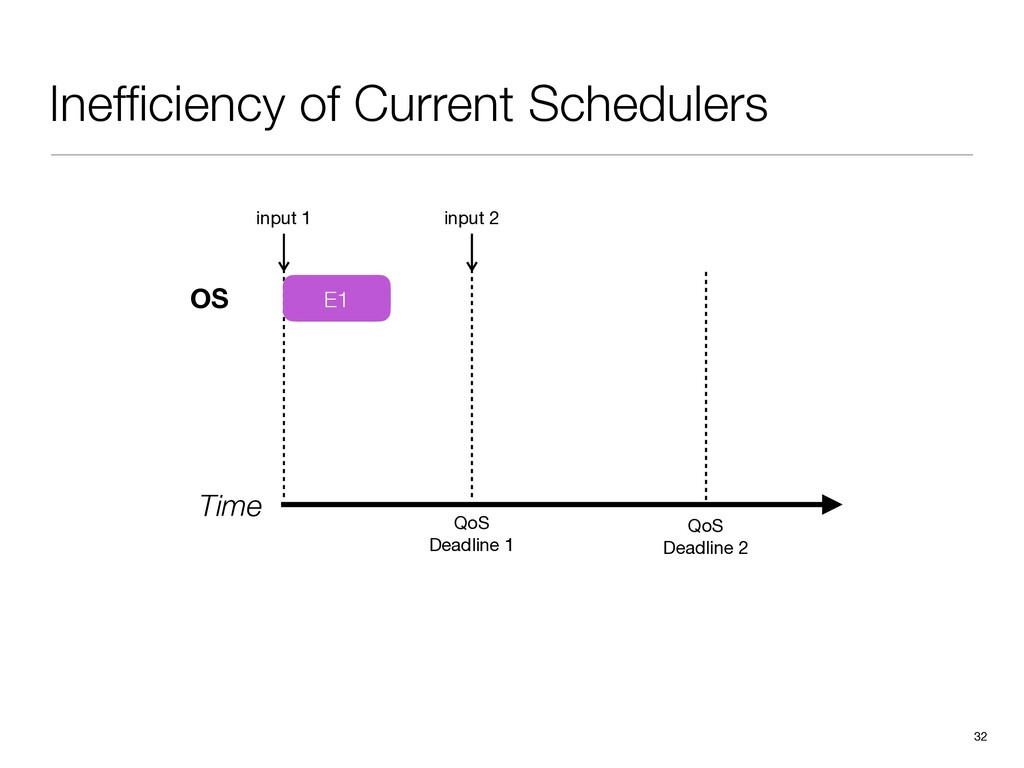
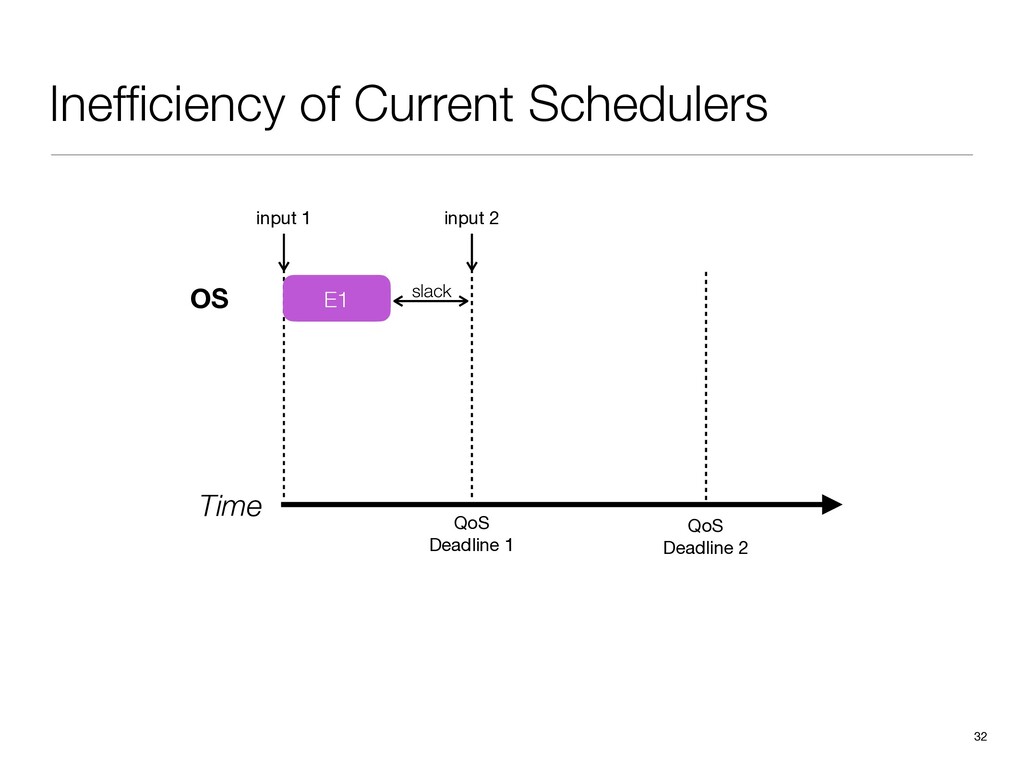
Events Large Slack change Small Slack No Slack click keyup ▸ Wide distribution of event latencies. Events exhibit different slacks. ▹ How to exploit event slacks?
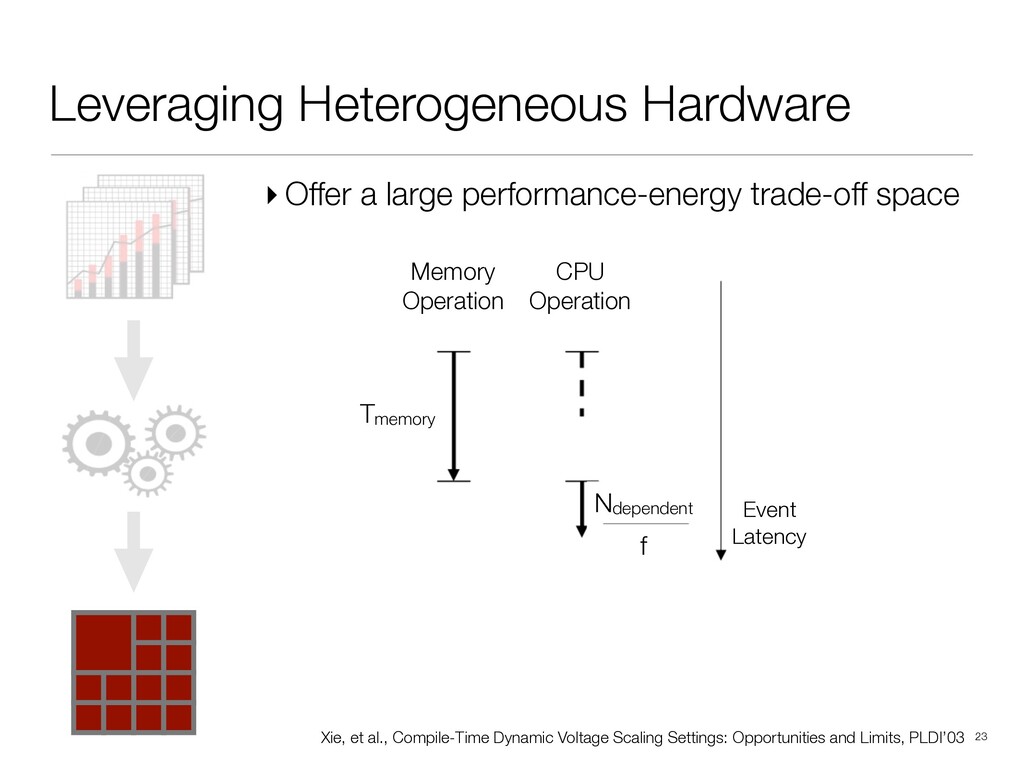
space Memory Operation CPU Operation Tmemory Ndependent f Event Latency Xie, et al., Compile-Time Dynamic Voltage Scaling Settings: Opportunities and Limits, PLDI’03
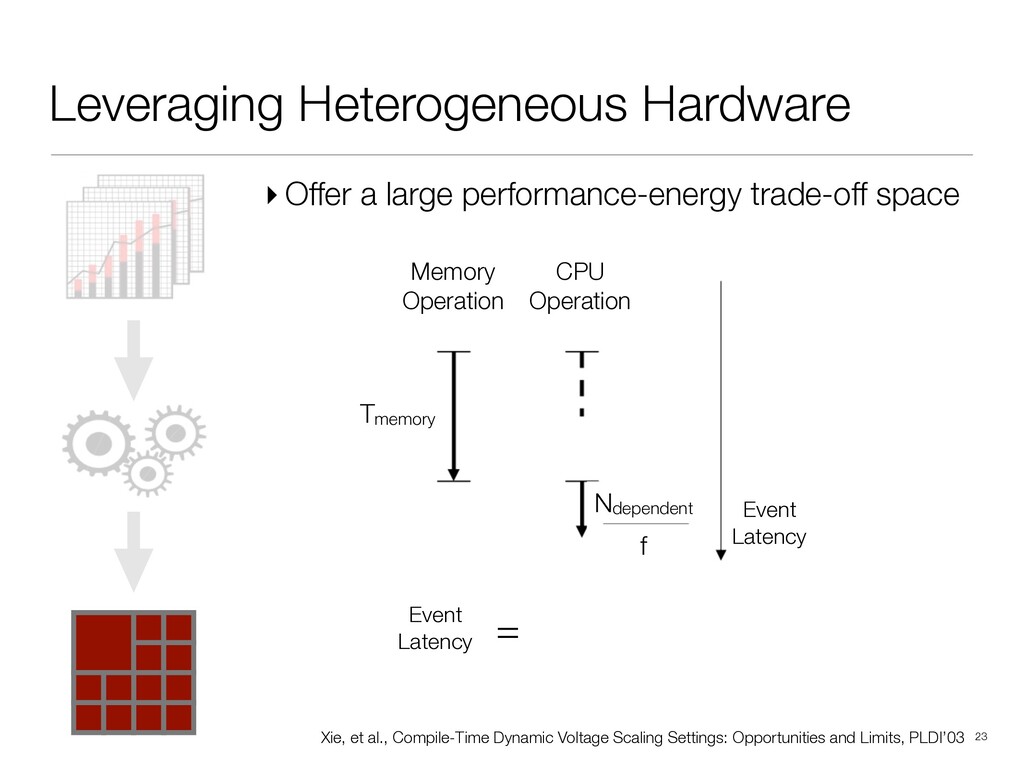
space Memory Operation CPU Operation Tmemory Ndependent f Event Latency Xie, et al., Compile-Time Dynamic Voltage Scaling Settings: Opportunities and Limits, PLDI’03 Event Latency =
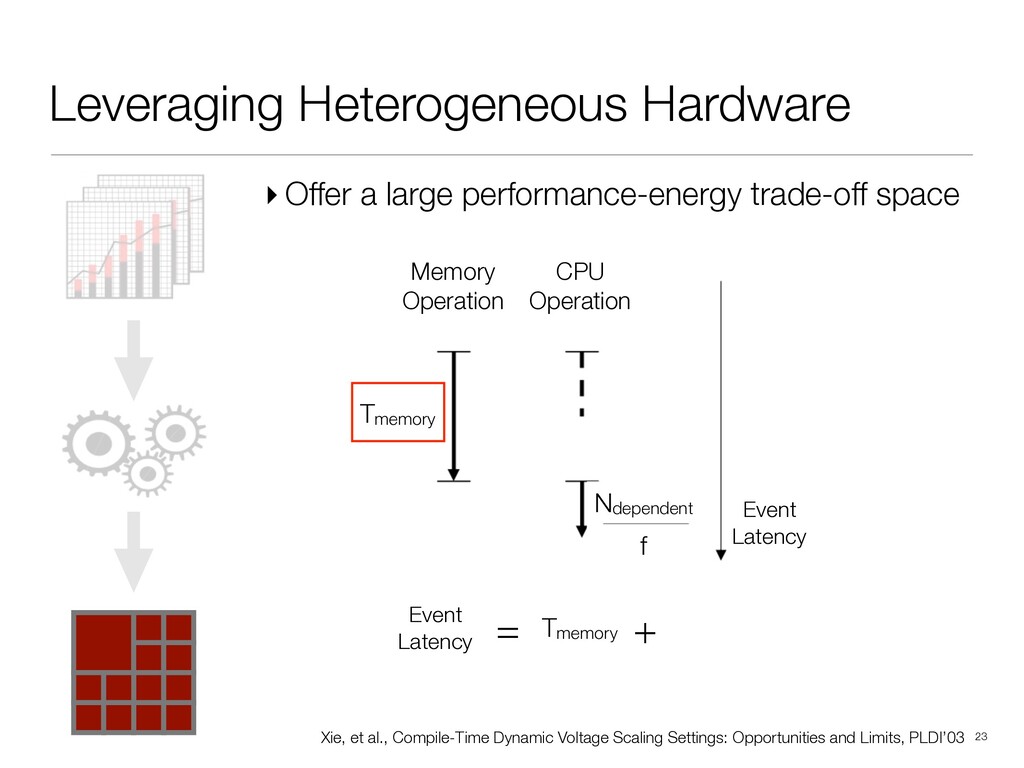
space Memory Operation CPU Operation Tmemory Ndependent f Event Latency Xie, et al., Compile-Time Dynamic Voltage Scaling Settings: Opportunities and Limits, PLDI’03 Event Latency = Tmemory +
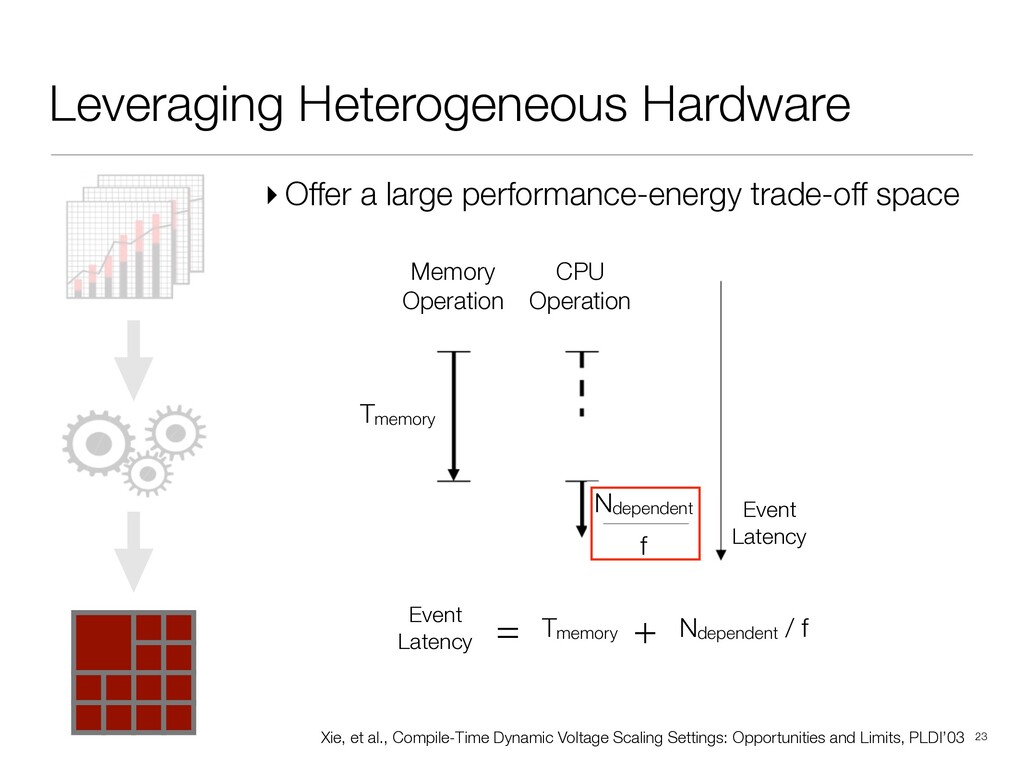
space Memory Operation CPU Operation Tmemory Ndependent f Event Latency Xie, et al., Compile-Time Dynamic Voltage Scaling Settings: Opportunities and Limits, PLDI’03 Event Latency = Tmemory + Ndependent / f
space Memory Operation CPU Operation Tmemory Ndependent f Event Latency Xie, et al., Compile-Time Dynamic Voltage Scaling Settings: Opportunities and Limits, PLDI’03 Event Latency = Tmemory + Ndependent / f
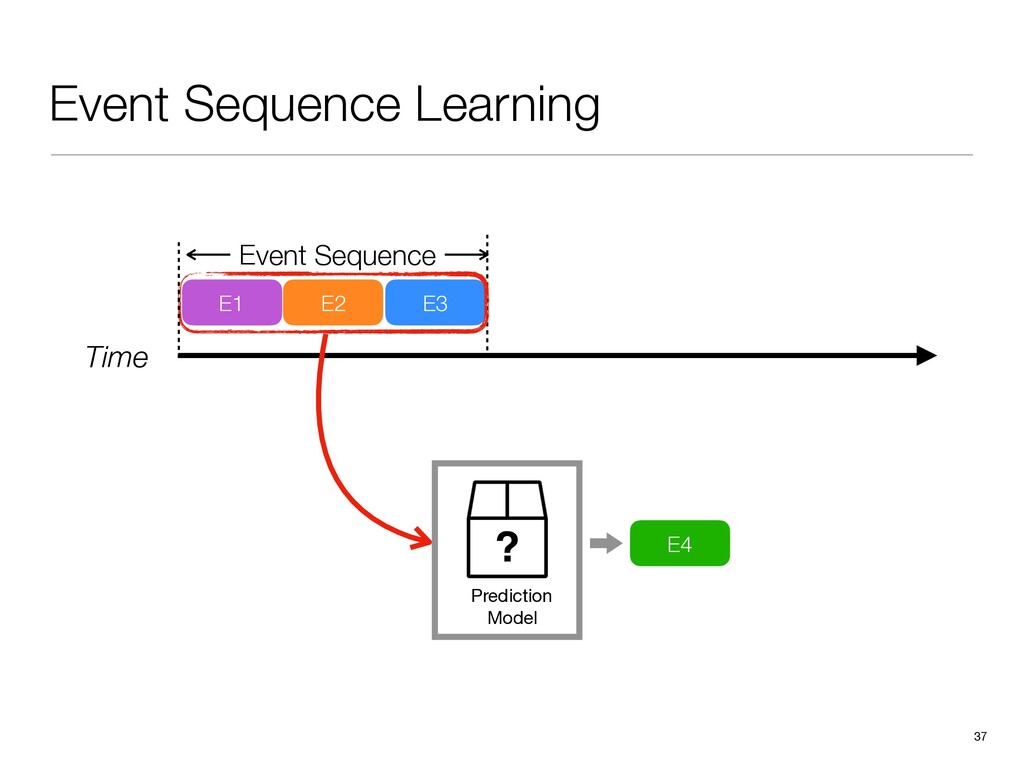
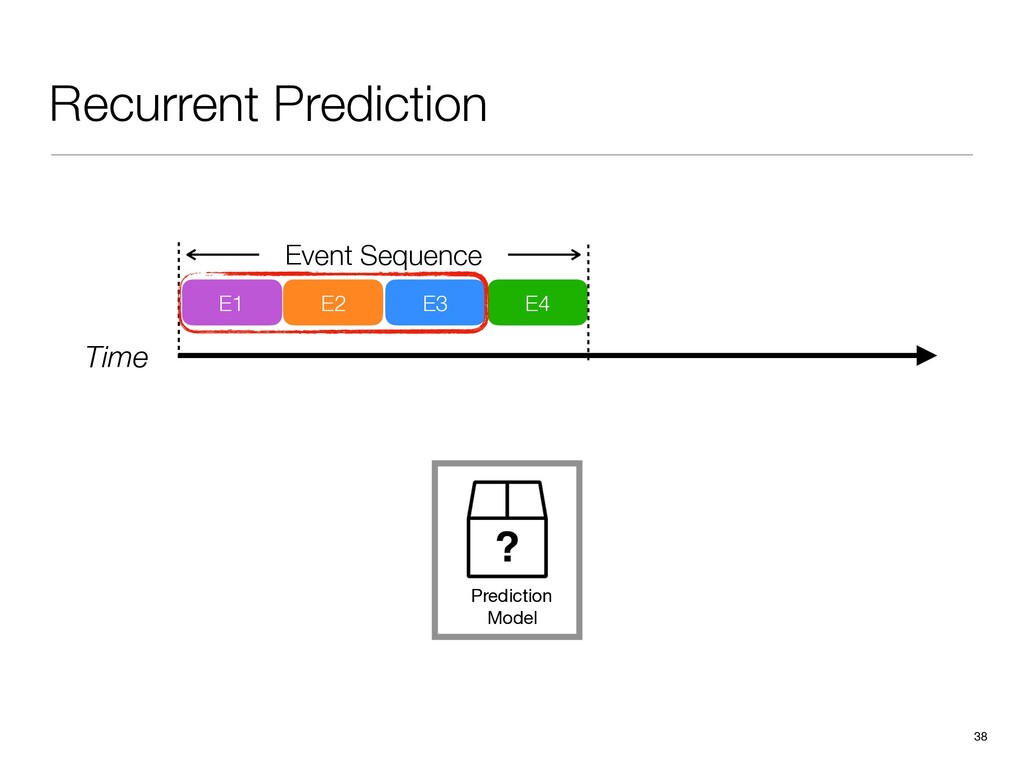
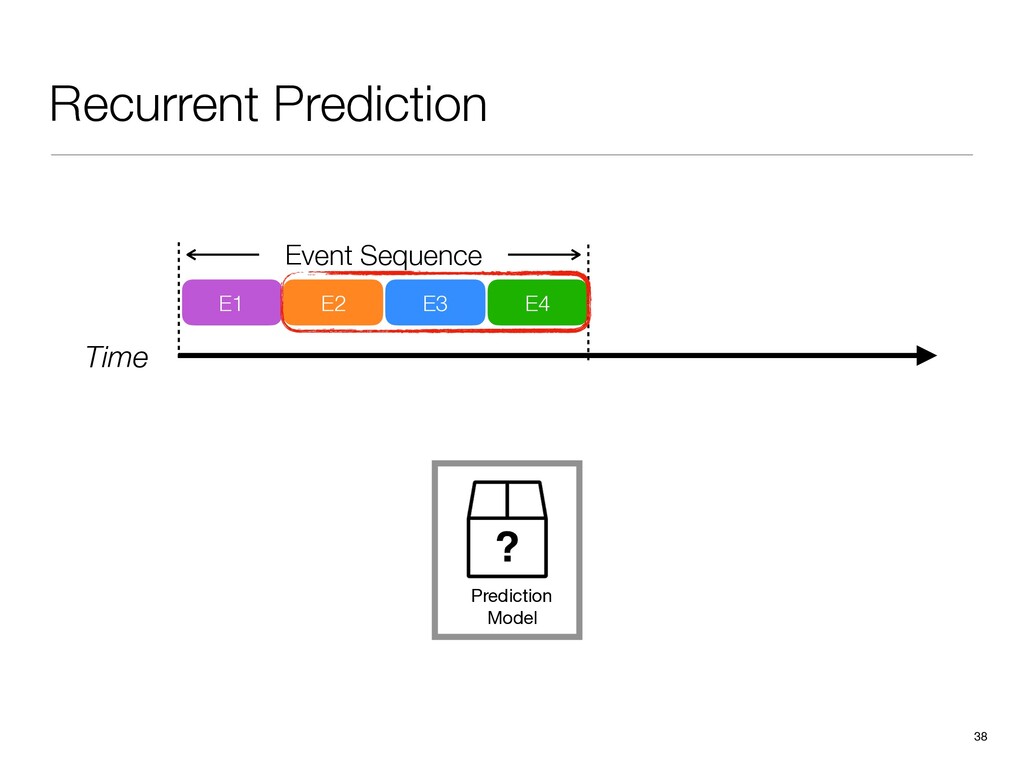
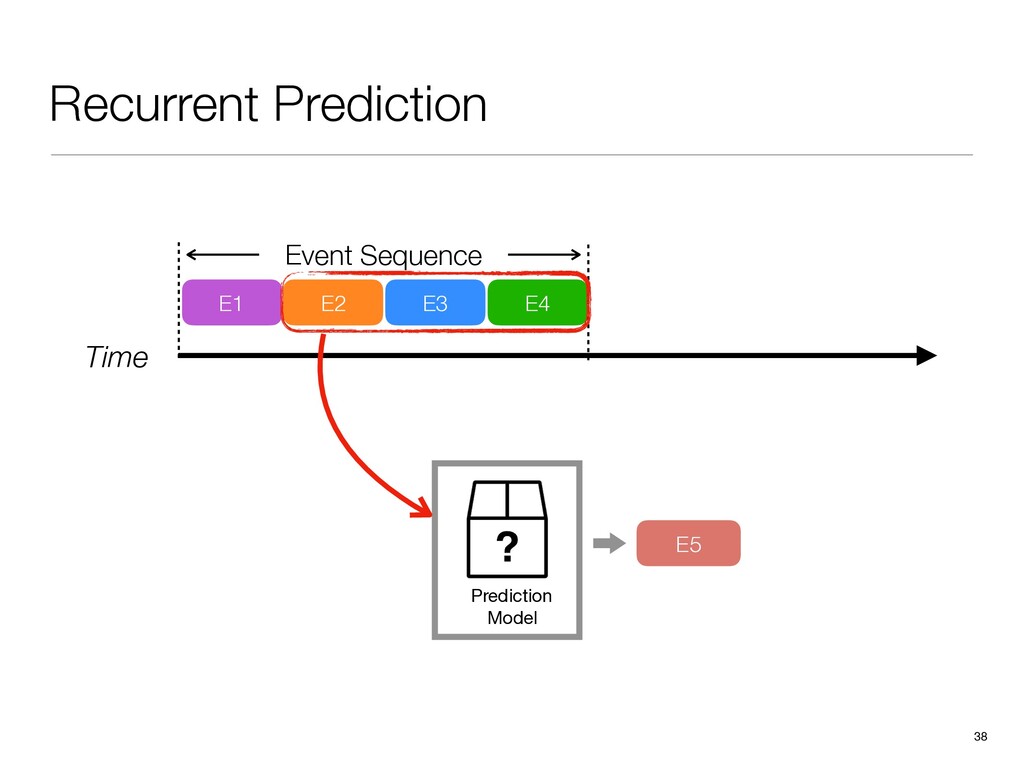
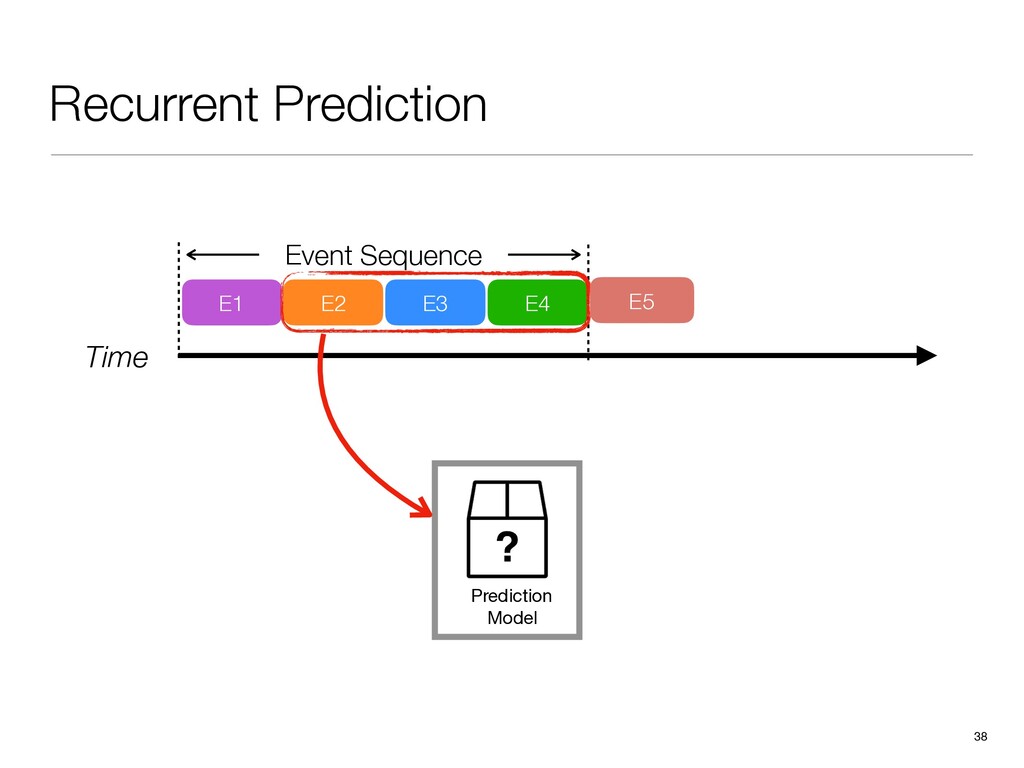
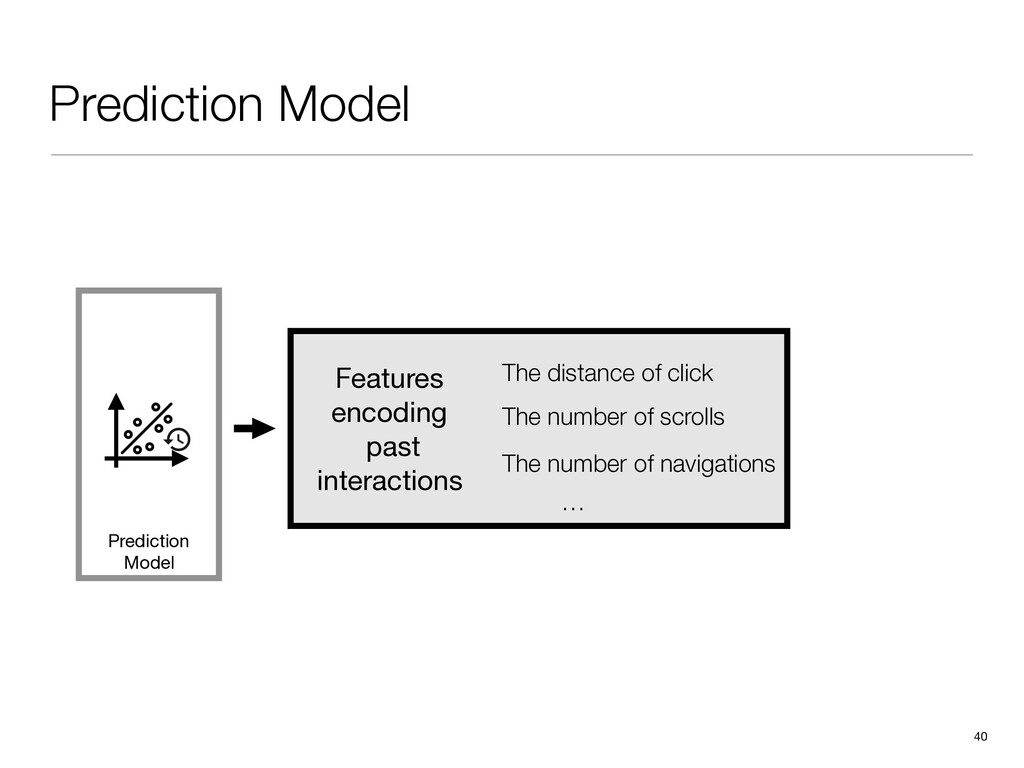
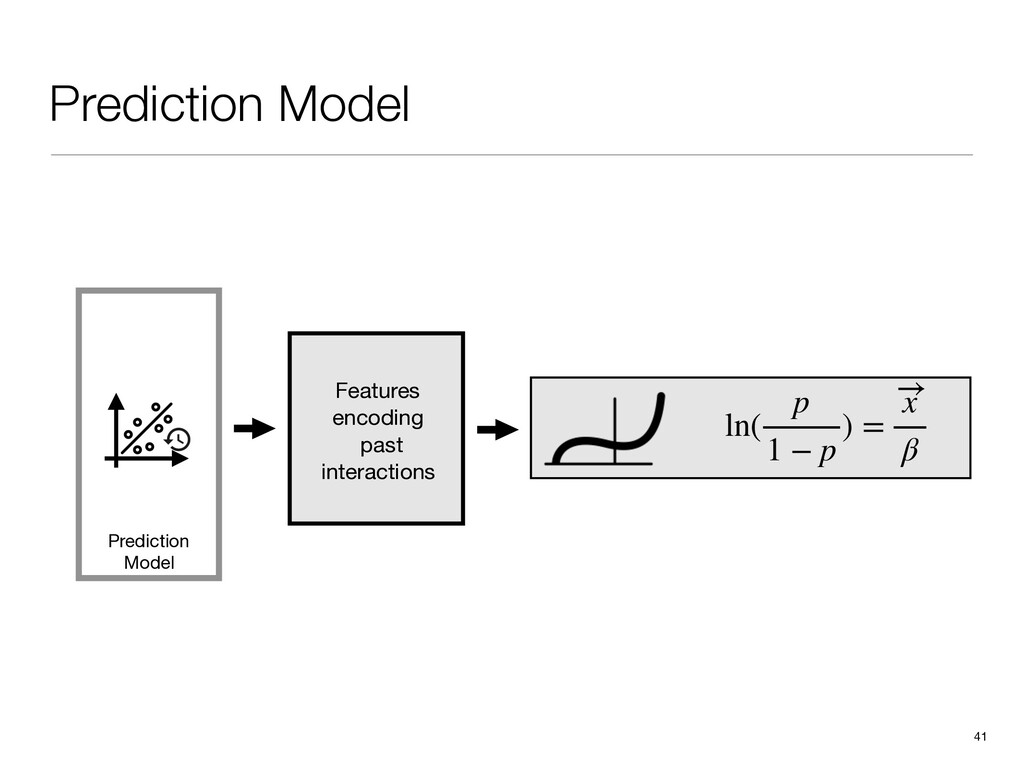
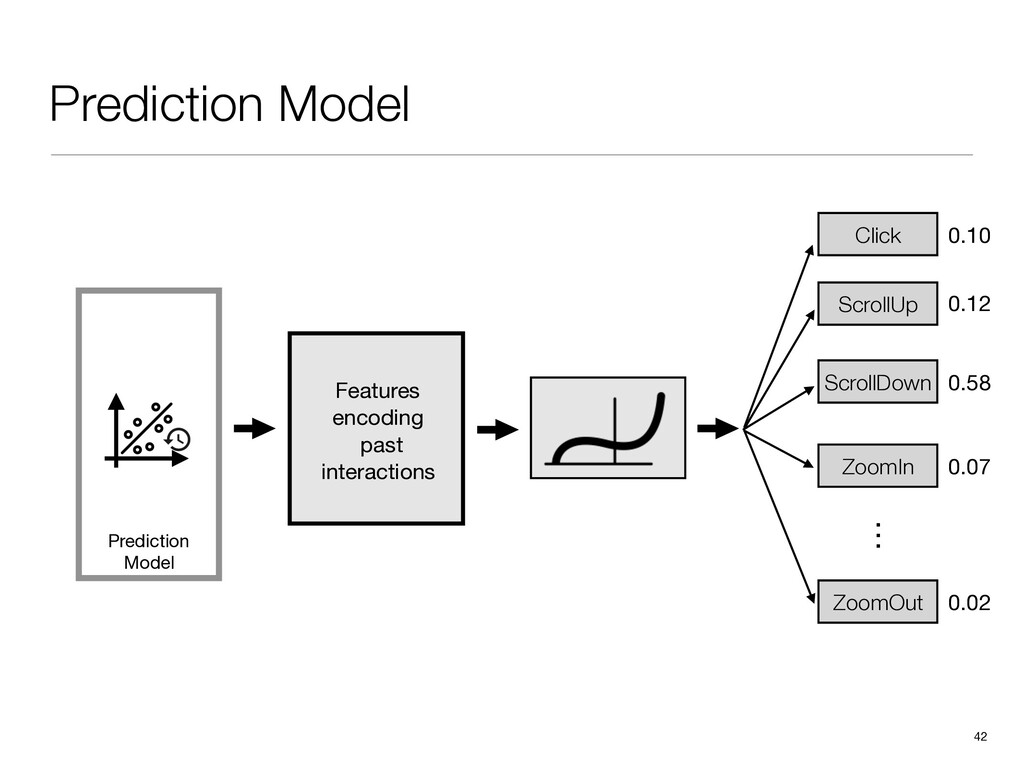
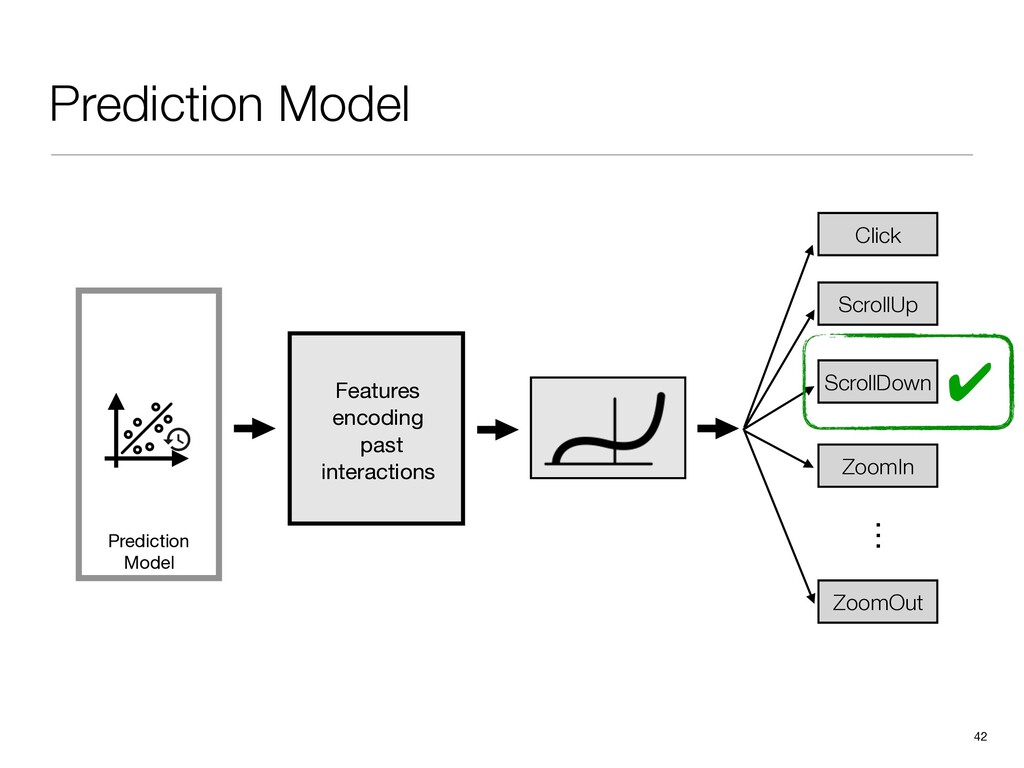
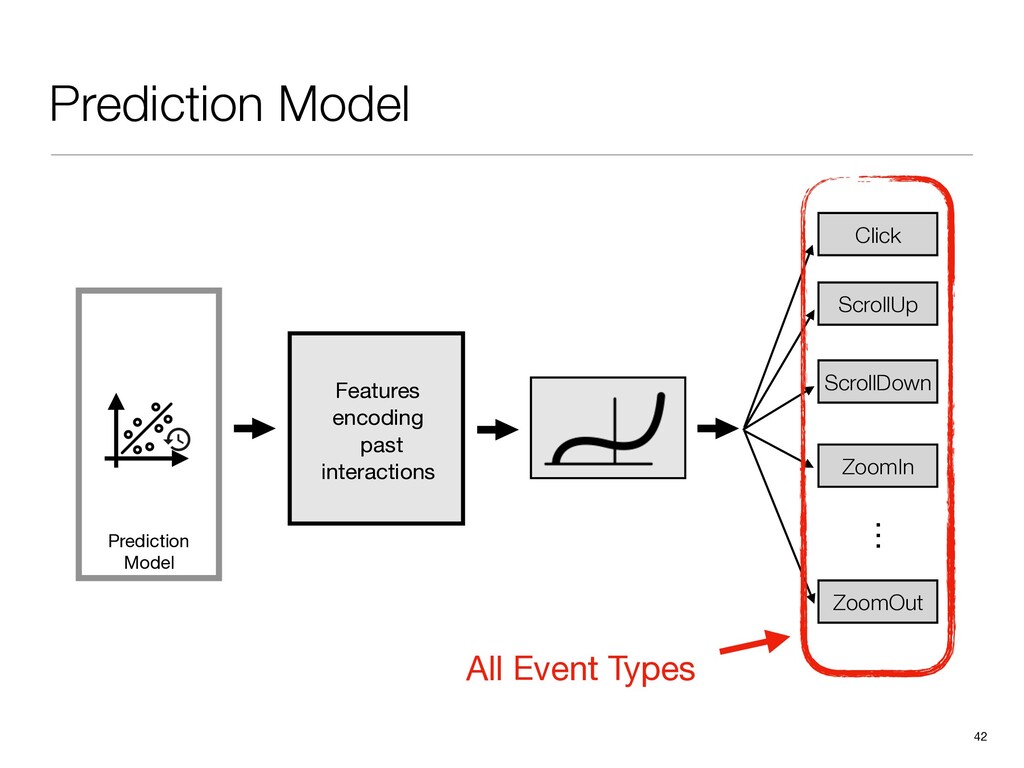
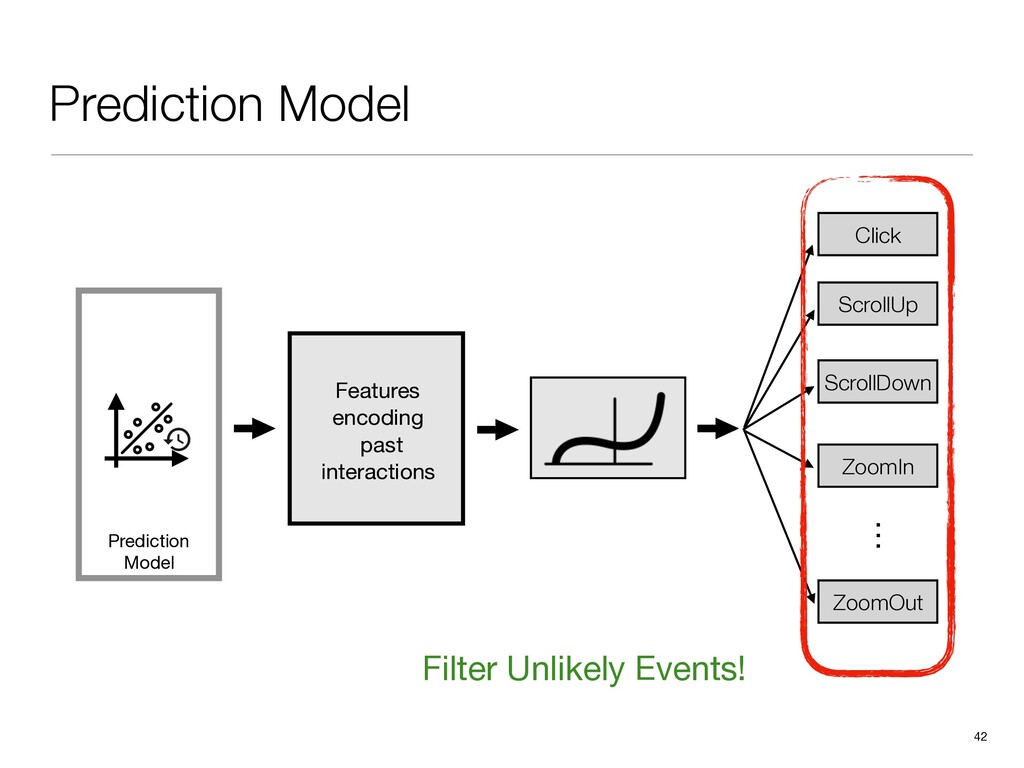
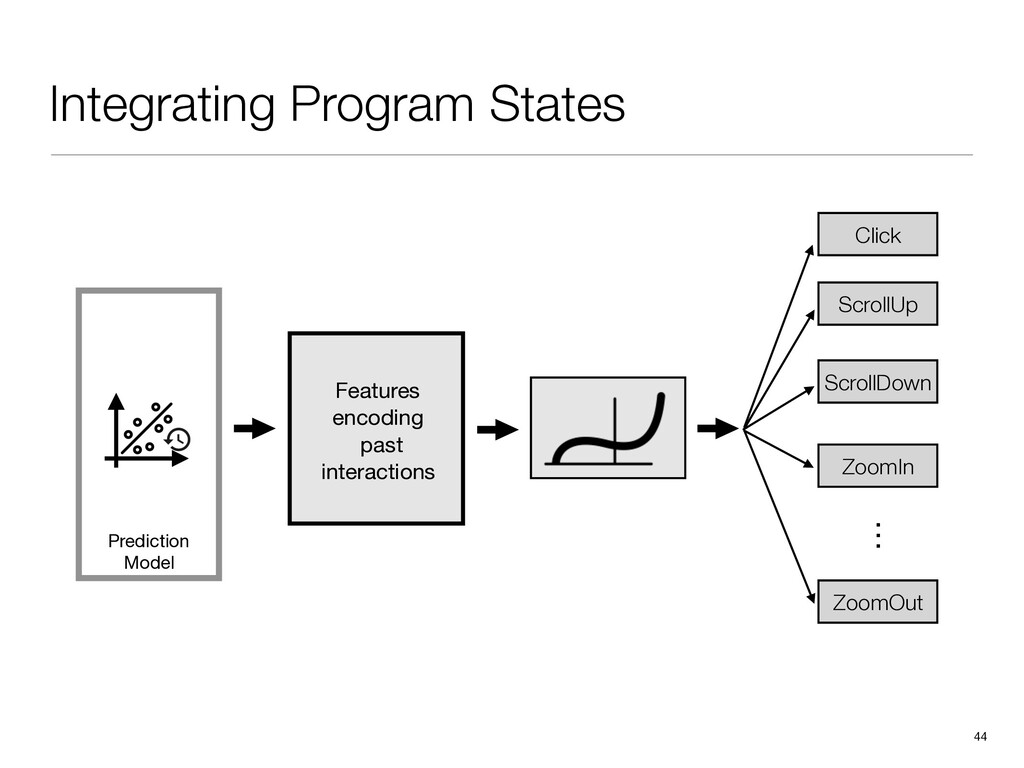
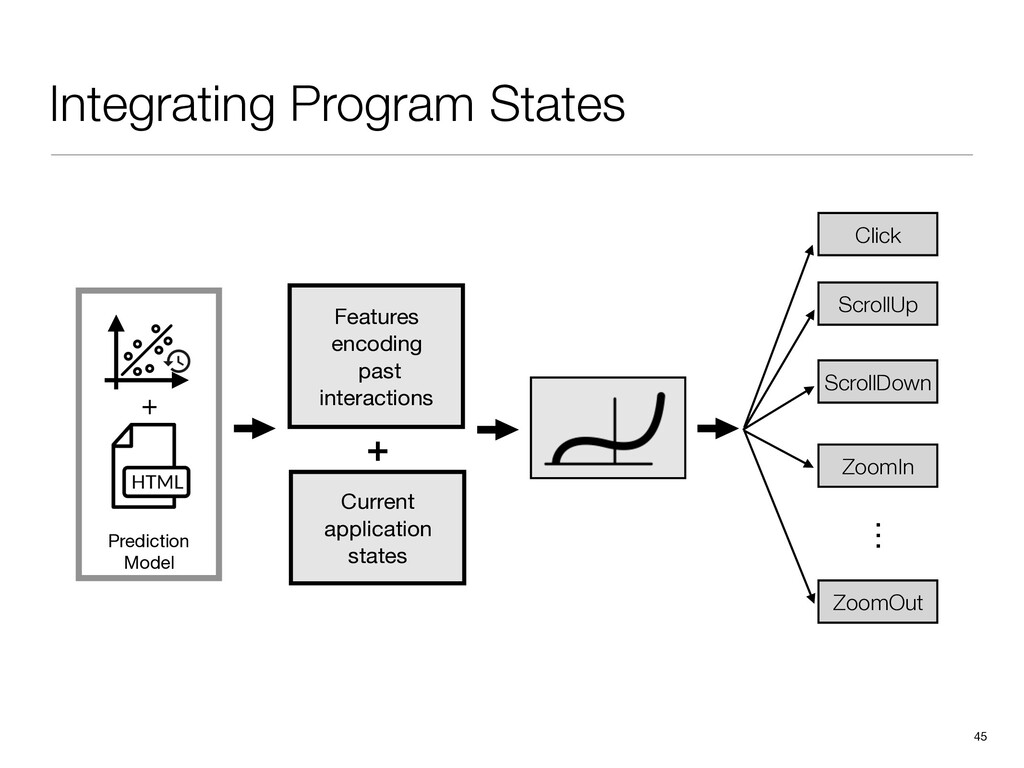
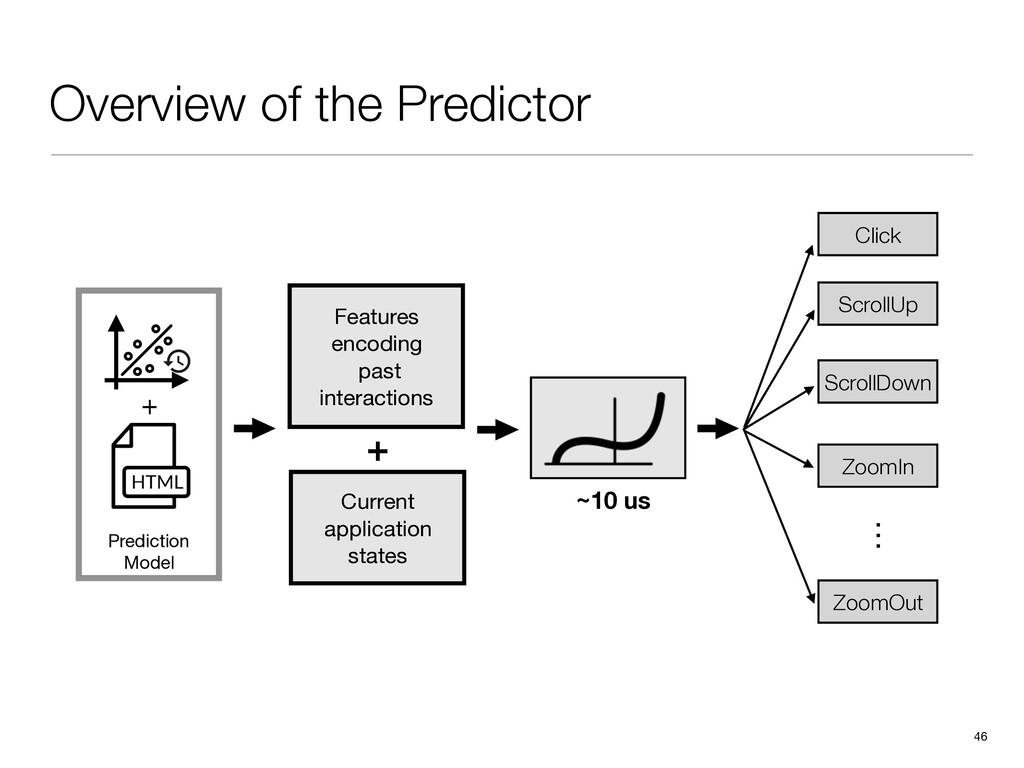
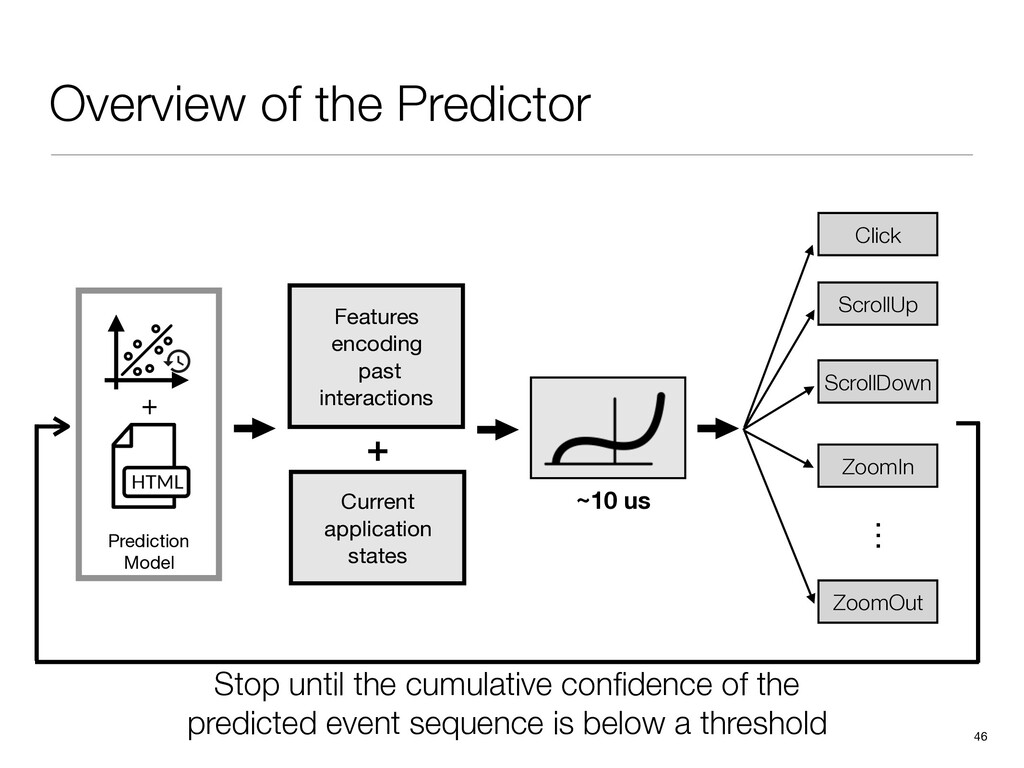
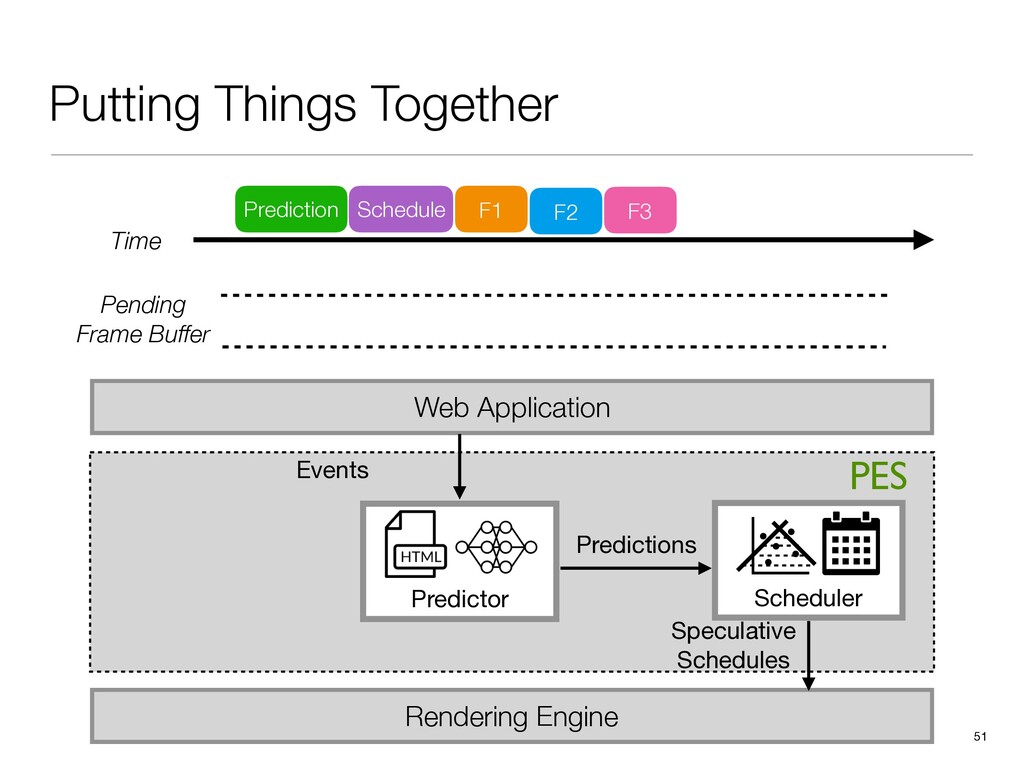
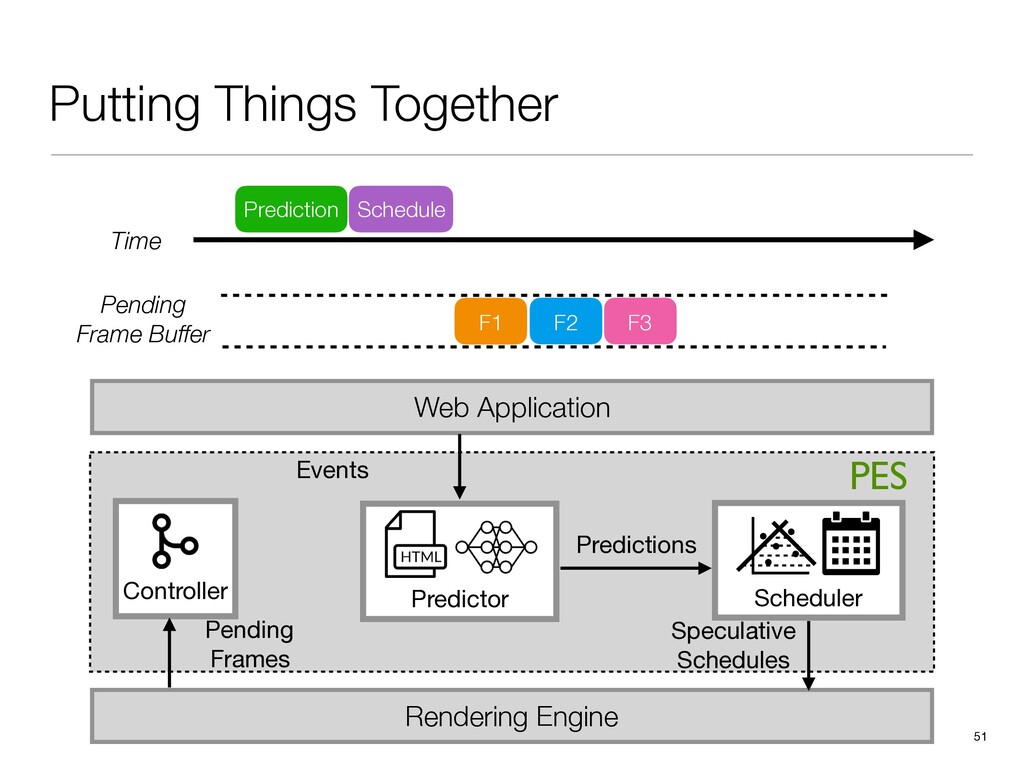
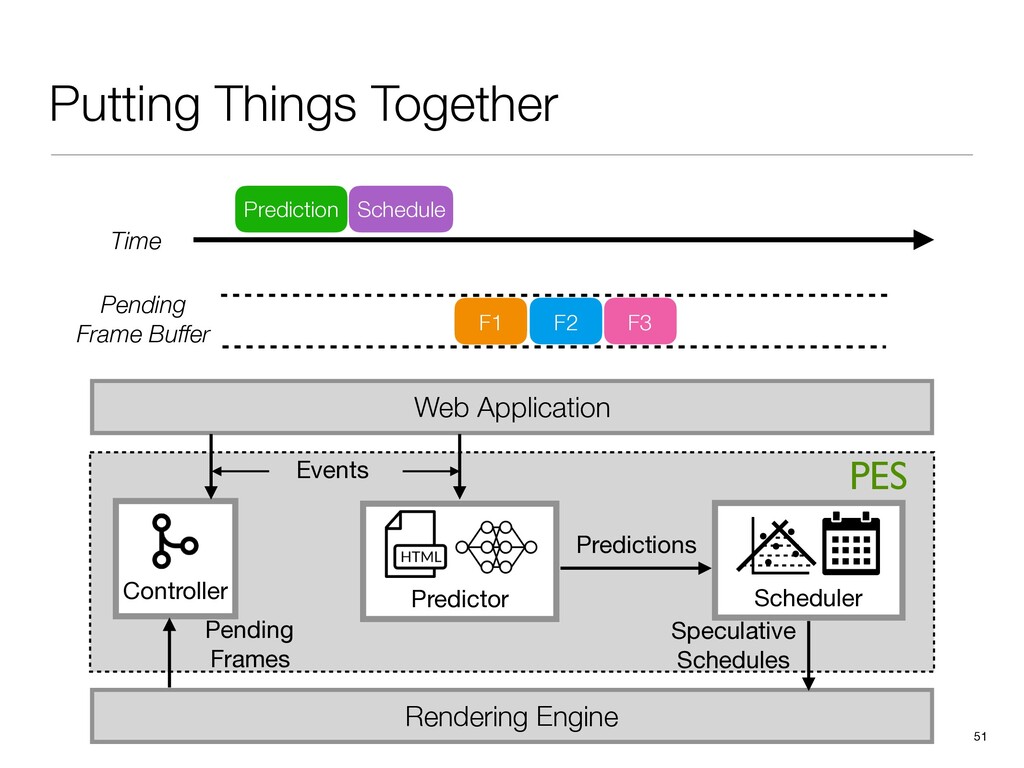
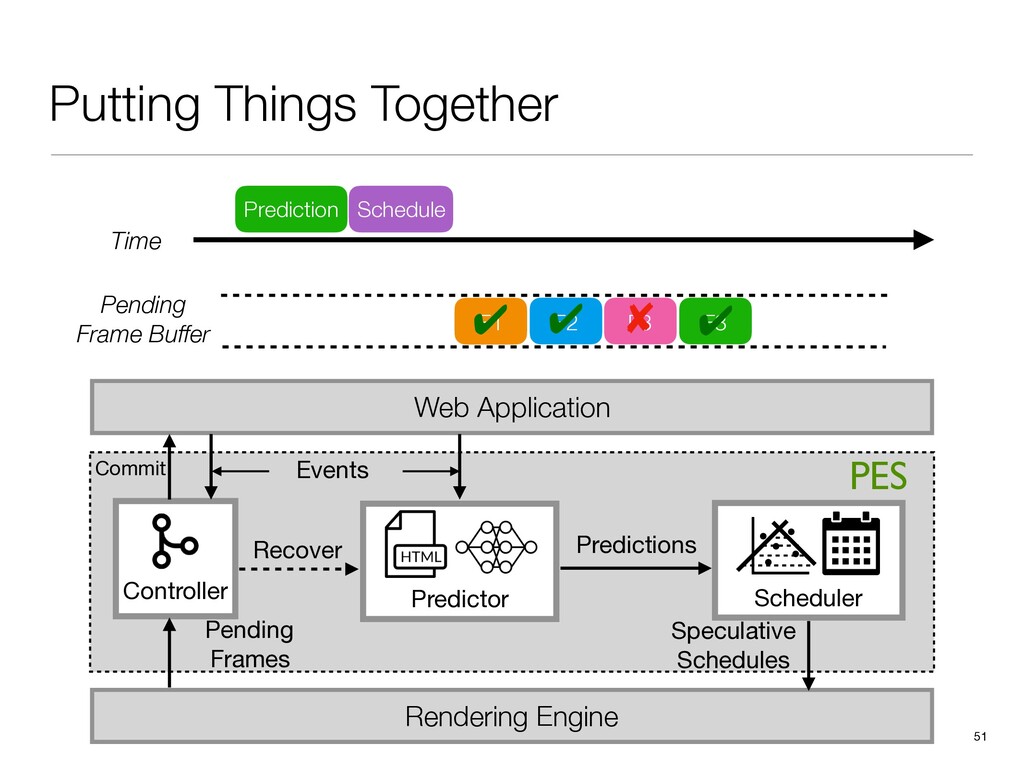
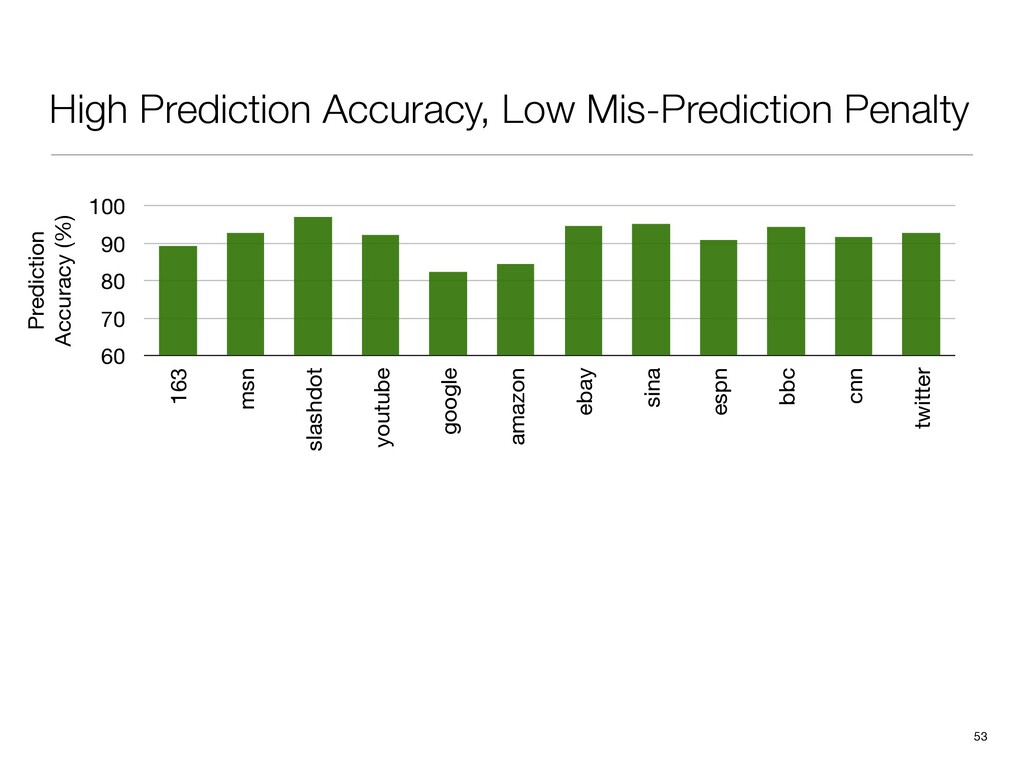
… + Prediction Model Stop until the cumulative confidence of the predicted event sequence is below a threshold ~10 us Features encoding past interactions Current application states +
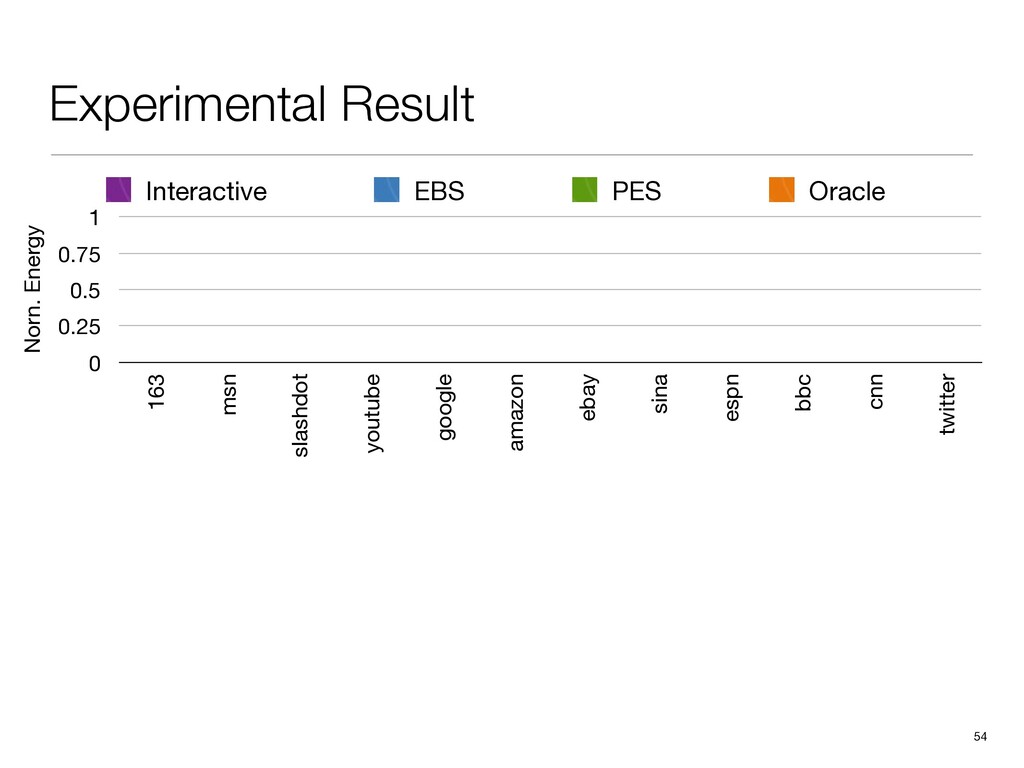
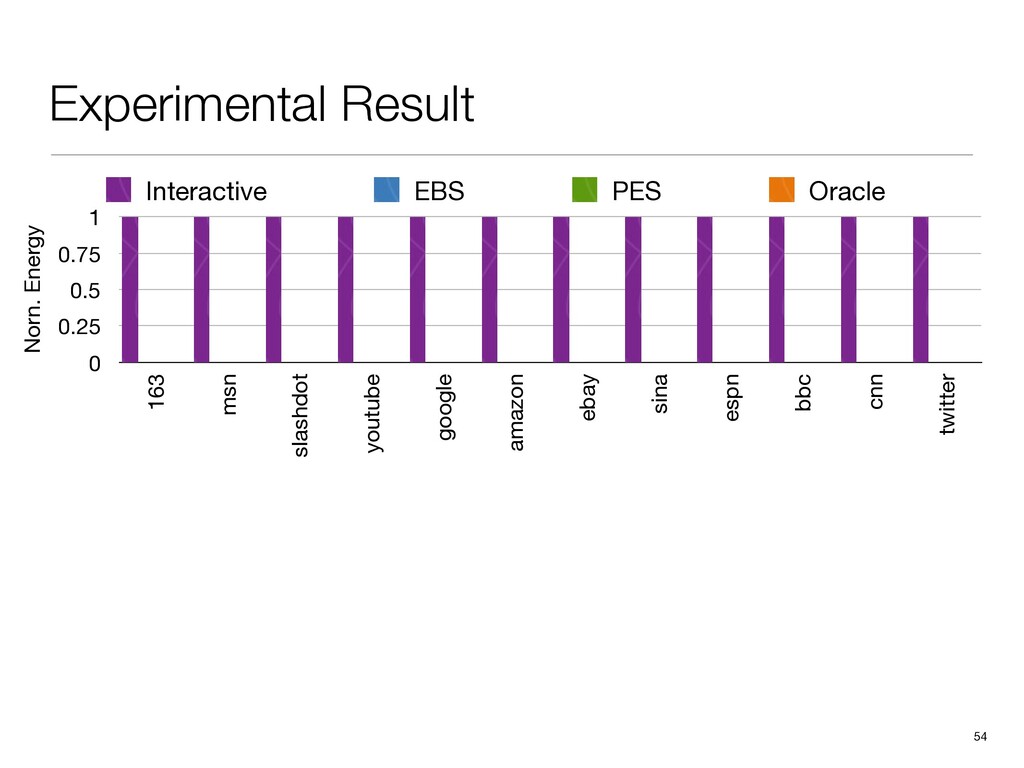
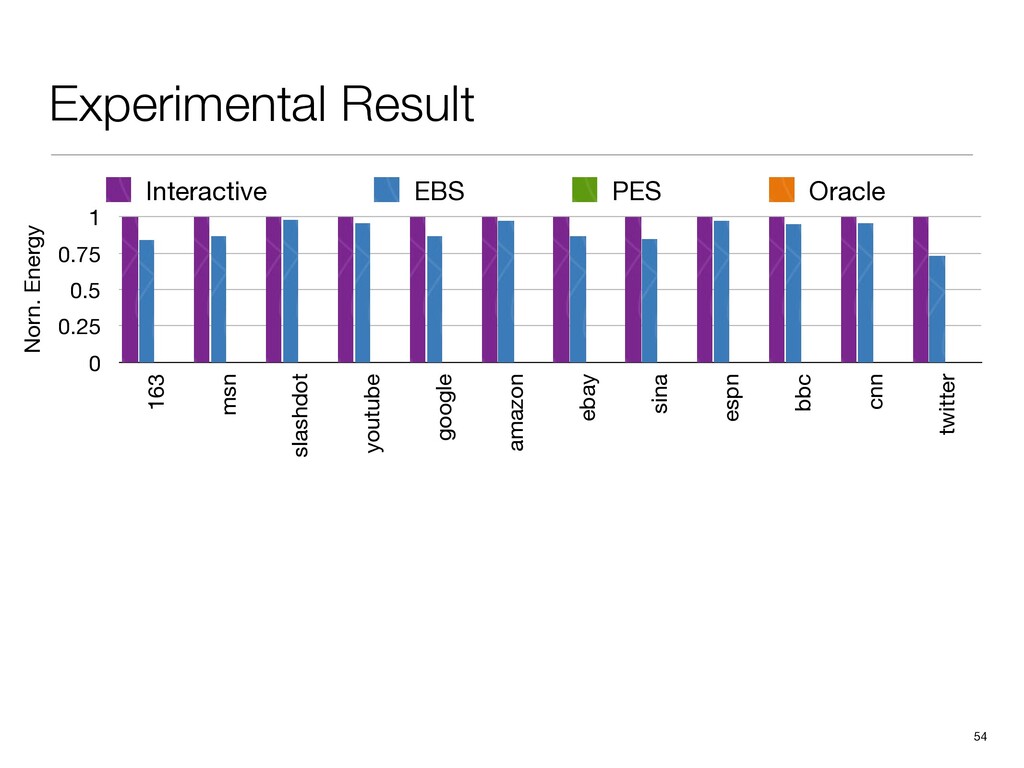
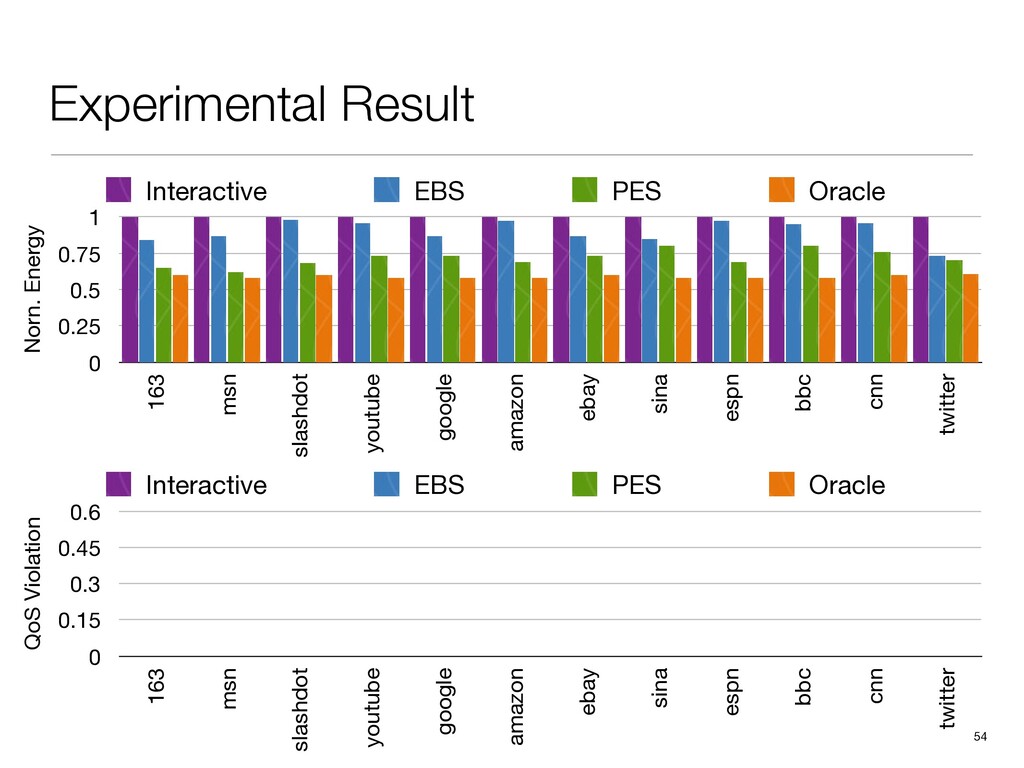
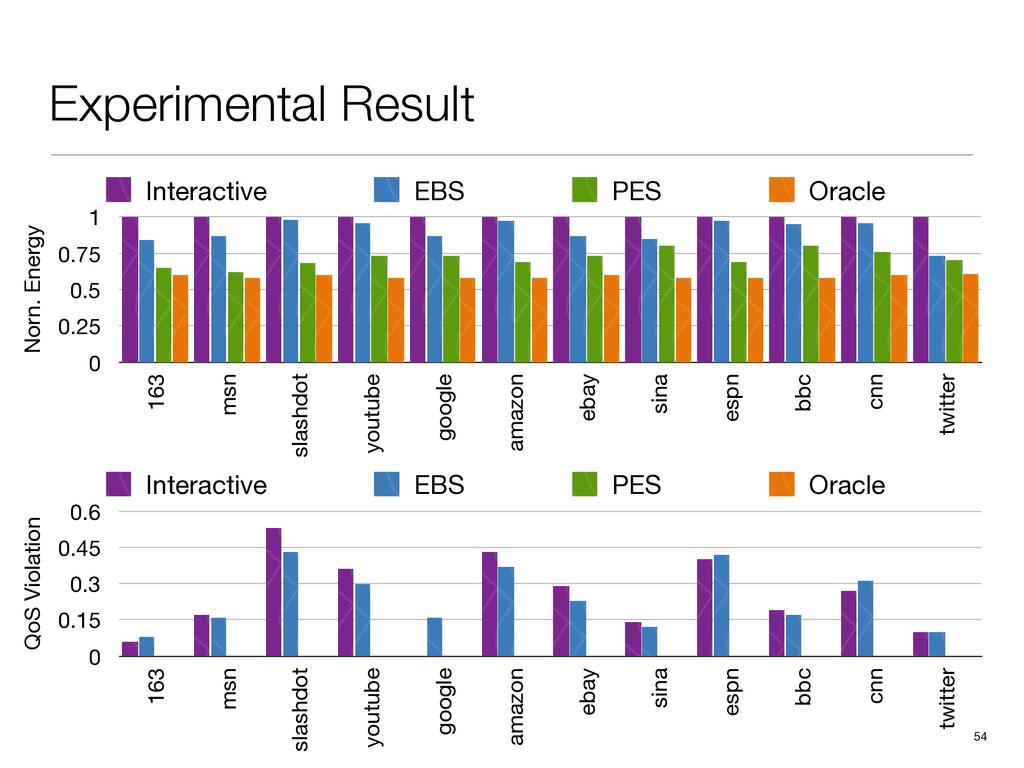
163 msn slashdot youtube google amazon ebay sina espn bbc cnn twitter Interactive EBS PES Oracle QoS Violation 0 0.15 0.3 0.45 0.6 163 msn slashdot youtube google amazon ebay sina espn bbc cnn twitter Interactive EBS PES Oracle
163 msn slashdot youtube google amazon ebay sina espn bbc cnn twitter Interactive EBS PES Oracle QoS Violation 0 0.15 0.3 0.45 0.6 163 msn slashdot youtube google amazon ebay sina espn bbc cnn twitter Interactive EBS PES Oracle
163 msn slashdot youtube google amazon ebay sina espn bbc cnn twitter Interactive EBS PES Oracle QoS Violation 0 0.15 0.3 0.45 0.6 163 msn slashdot youtube google amazon ebay sina espn bbc cnn twitter Interactive EBS PES Oracle
163 msn slashdot youtube google amazon ebay sina espn bbc cnn twitter Interactive EBS PES Oracle QoS Violation 0 0.15 0.3 0.45 0.6 163 msn slashdot youtube google amazon ebay sina espn bbc cnn twitter Interactive EBS PES Oracle
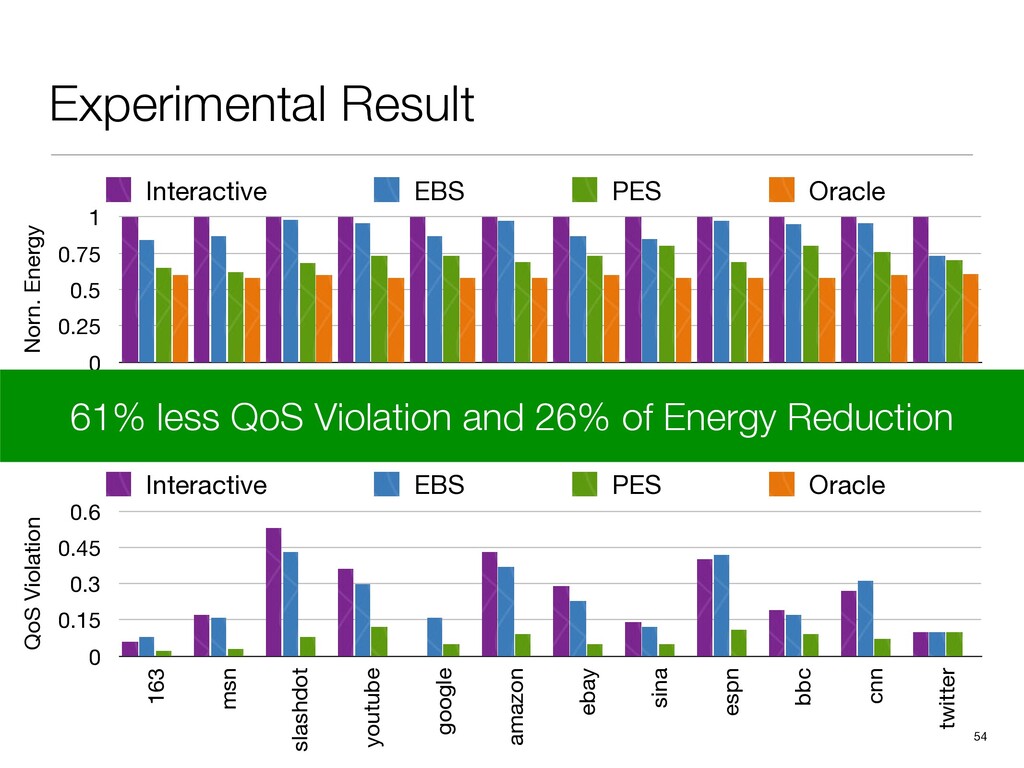
163 msn slashdot youtube google amazon ebay sina espn bbc cnn twitter Interactive EBS PES Oracle QoS Violation 0 0.15 0.3 0.45 0.6 163 msn slashdot youtube google amazon ebay sina espn bbc cnn twitter Interactive EBS PES Oracle 61% less QoS Violation and 26% of Energy Reduction
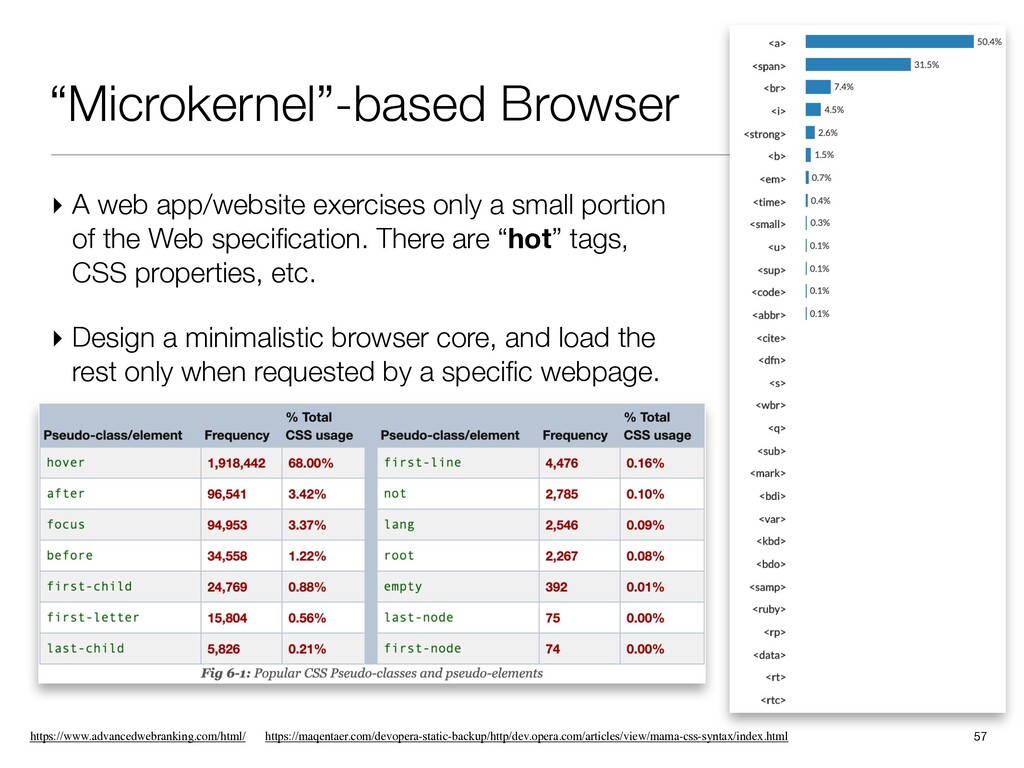
portion of the Web specification. There are “hot” tags, CSS properties, etc. ▸ Design a minimalistic browser core, and load the rest only when requested by a specific webpage. 57 https://www.advancedwebranking.com/html/ https://maqentaer.com/devopera-static-backup/http/dev.opera.com/articles/view/mama-css-syntax/index.html
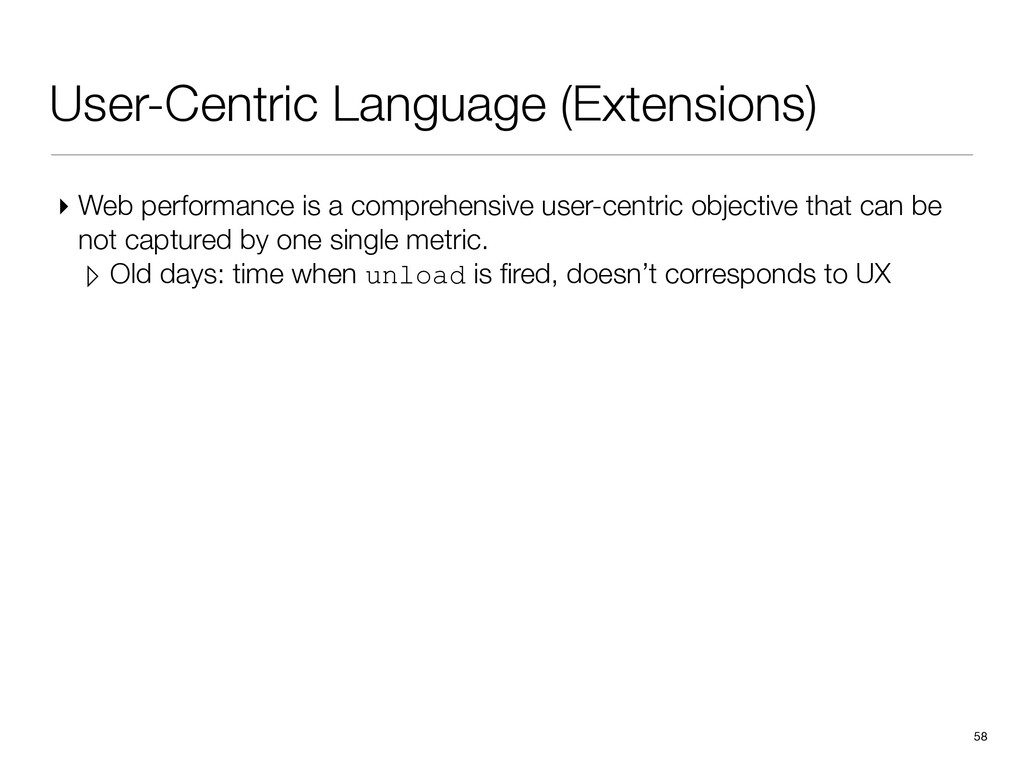
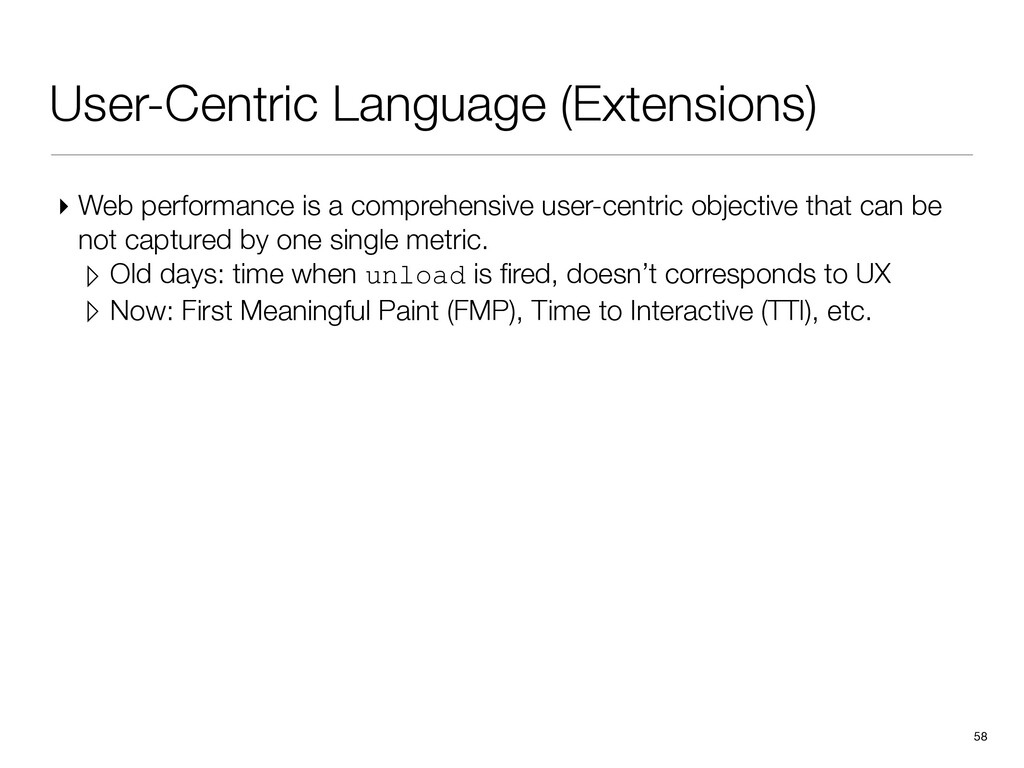
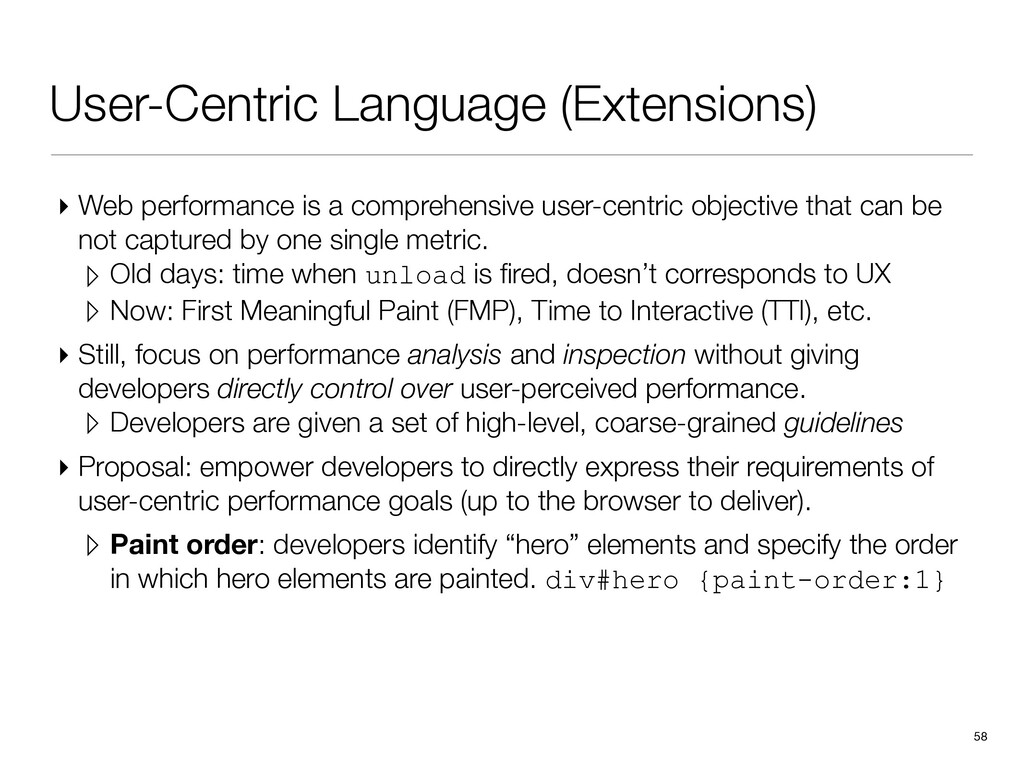
objective that can be not captured by one single metric. ▹ Old days: time when unload is fired, doesn’t corresponds to UX ▹ Now: First Meaningful Paint (FMP), Time to Interactive (TTI), etc. 58
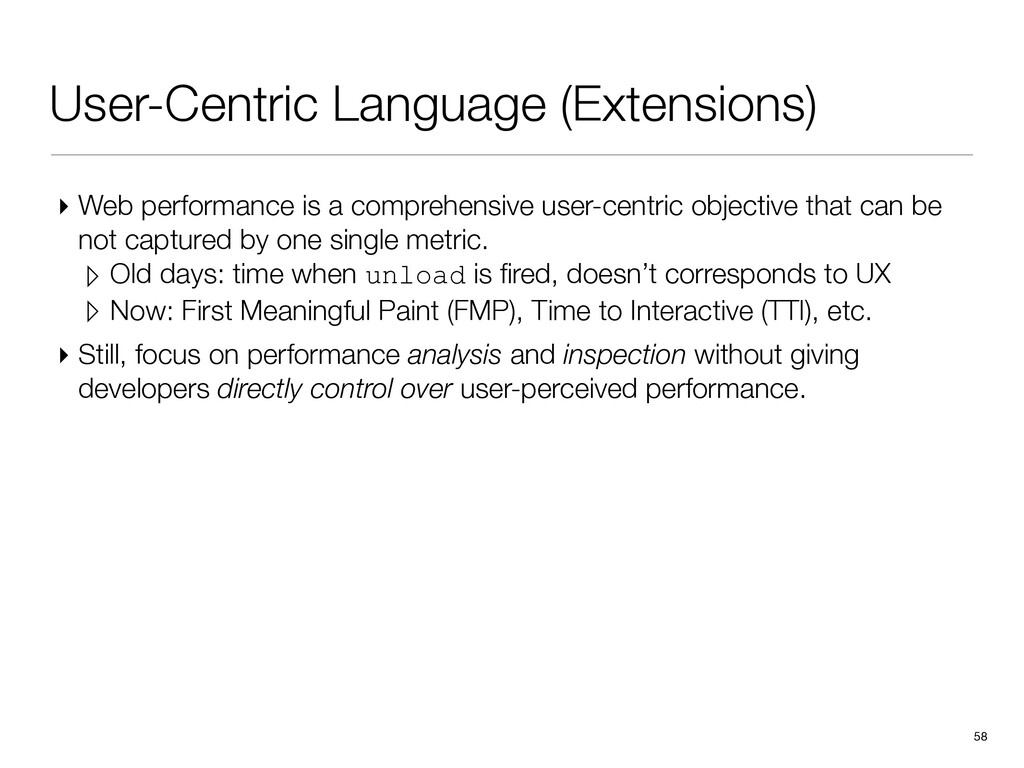
objective that can be not captured by one single metric. ▹ Old days: time when unload is fired, doesn’t corresponds to UX ▹ Now: First Meaningful Paint (FMP), Time to Interactive (TTI), etc. ▸ Still, focus on performance analysis and inspection without giving developers directly control over user-perceived performance. 58
objective that can be not captured by one single metric. ▹ Old days: time when unload is fired, doesn’t corresponds to UX ▹ Now: First Meaningful Paint (FMP), Time to Interactive (TTI), etc. ▸ Still, focus on performance analysis and inspection without giving developers directly control over user-perceived performance. ▹ Developers are given a set of high-level, coarse-grained guidelines 58
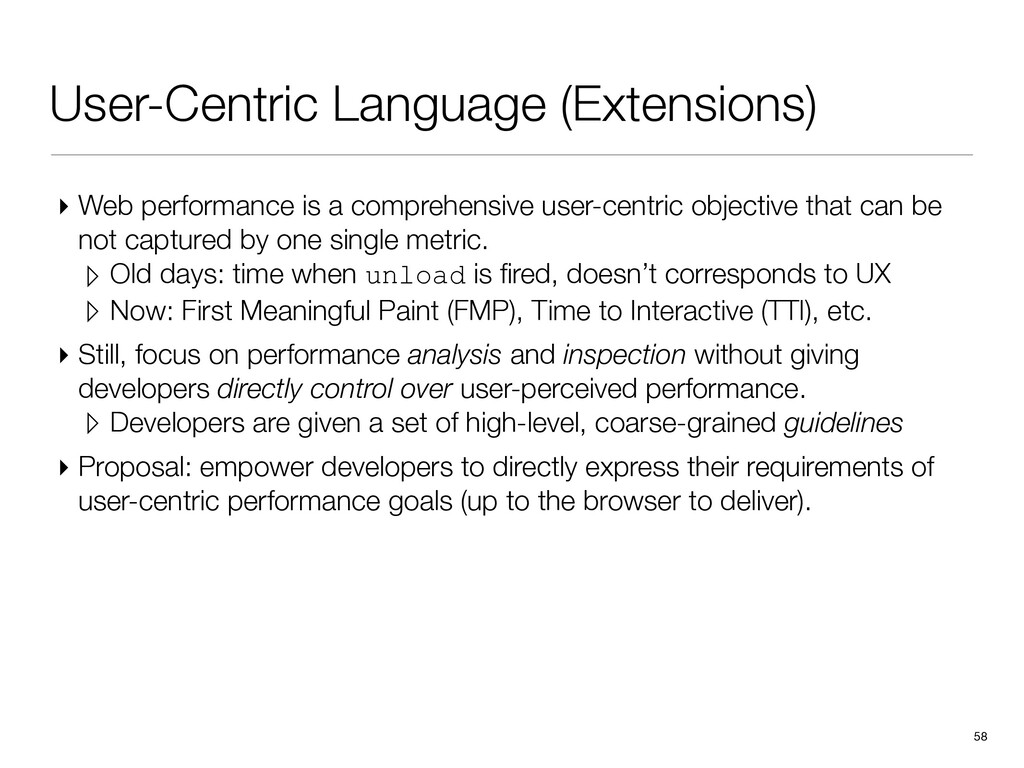
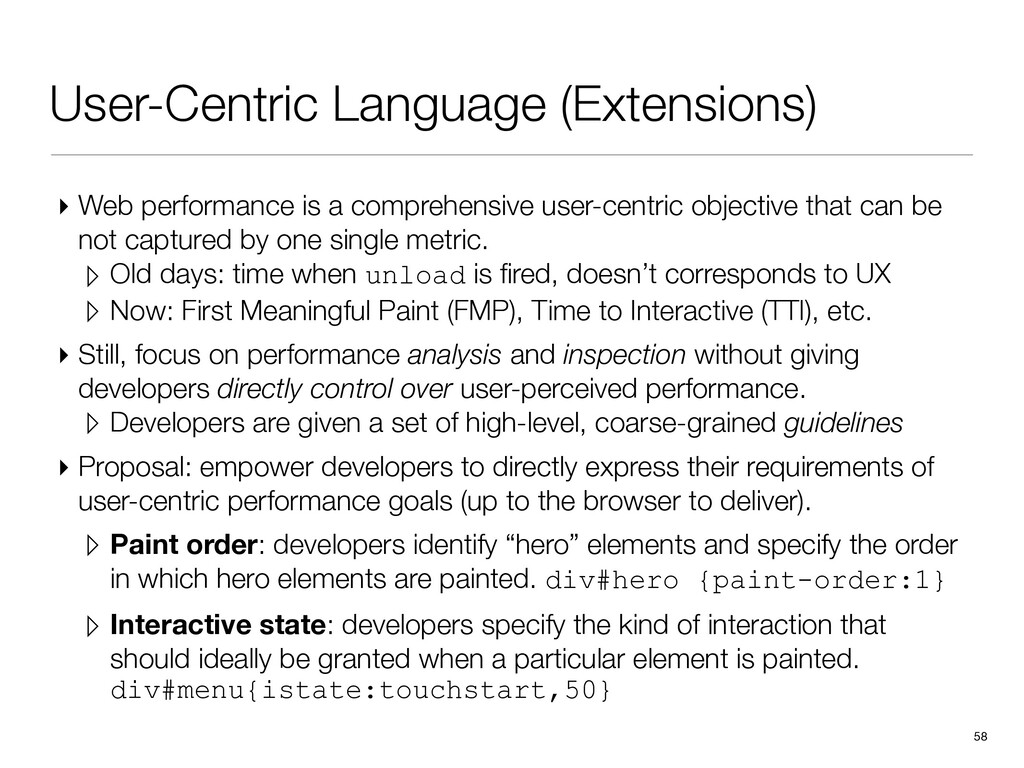
objective that can be not captured by one single metric. ▹ Old days: time when unload is fired, doesn’t corresponds to UX ▹ Now: First Meaningful Paint (FMP), Time to Interactive (TTI), etc. ▸ Still, focus on performance analysis and inspection without giving developers directly control over user-perceived performance. ▹ Developers are given a set of high-level, coarse-grained guidelines ▸ Proposal: empower developers to directly express their requirements of user-centric performance goals (up to the browser to deliver). 58
objective that can be not captured by one single metric. ▹ Old days: time when unload is fired, doesn’t corresponds to UX ▹ Now: First Meaningful Paint (FMP), Time to Interactive (TTI), etc. ▸ Still, focus on performance analysis and inspection without giving developers directly control over user-perceived performance. ▹ Developers are given a set of high-level, coarse-grained guidelines ▸ Proposal: empower developers to directly express their requirements of user-centric performance goals (up to the browser to deliver). ▹ Paint order: developers identify “hero” elements and specify the order in which hero elements are painted. div#hero {paint-order:1} 58
objective that can be not captured by one single metric. ▹ Old days: time when unload is fired, doesn’t corresponds to UX ▹ Now: First Meaningful Paint (FMP), Time to Interactive (TTI), etc. ▸ Still, focus on performance analysis and inspection without giving developers directly control over user-perceived performance. ▹ Developers are given a set of high-level, coarse-grained guidelines ▸ Proposal: empower developers to directly express their requirements of user-centric performance goals (up to the browser to deliver). ▹ Paint order: developers identify “hero” elements and specify the order in which hero elements are painted. div#hero {paint-order:1} ▹ Interactive state: developers specify the kind of interaction that should ideally be granted when a particular element is painted. div#menu{istate:touchstart,50} 58
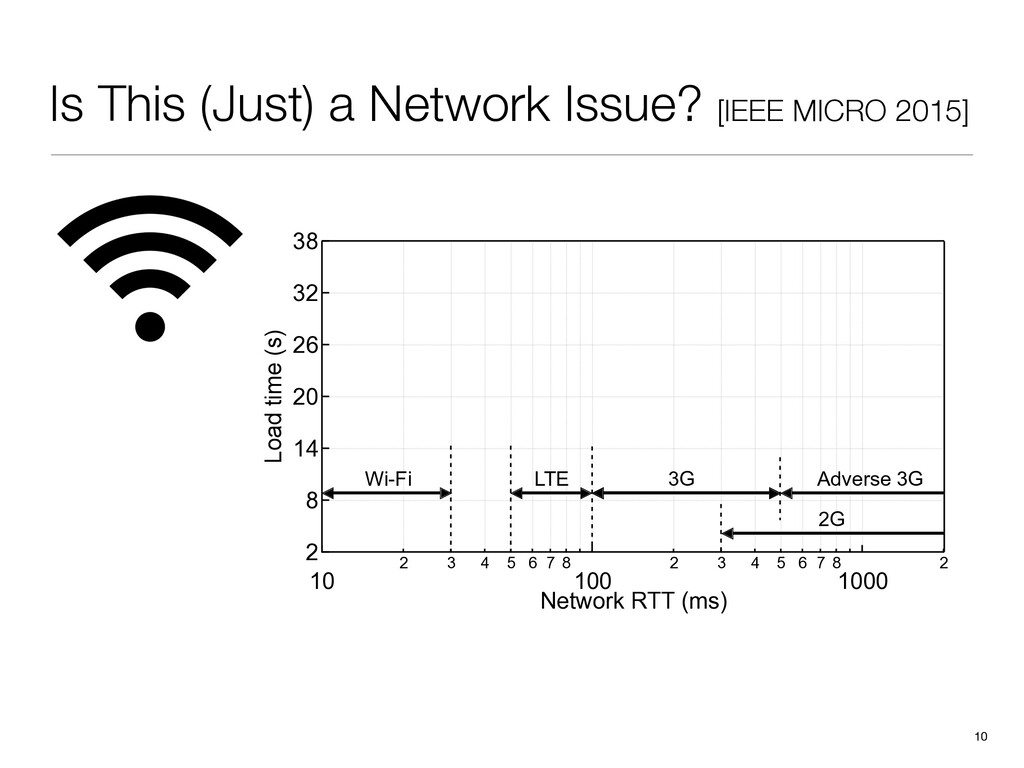
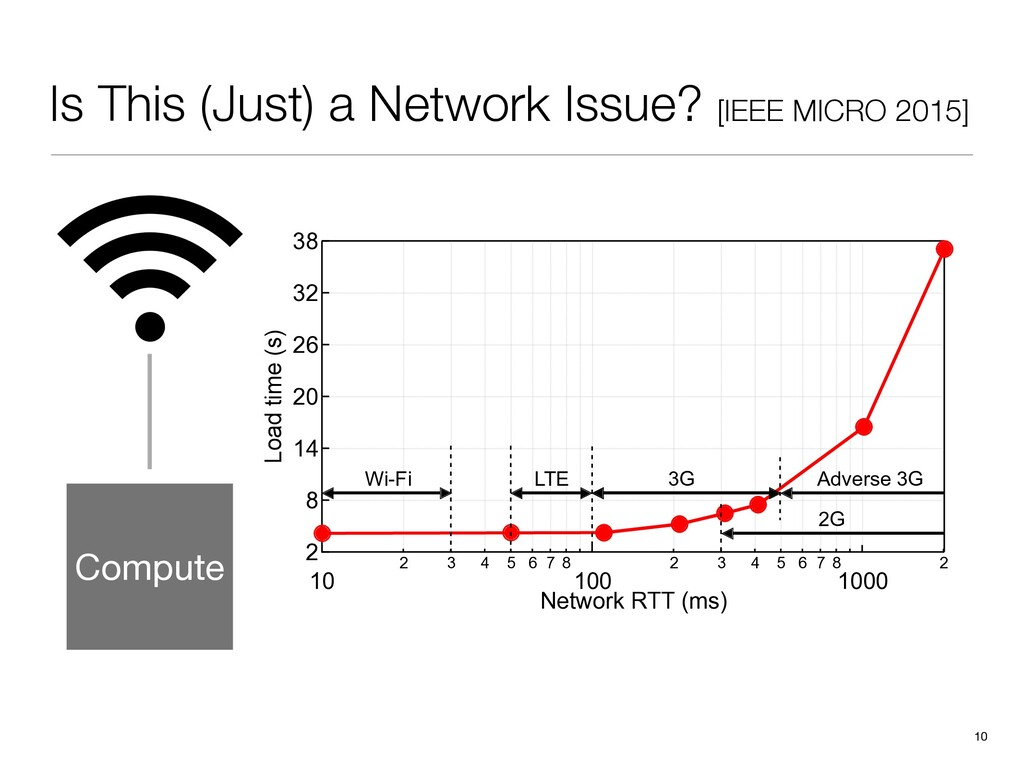
![Is This (Just) a Network Issue? [IEEE MICRO 2015] 9](https://files.speakerdeck.com/presentations/4fb70f3d7d3548d38bd050482036175d/slide_29.jpg)