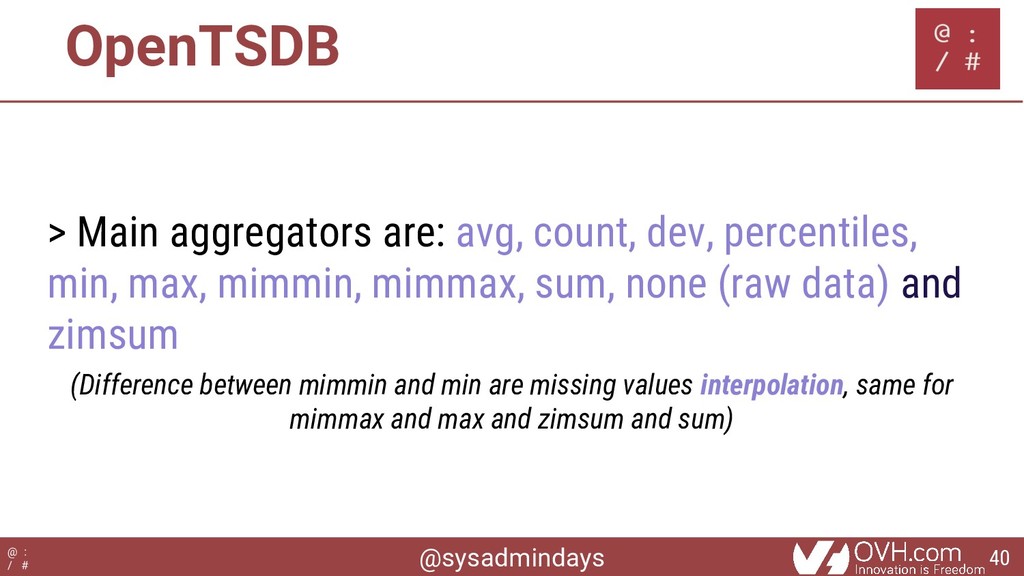
avg, count, dev, percentiles, min, max, mimmin, mimmax, sum, none (raw data) and zimsum (Difference between mimmin and min are missing values interpolation, same for mimmax and max and zimsum and sum) 40
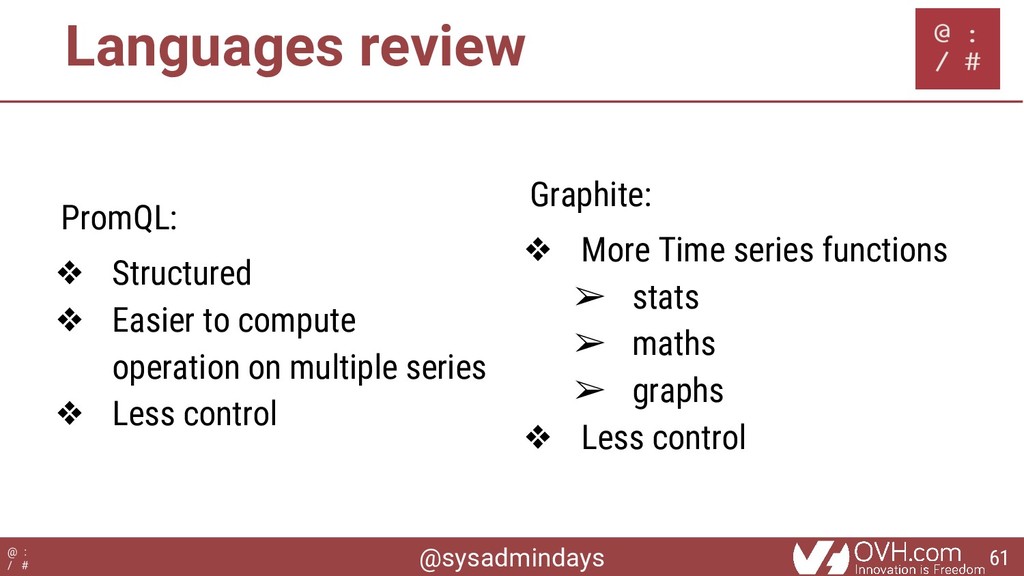
of visualization ❖ Multiple series ❖ Lof of functions (functions) ❖ Less control on data ❖ Need a graphical tool (Timelion on Kibana) ❖ Lower query performance 70
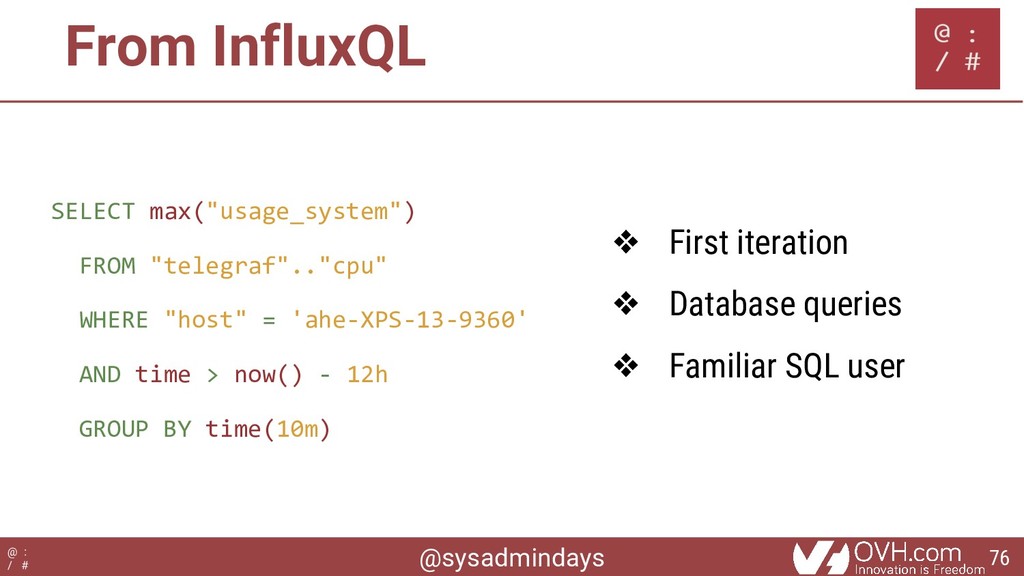
"telegraf".."cpu" WHERE "host" = 'ahe-XPS-13-9360' AND time > now() - 12h GROUP BY time(10m) ❖ First iteration ❖ Database queries ❖ Familiar SQL user 76
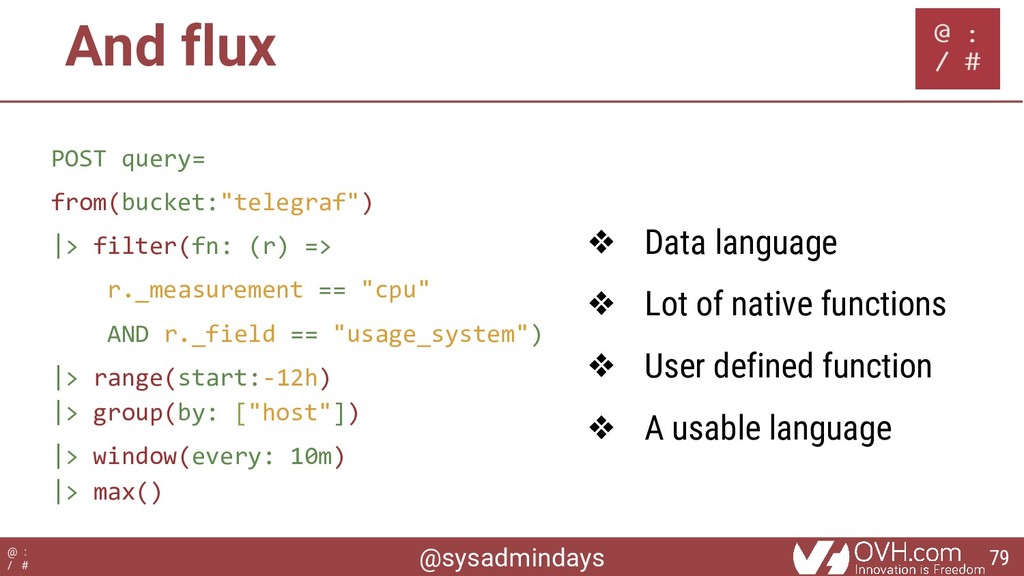
|> filter(fn: (r) => r._measurement == "cpu" AND r._field == "usage_system") |> range(start:-12h) |> group(by: ["host"]) |> window(every: 10m) |> max() ❖ Data language ❖ Lot of native functions ❖ User defined function ❖ A usable language 79
![@sysadmindays @ : / # PromQL api/v1/query_range? query=cpu.usage_system{ cpu=~"cpu[0-7]*"}& start=1535797890&](https://files.speakerdeck.com/presentations/a12a952921e442fcbed1b60f7491c3fd/slide_33.jpg)
![@sysadmindays @ : / # PromQL api/v1/query_range? query=max(cpu. usage_system{ cpu=~"cpu[0-7]*"})](https://files.speakerdeck.com/presentations/a12a952921e442fcbed1b60f7491c3fd/slide_40.jpg)
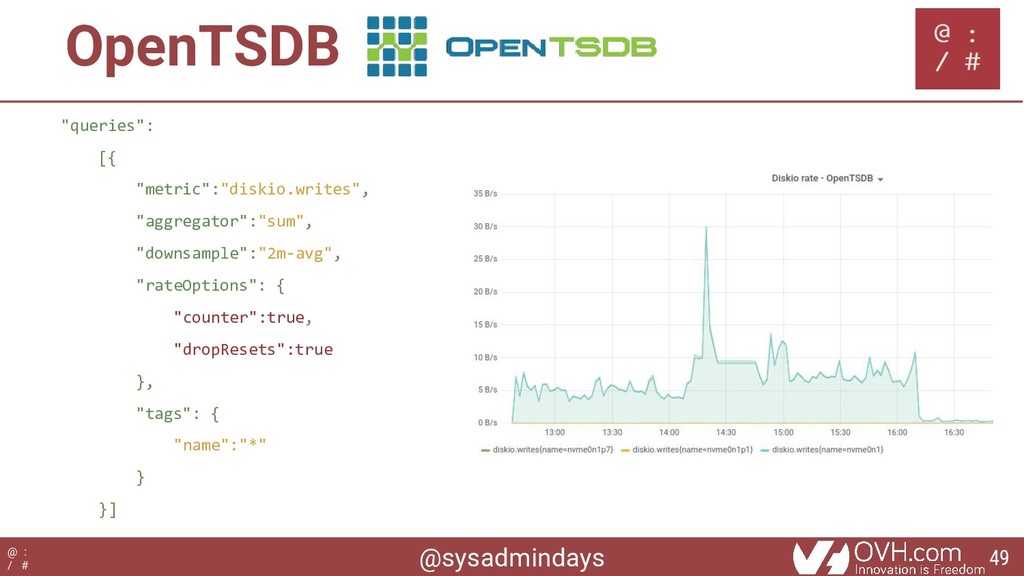
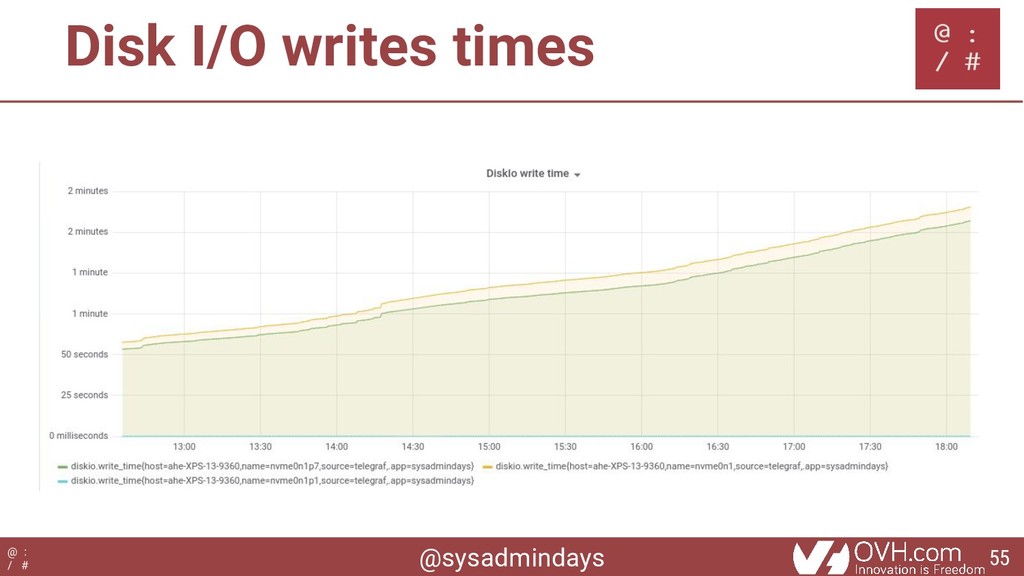
![@sysadmindays @ : / # PromQL api/v1/query_range? query=rate(diskio.wri tes[2m])& start=1535797890&](https://files.speakerdeck.com/presentations/a12a952921e442fcbed1b60f7491c3fd/slide_50.jpg)
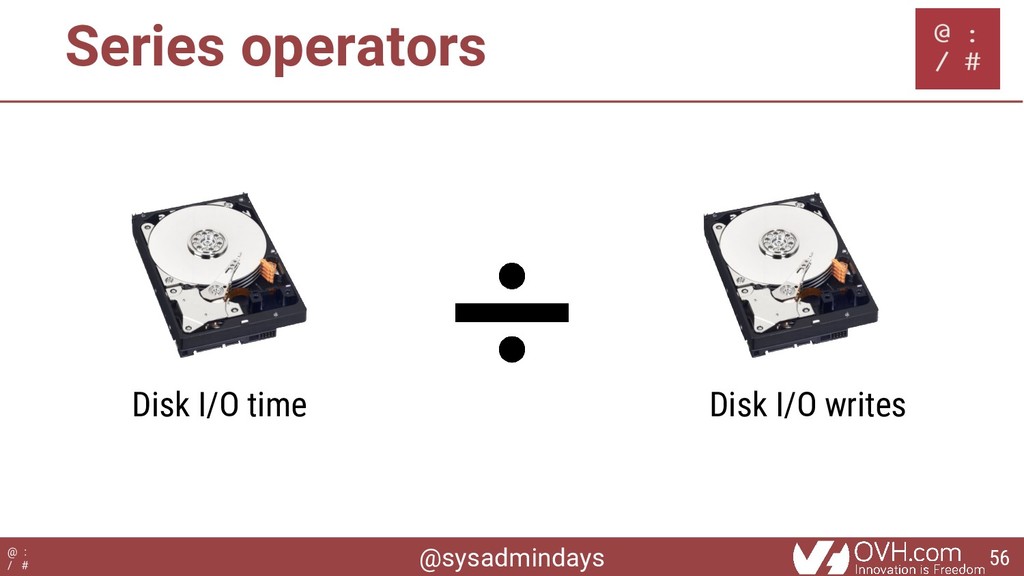
![@sysadmindays @ : / # Series operators Prometheus: rate(diskio.write_time[2m]) /](https://files.speakerdeck.com/presentations/a12a952921e442fcbed1b60f7491c3fd/slide_56.jpg)
![@sysadmindays @ : / # Alternative: TSQL spec select("cpu.usage_system") .where("cpu~cpu[0-7]*")](https://files.speakerdeck.com/presentations/a12a952921e442fcbed1b60f7491c3fd/slide_81.jpg)