Upgrade to Pro — share decks privately, control downloads, hide ads and more …

Notes on Vickers’ Decision Curve Analysis

Notes on Vickers’ Decision Curve Analysis

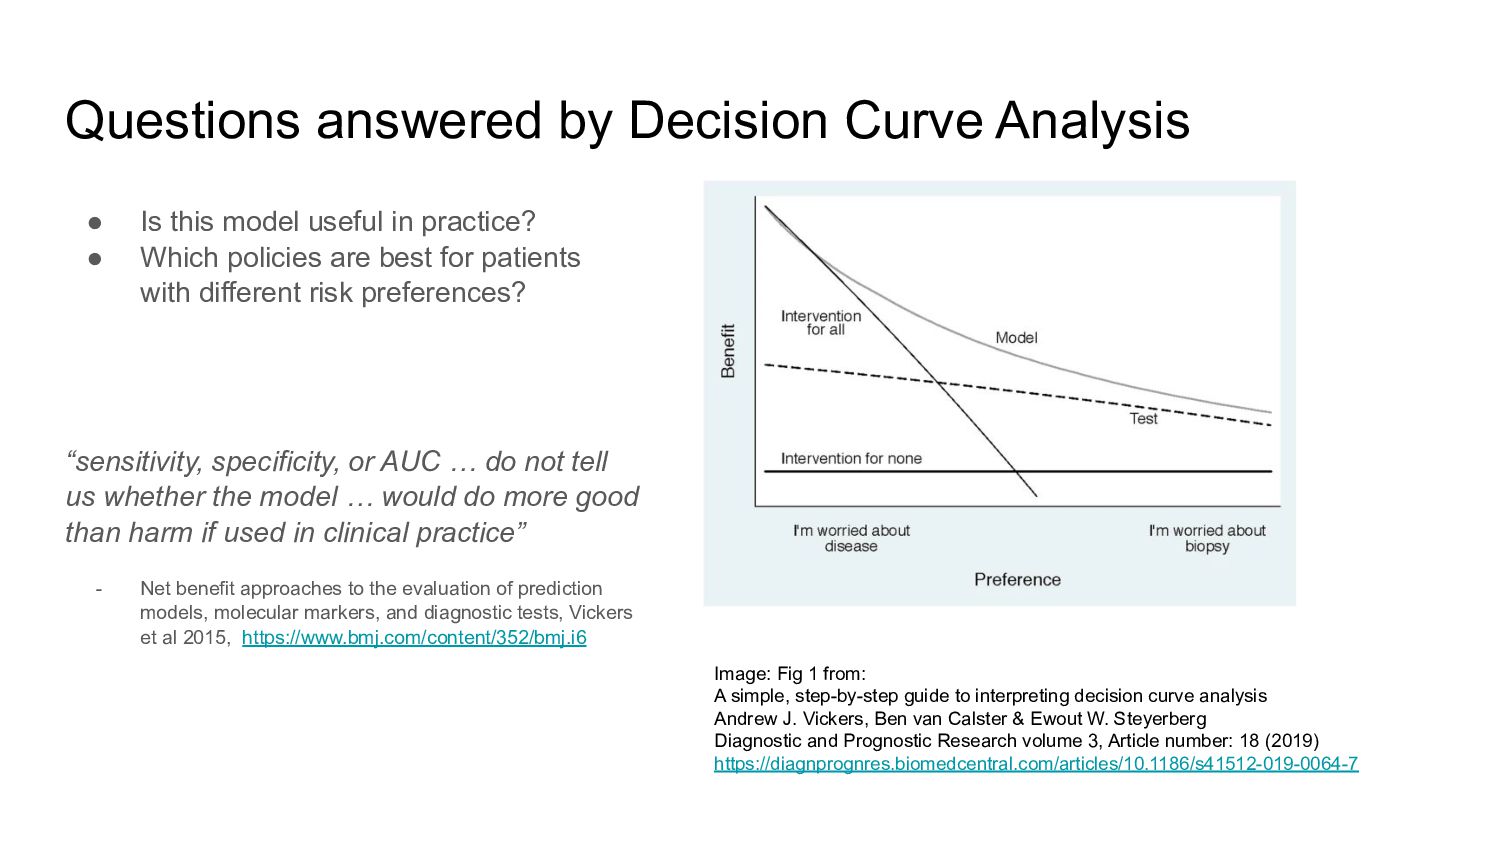
Decision Curve Analysis [1] enables clinical decisions that account for model error, cost / benefit of interventions, and risk preferences.

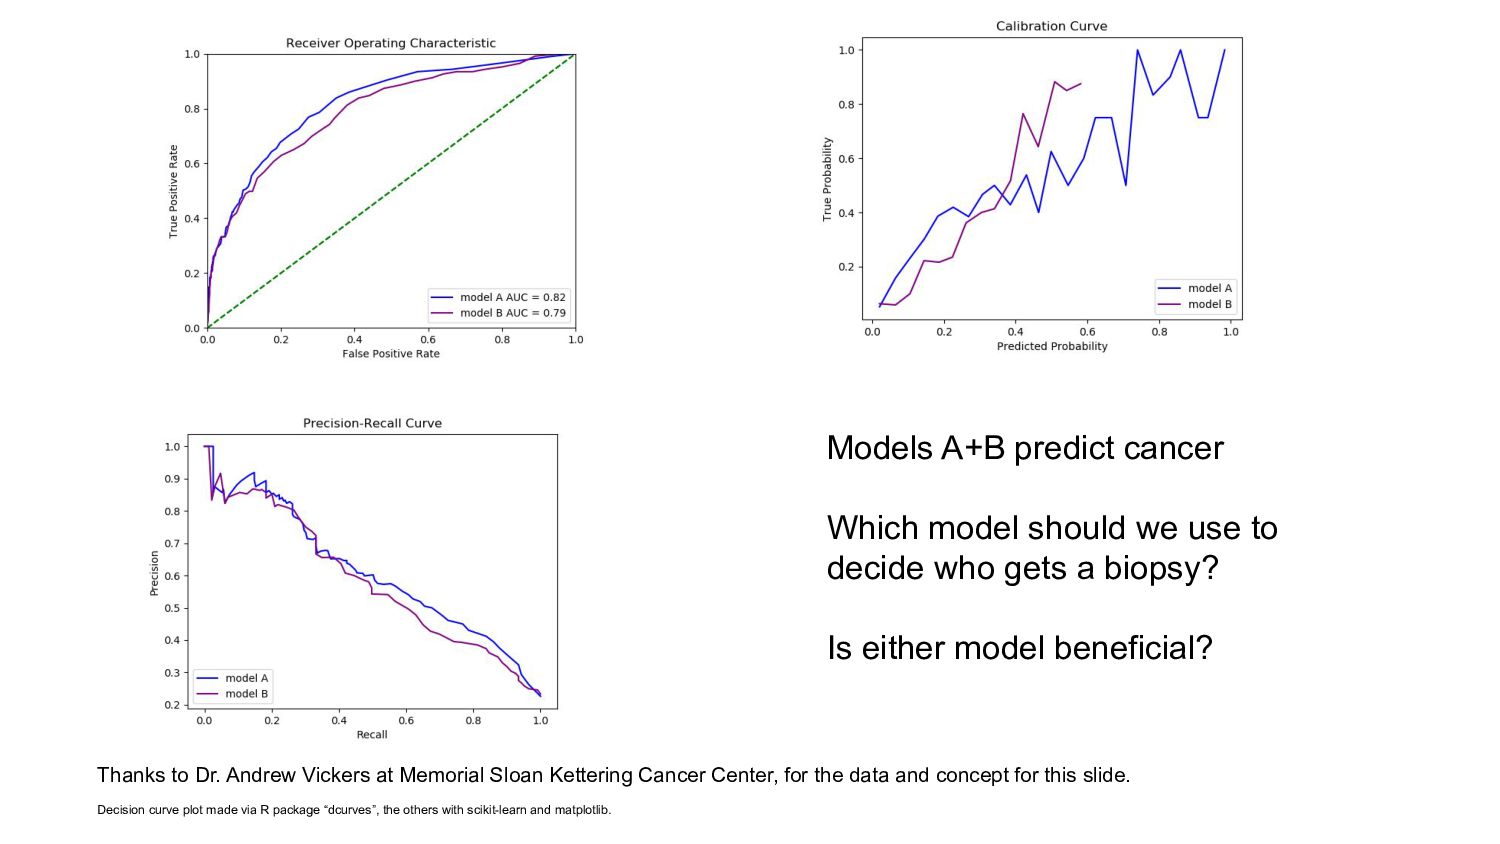
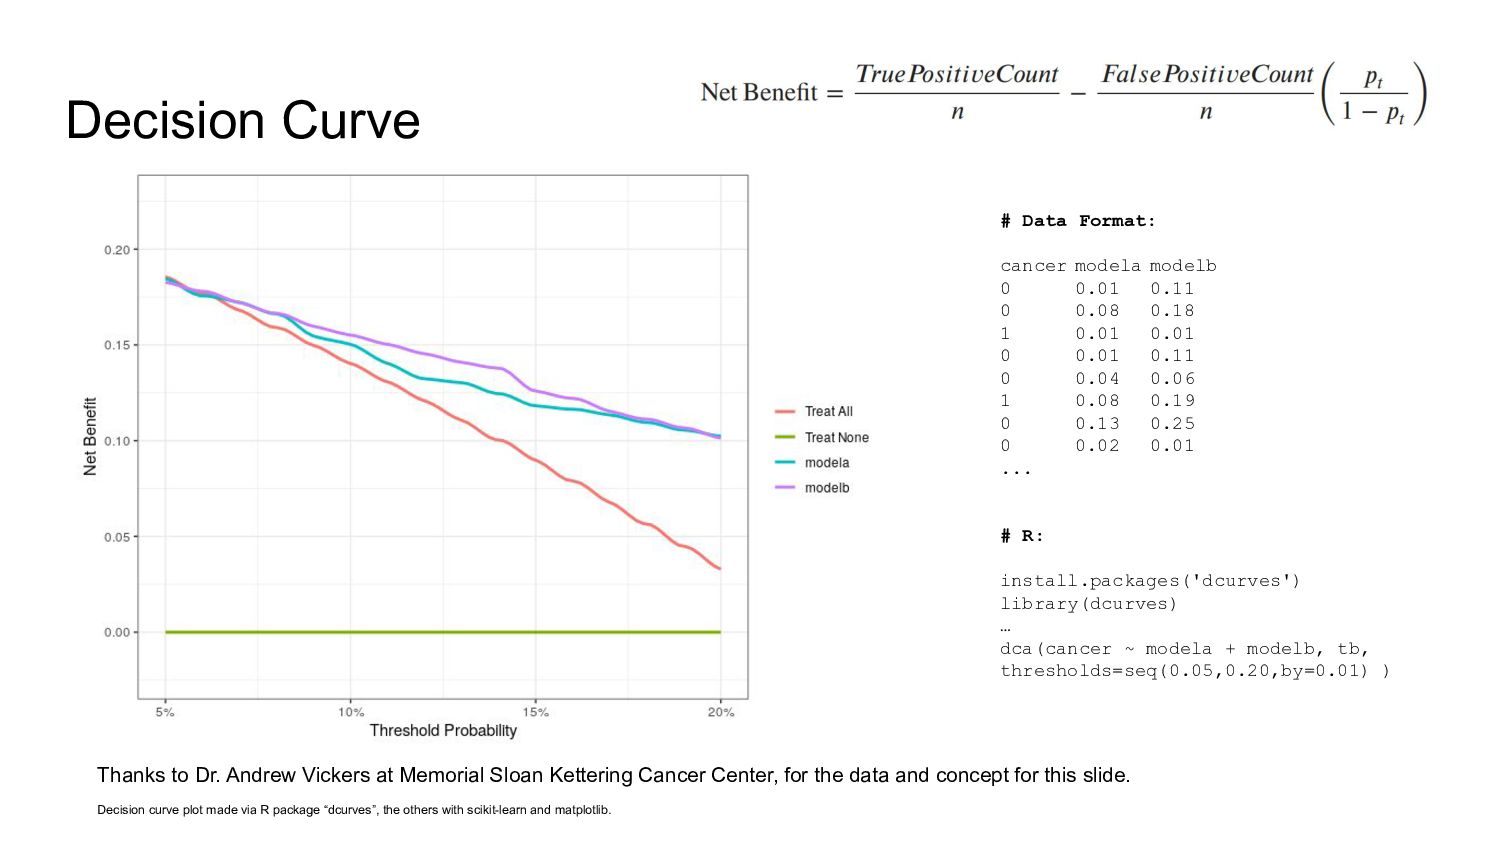
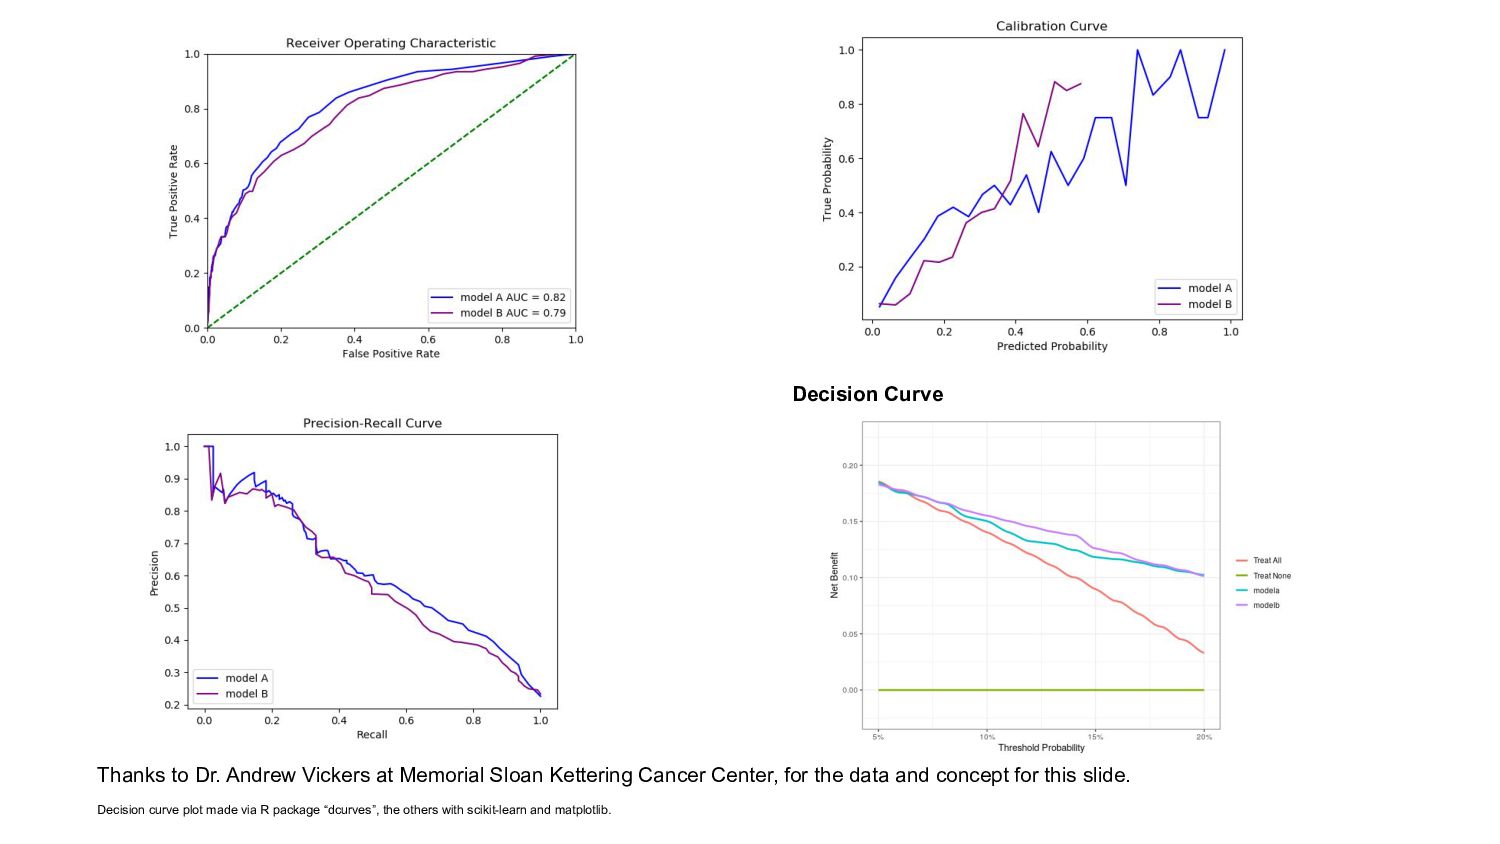
With DCA, net benefit of models can be compared directly.

This brief tutorial includes content from Dr. Andrew Vickers and Dr. Karandeep Singh

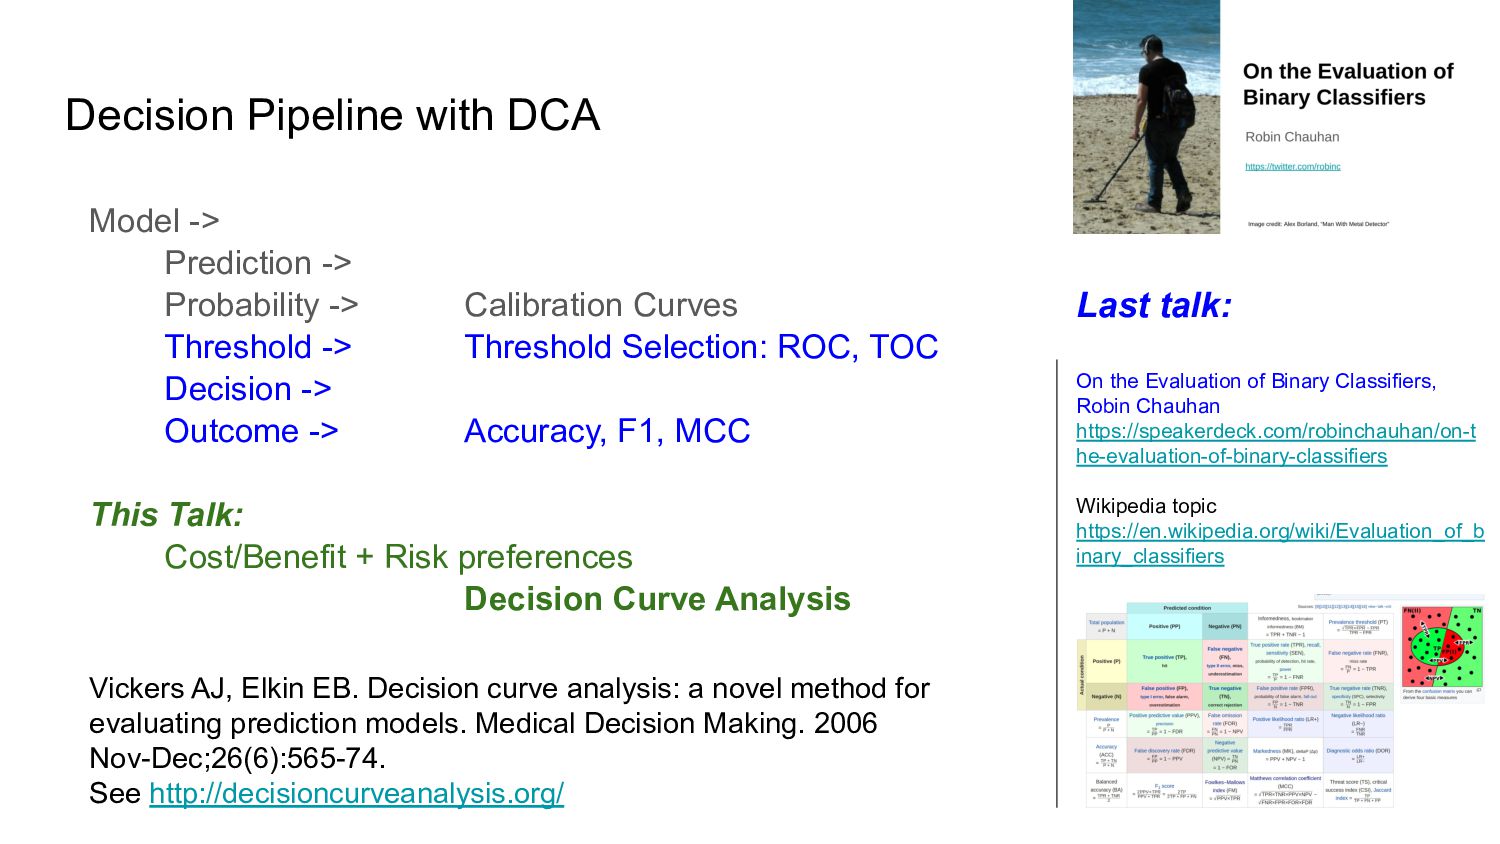
[1] Vickers AJ, Elkin EB. Decision curve analysis: a novel method for evaluating prediction models. Medical Decision Making. 2006 Nov-Dec;26(6):565-74.

Tweet

More Decks by Robin Ranjit Singh Chauhan

Other Decks in Science

Transcript

  1. Notes on Vickers’ Decision Curve Analysis Clinical decisions that account

    for model error, cost / benefit of interventions, and risk preferences Robin R. Chauhan https://twitter.com/robinc [email protected]
  2. Last talk: On the Evaluation of Binary Classifiers, Robin Chauhan

    https://speakerdeck.com/robinchauhan/on-t he-evaluation-of-binary-classifiers Wikipedia topic https://en.wikipedia.org/wiki/Evaluation_of_b inary_classifiers Vickers AJ, Elkin EB. Decision curve analysis: a novel method for evaluating prediction models. Medical Decision Making. 2006 Nov-Dec;26(6):565-74. See http://decisioncurveanalysis.org/ Model -> Prediction -> Probability -> Calibration Curves Threshold -> Threshold Selection: ROC, TOC Decision -> Outcome -> Accuracy, F1, MCC This Talk: Cost/Benefit + Risk preferences Decision Curve Analysis Decision Pipeline with DCA
  3. Thanks to Dr. Andrew Vickers at Memorial Sloan Kettering Cancer

    Center, for the data and concept for this slide. Decision curve plot made via R package “dcurves”, the others with scikit-learn and matplotlib. Models A+B predict cancer Which model should we use to decide who gets a biopsy? Is either model beneficial?
  4. Thanks to Dr. Andrew Vickers at Memorial Sloan Kettering Cancer

    Center, for the data and concept for this slide. Decision curve plot made via R package “dcurves”, the others with scikit-learn and matplotlib. Decision Curve # Data Format: cancer modela modelb 0 0.01 0.11 0 0.08 0.18 1 0.01 0.01 0 0.01 0.11 0 0.04 0.06 1 0.08 0.19 0 0.13 0.25 0 0.02 0.01 ... # R: install.packages('dcurves') library(dcurves) … dca(cancer ~ modela + modelb, tb, thresholds=seq(0.05,0.20,by=0.01) )
  5. Thanks to Dr. Andrew Vickers at Memorial Sloan Kettering Cancer

    Center, for the data and concept for this slide. Decision curve plot made via R package “dcurves”, the others with scikit-learn and matplotlib. Decision Curve # Data Format: cancer modela modelb 0 0.01 0.11 0 0.08 0.18 1 0.01 0.01 0 0.01 0.11 0 0.04 0.06 1 0.08 0.19 0 0.13 0.25 0 0.02 0.01 ... # R: install.packages('dcurves') library(dcurves) … dca(cancer ~ modela + modelb, tb, thresholds=seq(0.05,0.20,by=0.01) )
  6. Decision Curve Thanks to Dr. Andrew Vickers at Memorial Sloan

    Kettering Cancer Center, for the data and concept for this slide. Decision curve plot made via R package “dcurves”, the others with scikit-learn and matplotlib.
  7. Questions answered by Decision Curve Analysis • Is this model

    useful in practice? • Which policies are best for patients with different risk preferences? “sensitivity, specificity, or AUC … do not tell us whether the model … would do more good than harm if used in clinical practice” - Net benefit approaches to the evaluation of prediction models, molecular markers, and diagnostic tests, Vickers et al 2015, https://www.bmj.com/content/352/bmj.i6 Image: Fig 1 from: A simple, step-by-step guide to interpreting decision curve analysis Andrew J. Vickers, Ben van Calster & Ewout W. Steyerberg Diagnostic and Prognostic Research volume 3, Article number: 18 (2019) https://diagnprognres.biomedcentral.com/articles/10.1186/s41512-019-0064-7
  8. Goals of Decision Curve Analysis • Compare various decision rules

    and approximate decision models • Account for costs, benefits, and model error … • … Covering a range of risk thresholds / cost-benefit ratios • Without additional data (often difficult to accurately quantify costs + benefits) See: Vickers in “Decision curve analysis: a discussion”, Steyerberg et al 2008, https://www.ncbi.nlm.nih.gov/pmc/articles/PMC2577563/
  9. Therapeutic decision making: a cost-benefit analysis, Pauker 1975 Benefit =>

    Benefit of True Positive correctly treating the diseased Cost => Cost of False Positive incorrectly treating the non-diseased
  10. Cost/Benefit Exchange Rate Equivalently: The threshold model revisited, Djulbegovic et

    al 2018 https://onlinelibrary.wiley.com/doi/10.1111/jep.13091 Image + slide via Dr. Karandeep Singh https://twitter.com/kdpsinghlab/status/1434696280719118340/
  11. • Interpretation of Cost and Benefit: Pauker 1975 ◦ Benefit

    of Treating diseased vs ◦ Cost of Treating non-diseased • Interpretation of phrase “Net Benefit” ◦ Pauker 1975 version ◦ Vickers Net Benefit version (normalized) • {Cost,Benefit} pair have 2 separate but related relationships ◦ Ratio: Cost/Benefit ratio on x-axis of DCA plot ◦ Difference: ( Benefit - Cost )/Benefit Net Benefit (normalized) on y-axis of DCA plot • Estimating Cost/Benefit from clinical policy ◦ clinician willing to conduct 20 biopsies to find a high grade cancer, the probability threshold would be 5% ▪ – Net benefit approaches to the evaluation of prediction models, molecular markers, and diagnostic tests, Vickers et al 2015 Things that were unclear to me when first learning DCA • Equivalence of: ◦ Cost / Benefit ratio for clinical procedure ⇔ Model threshold : “Exchange rate” ◦ Both shown on same x-axis • Why are we so into varying threshold probability? ◦ “a) there are insufficient data on which to calculate a rational threshold, or b) patients can reasonably disagree about the appropriate threshold, due to different preferences for alternative health states” – Vickers in “Decision curve analysis: a discussion”, Steyerberg et al 2008, https://www.ncbi.nlm.nih.gov/pmc/articles/PMC2577563/ • What data is needed to construct DCA plot ◦ Y_true: True binary labels ◦ For models: Y_score: Estimated probability from model (thresholded to determine treatment decision) ◦ For rules: Treatment decision [0/1] • Interpretation of x axis: ◦ x=0.0 : no costs only benefits, x=1.0 : no benefits only costs ◦ X is both Cost / Benefit ratio ⇔ Model threshold • Interpretation of y axis: ◦ y=0.0 : do nothing implies no net benefit (no treatment) ◦ Y axis units: expectation of true-positive result, 1.0 is benefit of treating 1 diseased patient ◦ Max y value: prevalence; ie. mean benefit of treating all diseased patients
  12. Special thank you to: • Dr Andrew Vickers at Memorial

    Sloan Kettering Cancer Center for the data, comments and patience https://twitter.com/VickersBiostats • Dr Karandeep Singh at University of Michigan for your advice and patience https://twitter.com/kdpsinghlab Resources • http://decisioncurveanalysis.org/ • Vickers AJ, Elkin EB. Decision curve analysis: a novel method for evaluating prediction models. Medical Decision Making. 2006 Nov-Dec;26(6):565-74. https://pubmed.ncbi.nlm.nih.gov/17099194/ • Therapeutic decision making: a cost-benefit analysis, Pauker et al 1975 https://pubmed.ncbi.nlm.nih.gov/1143303/ • https://cran.r-project.org/web/packages/dcurves/ Email: [email protected] Twitter: @robinc Podcast: TalkRL.com
  13. End