Upgrade to Pro — share decks privately, control downloads, hide ads and more …

On the Evaluation of Binary Classifiers

On the Evaluation of Binary Classifiers

A brief tour of some aspects of evaluation for binary classifiers.

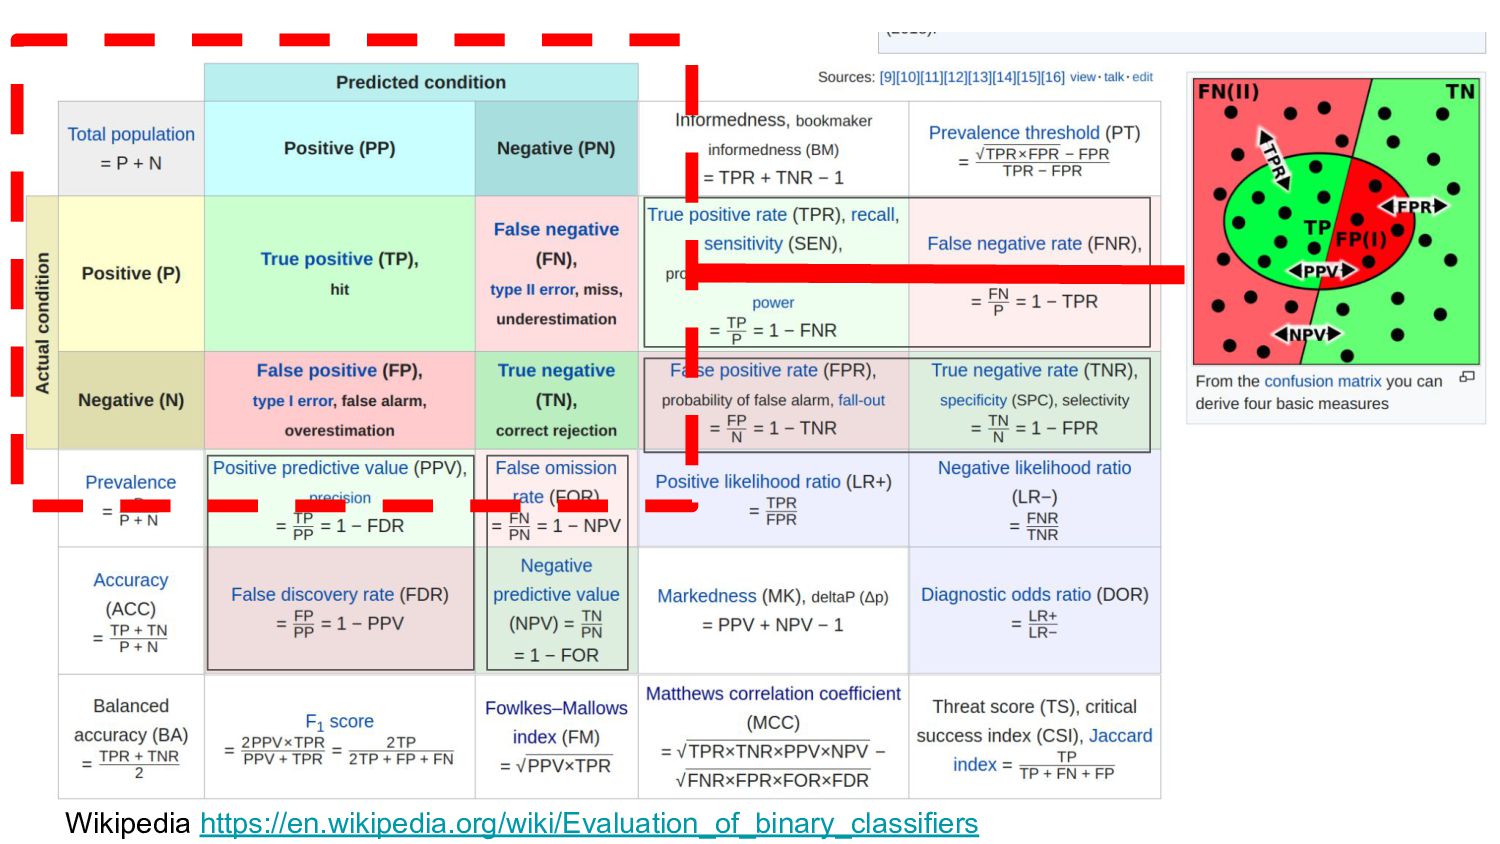
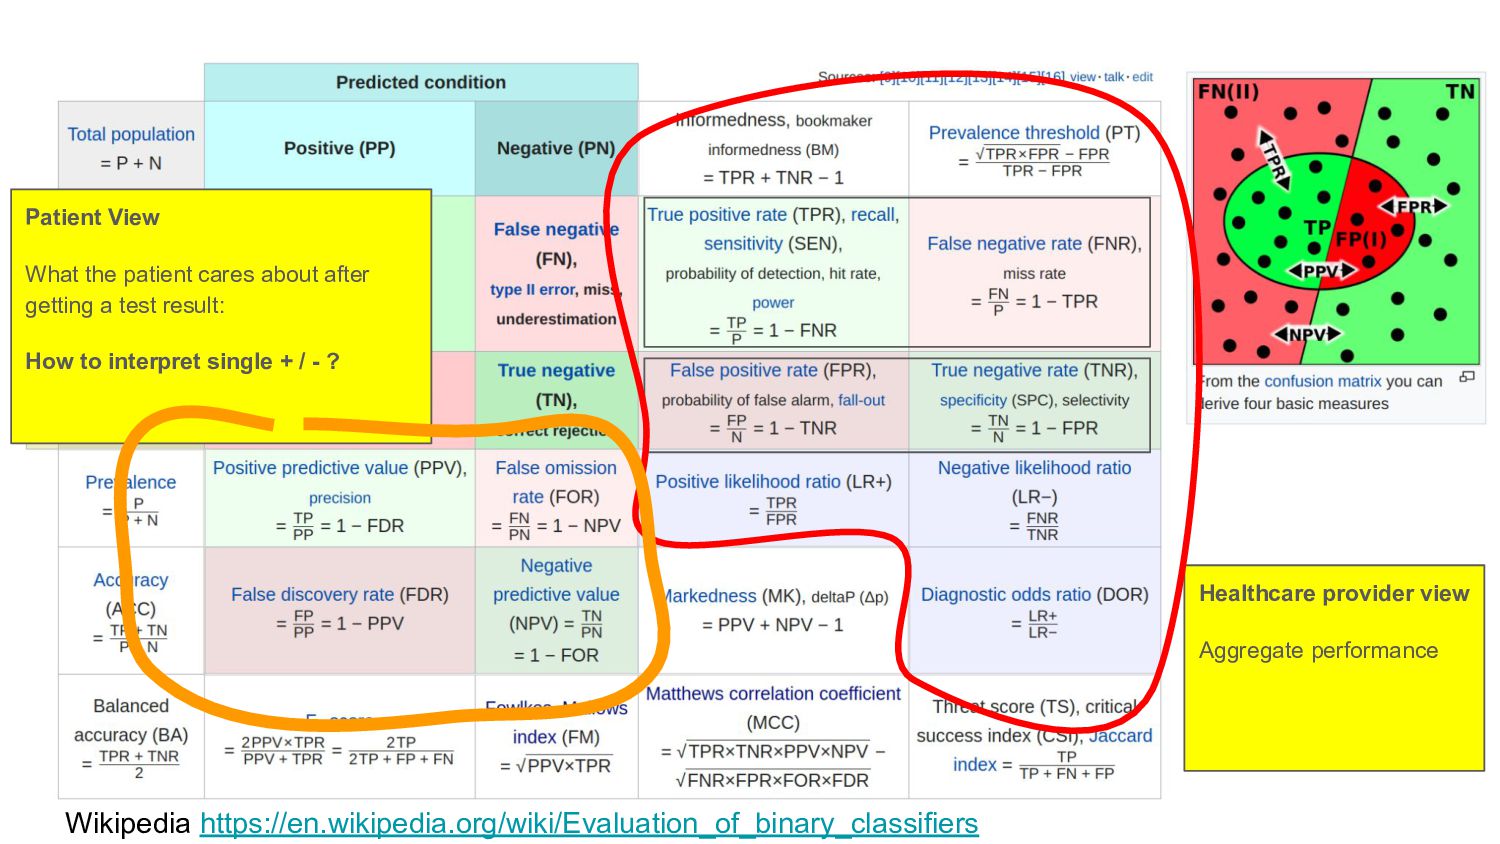
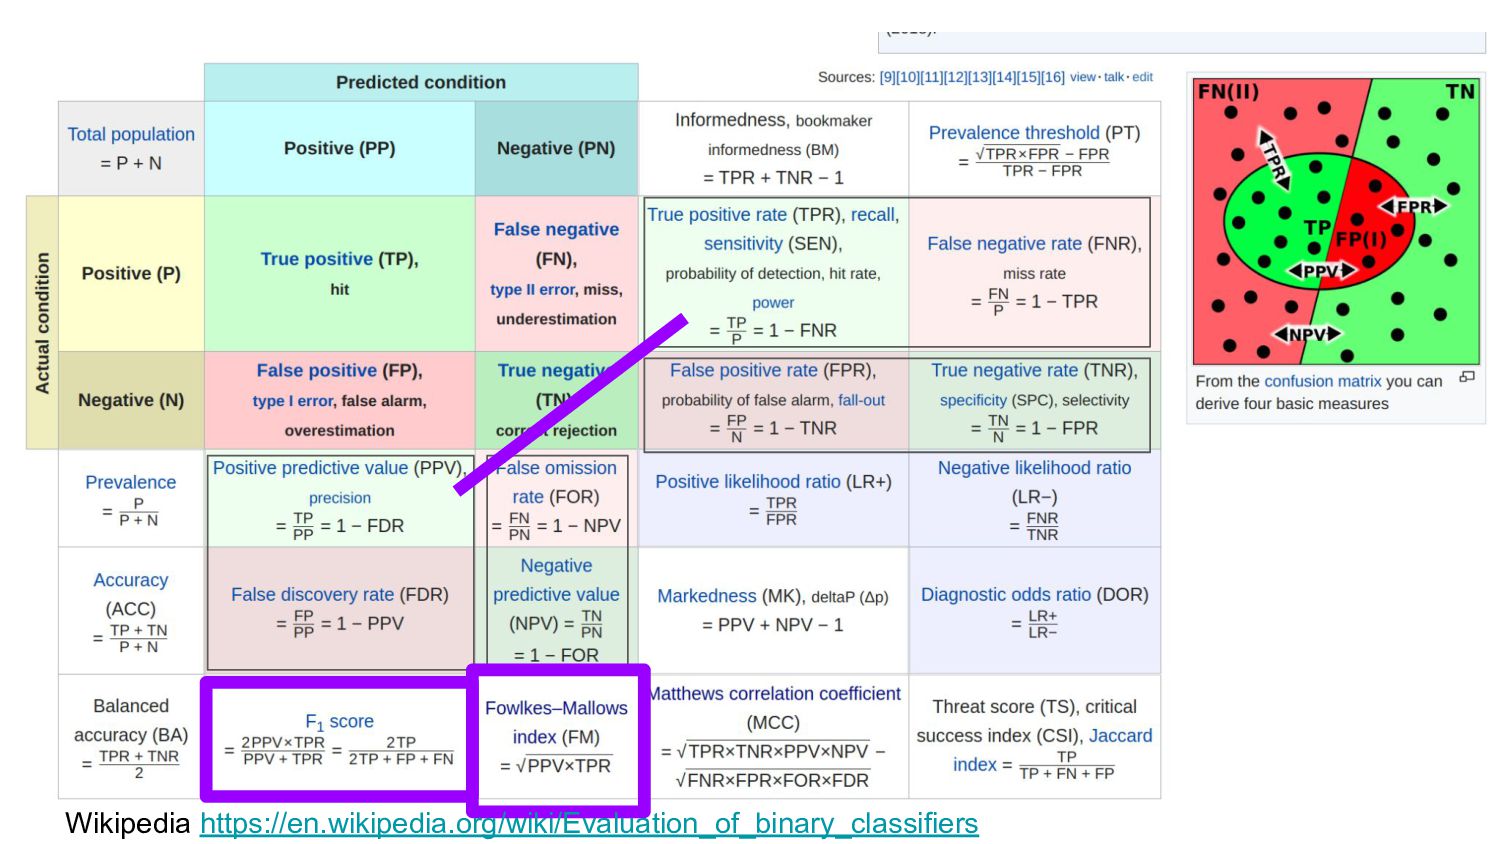
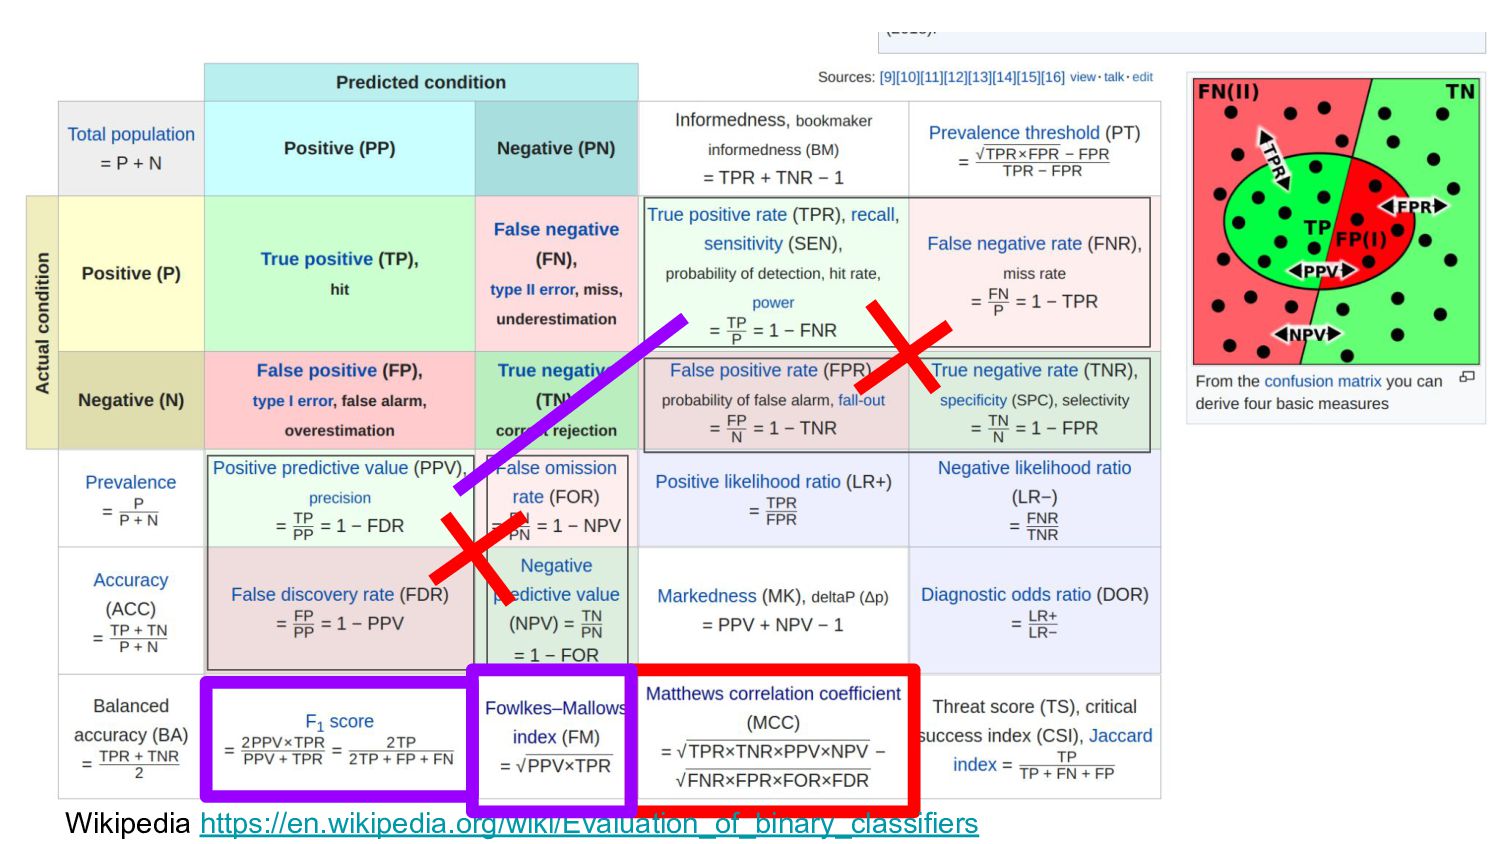
We look at Matthews Correlation Coefficient and compare its construction to some other popular metrics.

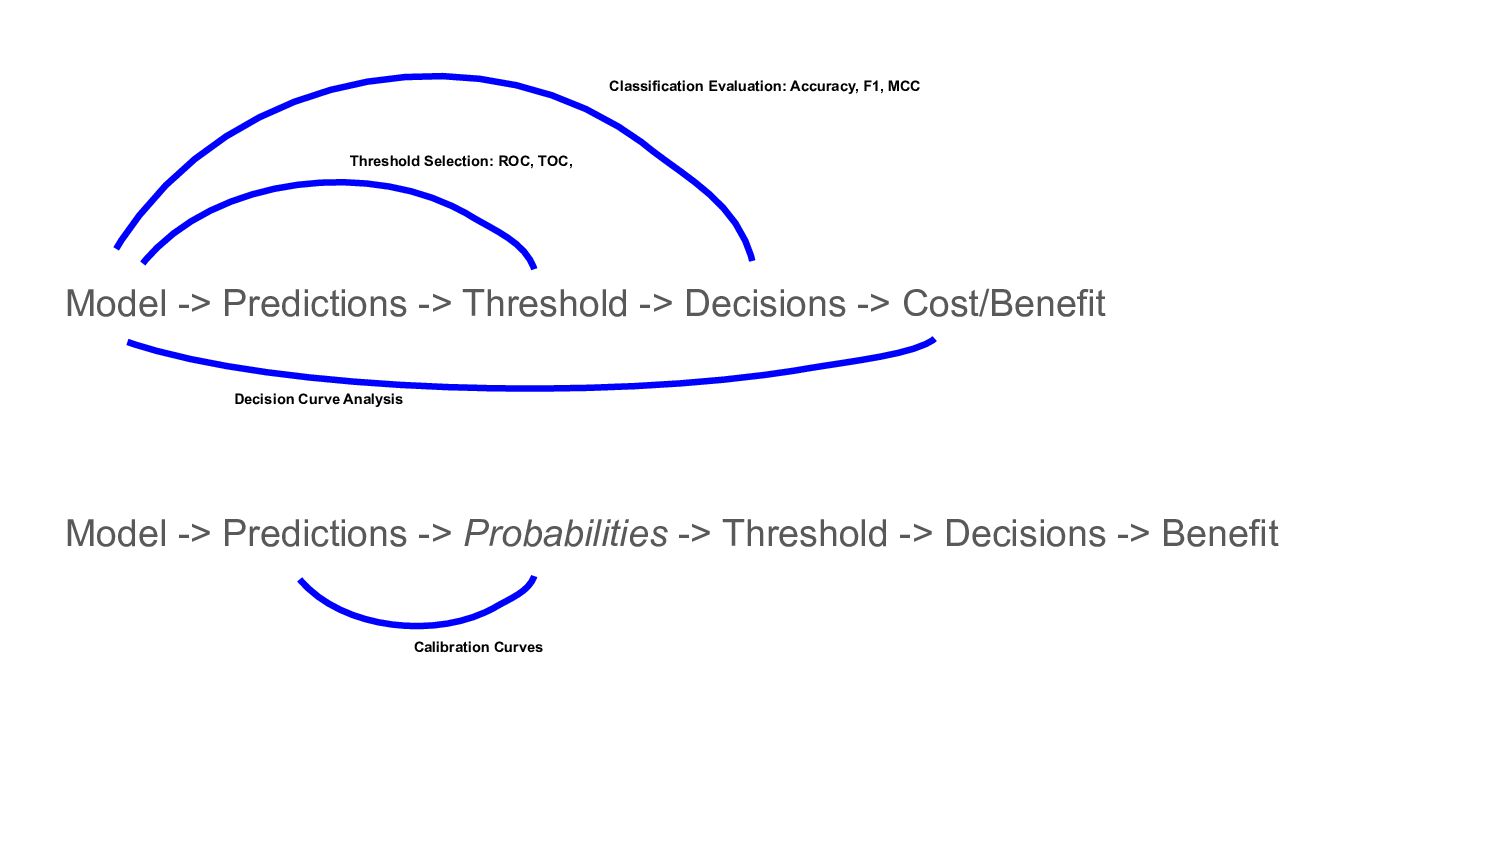
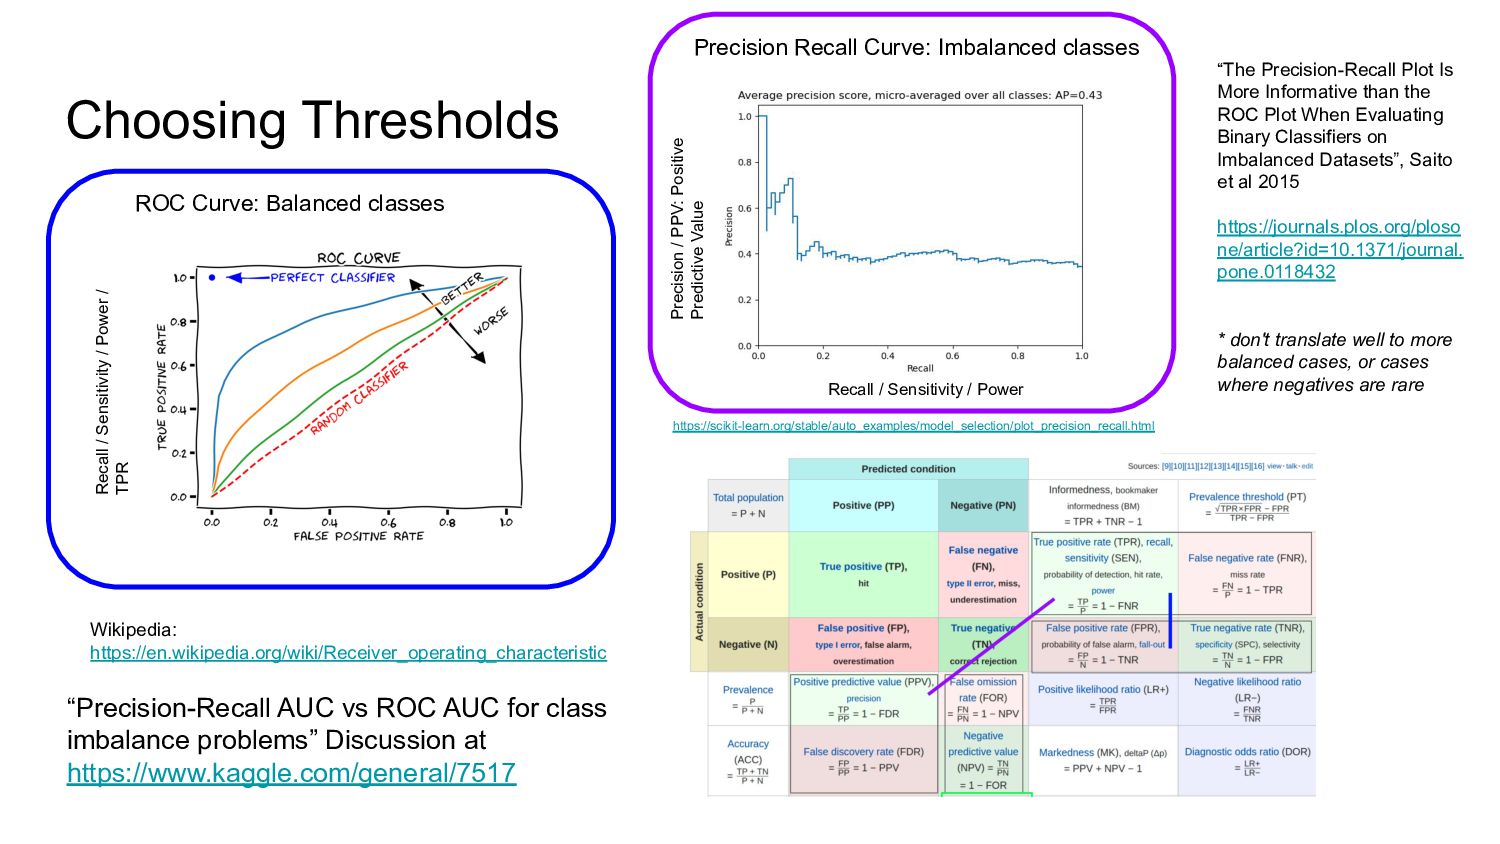
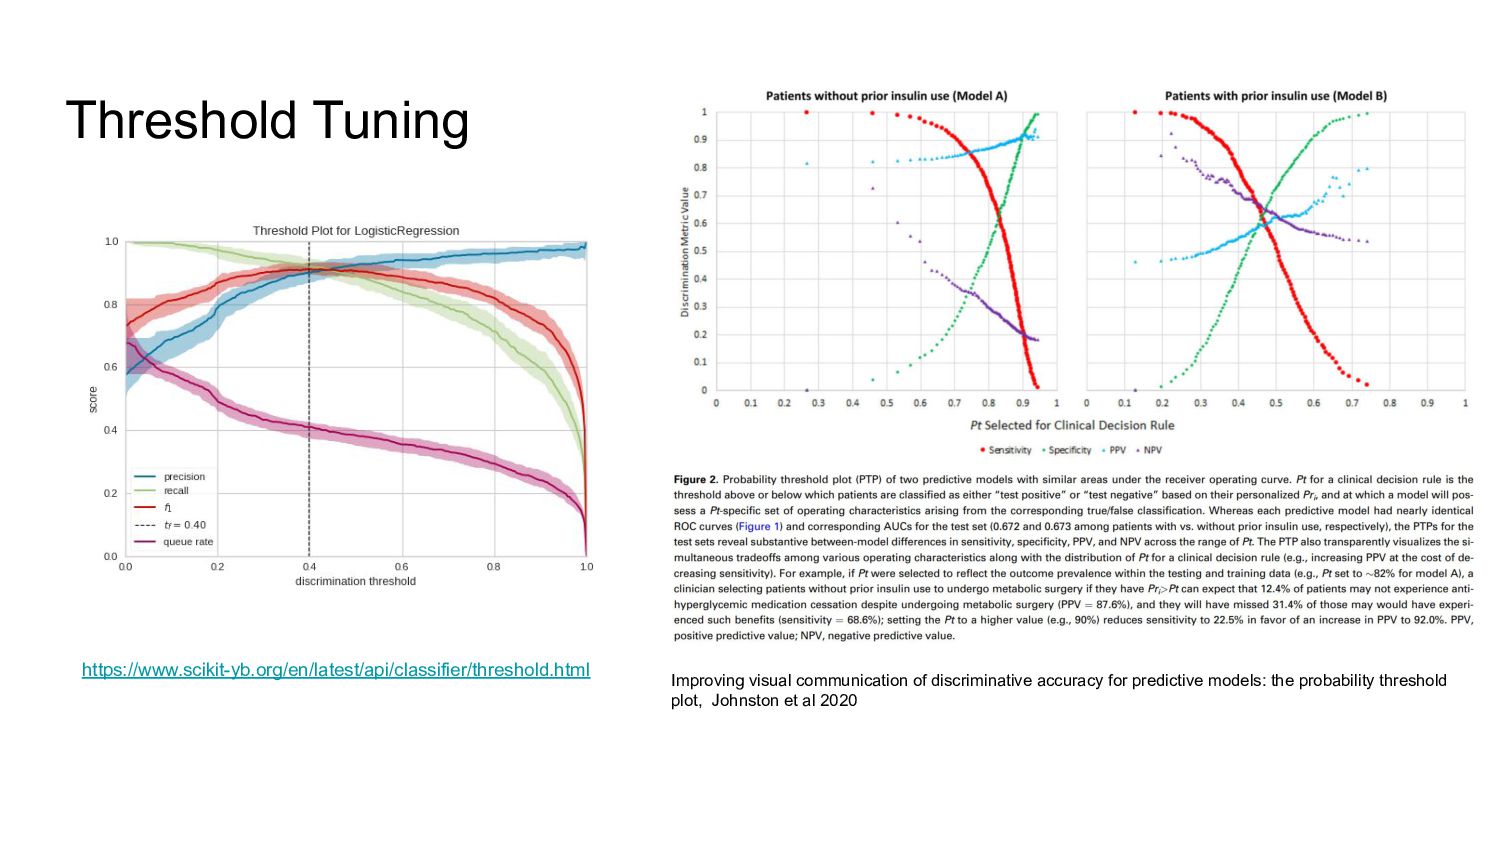
We look at the threshold selection problem.

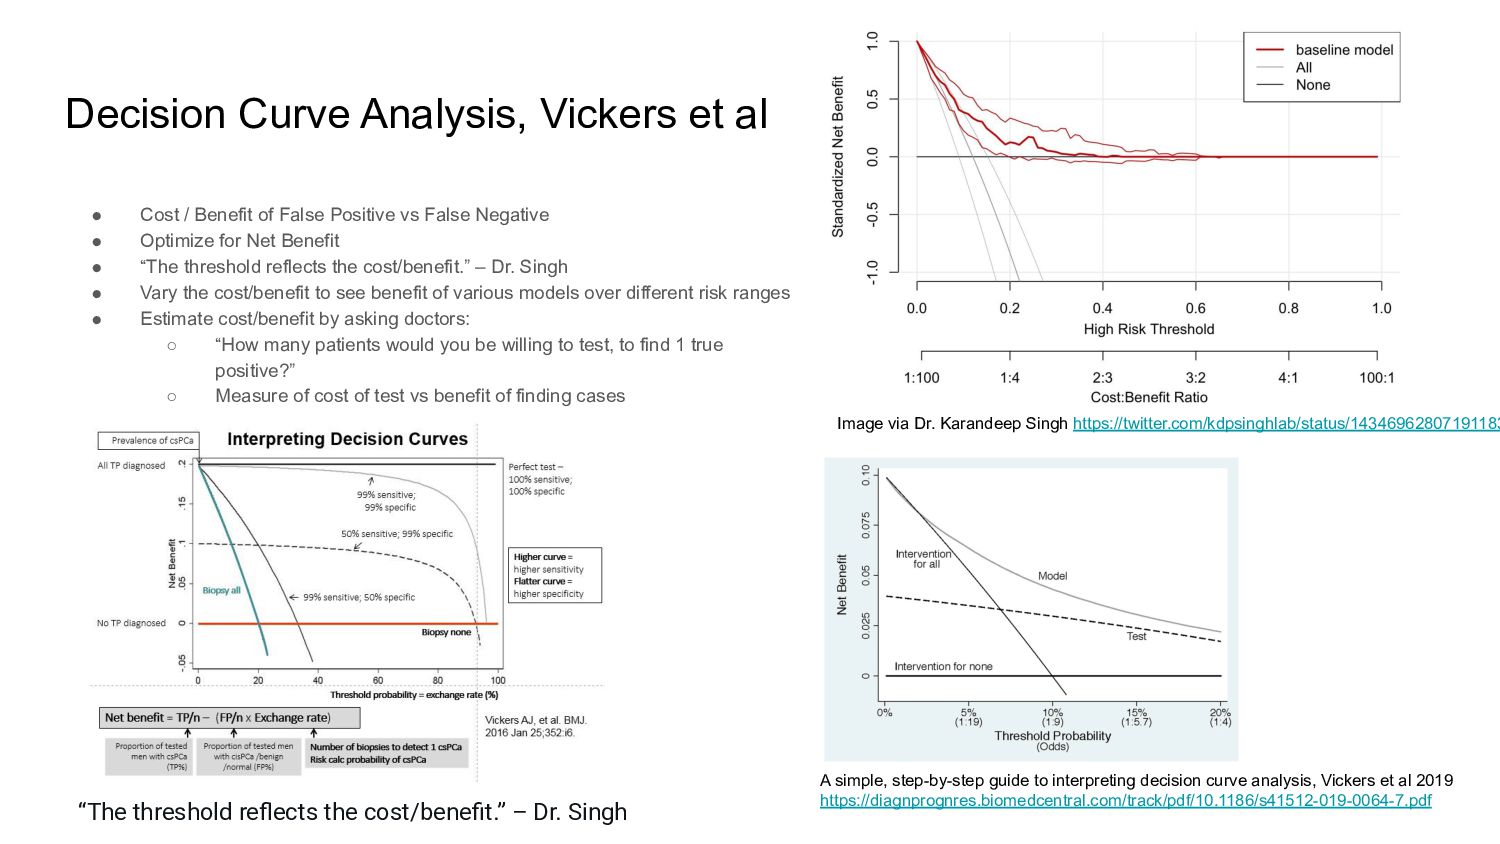
And we also touch on Decision Curve Analysis.

Robin Ranjit Singh Chauhan

January 17, 2022
Tweet

More Decks by Robin Ranjit Singh Chauhan

Other Decks in Technology

Transcript

  1. On the Evaluation of
    Binary Classifiers
    Robin Chauhan
    https://twitter.com/robinc
    Image credit: Alex Borland, “Man With Metal Detector”

    View Slide

  2. Model -> Predictions -> Threshold -> Decisions -> Cost/Benefit
    Model -> Predictions -> Probabilities -> Threshold -> Decisions -> Benefit
    Calibration Curves
    Decision Curve Analysis
    Classification Evaluation: Accuracy, F1, MCC
    Threshold Selection: ROC, TOC,

    View Slide

  3. Wikipedia https://en.wikipedia.org/wiki/Evaluation_of_binary_classifiers

    View Slide

  4. Patient View
    What the patient cares about after
    getting a test result:
    How to interpret single + / - ?
    Healthcare provider view
    Aggregate performance
    Wikipedia https://en.wikipedia.org/wiki/Evaluation_of_binary_classifiers

    View Slide

  5. Wikipedia https://en.wikipedia.org/wiki/Evaluation_of_binary_classifiers

    View Slide

  6. Recall / Sensitivity / Power /
    TPR
    Wikipedia:
    https://en.wikipedia.org/wiki/Receiver_operating_characteristic
    Precision Recall Curve: Imbalanced classes
    ROC Curve: Balanced classes
    “Precision-Recall AUC vs ROC AUC for class
    imbalance problems” Discussion at
    https://www.kaggle.com/general/7517
    Recall / Sensitivity / Power
    https://scikit-learn.org/stable/auto_examples/model_selection/plot_precision_recall.html
    Choosing Thresholds
    “The Precision-Recall Plot Is
    More Informative than the
    ROC Plot When Evaluating
    Binary Classifiers on
    Imbalanced Datasets”, Saito
    et al 2015
    https://journals.plos.org/ploso
    ne/article?id=10.1371/journal.
    pone.0118432
    * don't translate well to more
    balanced cases, or cases
    where negatives are rare
    Precision / PPV: Positive
    Predictive Value

    View Slide

  7. Total Operating Characteristic (TOC) Curve
    ● More info than ROC
    ● Provides equiv of full contingency table
    https://en.wikipedia.org/wiki/Total_operating_characteristic

    View Slide

  8. Wikipedia https://en.wikipedia.org/wiki/Evaluation_of_binary_classifiers

    View Slide

  9. Wikipedia https://en.wikipedia.org/wiki/Evaluation_of_binary_classifiers
    Matthews correlation
    coefficient
    = √(TPR×TNR×PPV×NPV) −
    √(FNR×FPR×FOR×FDR)
    But:
    FOR = 1-NPV
    FDR = 1-PPV
    FPR = 1-TNR
    FNR = 1-TPR
    = √(TPR×TNR×PPV×NPV) −
    √((1-TPR)×(1-TNR)×(1-PPV)x(1-NPV))

    View Slide

  10. Matthews correlation coefficient
    = √(TPR×TNR×PPV×NPV) −
    √((1-TPR)×(1-TNR)×(1-PPV)x(1-NPV))
    = √“goodness?” [0-1] - √“badness?” [0-1]
    => [-1,+1]

    Wikipedia https://en.wikipedia.org/wiki/Evaluation_of_binary_classifiers

    View Slide

  11. Matthews correlation coefficient
    = √(TPR×TNR×PPV×NPV) − √( (1-TPR)×(1-TNR)×(1-PPV)x(1-NPV) )
    ● “Healthcare provider view”
    ○ TPR / Recall / Sensitivity / Power
    ■ “What proportion of the Positives did we correctly detect?”
    ○ TNR / Specificity / Selectivity
    ■ “What proportion of the Negatives did we correctly detect?”
    ● “Patient view”
    ● PPV
    ○ “When I get a positive prediction, what’s the chance its a true positive?”
    ● NPV
    ○ “When I get a negative prediction, what’s the chance its a true negative?”
    ● Symmetry: Positive and Negative treated identically (unlike F1)
    MCC == Pearson correlation coefficient == Phi Coefficient “ϕ” or “r
    ϕ

    "The advantages of the Matthews correlation coefficient (MCC) over F1 score and accuracy in binary classification evaluation", Chicco
    et al 2020 https://pubmed.ncbi.nlm.nih.gov/31898477/
    MCC introduced in 1975:
    B. W. Matthews, ‘‘Comparison of the predicted and observed secondary structure of t4 phage lysozyme,’’ Biochimica et Biophysica
    Acta (BBA)- Protein Struct., vol. 405, no. 2, pp. 442–451, Oct. 1975

    View Slide

  12. Threshold Tuning
    https://www.scikit-yb.org/en/latest/api/classifier/threshold.html
    Improving visual communication of discriminative accuracy for predictive models: the probability threshold
    plot, Johnston et al 2020

    View Slide

  13. Decision Curve Analysis, Vickers et al
    ● Cost / Benefit of False Positive vs False Negative
    ● Optimize for Net Benefit
    ● “The threshold reflects the cost/benefit.” – Dr. Singh
    ● Vary the cost/benefit to see benefit of various models over different risk ranges
    ● Estimate cost/benefit by asking doctors:
    ○ “How many patients would you be willing to test, to find 1 true
    positive?”
    ○ Measure of cost of test vs benefit of finding cases
    A simple, step-by-step guide to interpreting decision curve analysis, Vickers et al 2019
    https://diagnprognres.biomedcentral.com/track/pdf/10.1186/s41512-019-0064-7.pdf
    Image via Dr. Karandeep Singh https://twitter.com/kdpsinghlab/status/14346962807191183
    “The threshold reflects the cost/benefit.” – Dr. Singh

    View Slide

  14. Calibration Curves
    https://scikit-learn.org/stable/modules/calibration.html

    View Slide

  15. Thank you!
    Questions?
    [email protected]

    View Slide