Upgrade to Pro — share decks privately, control downloads, hide ads and more …

Energy, transport and resilience

Robin
November 26, 2014

Energy, transport and resilience

Presentation at AURIN - http://aurin.org.au/ - on my work to date and what I plan to be doing during a research placement in Melbourne.

Robin

November 26, 2014
Tweet

More Decks by Robin

Other Decks in Research

Transcript

  1. Presented at AURIN, Melbourne, 26th Nov. 2014 Energy, transport and

    resilience Robin Lovelace, University of Leeds Background Research interests Work at AURIN Where next?
  2. Erasmus year in Salamanca Above: view from my 'piso' and

    where I leaned Castilian Below: a book that heavily influenced my thinking
  3. 1 Yr MSc in Environmental Science (York), PhD in 'E-futures'

    (Sheffield) • Growing interest in behaviour + environment • Energy: root of many problems http://campfire.theoildrum.com/node/6
  4. Research interests E.g. see Hopkins (2013), Berners-Lee and Clarke (2013)

    Environmental problems Climate change Recession Energy
  5. National-level comparisons Average energy costs per one way trip to

    work in English regions (2001) and Dutch provinces (2010)
  6. Application to the energy crisis Trips vs distance vs energy

    use measures of transport system performance. See Lovelace and Philips (2014).
  7. Research in Leeds • "Volunteered Geographical Information" to inform geographical

    models • Testing of the "iterative proportional fitting" (IPF) algorithm • International study of the energy costs of commuting • Analysis of cyclist accident data and the spatial distribution of perceptions of risk • Analysis of the UK's cycle network using Open Street Map • Twitter data to understand response to Hurricane Sandy
  8. Teaching materials • Book chapter on spatial data visualisation in

    R. • Comprehensive tutorial on making maps in R. • Book contract with CRC press • Tutorial on import + analysis of OSM data.
  9. Software Software I use • R for data analysis •

    QGIS, PostGIS + R for GIS • Command line Linux tools (osmosis, grep) • LaTeX, Markdown and GitHub Things I'm learning • Web mapping (Leaflet, OpenLayers, .js) • GeoNode • RNetLogo • Shiny
  10. Main activities out here • Research multi-criteria resilience metrics, building

    on Dodson and Sipe (2005) • Australian transport energy use • Learn about AURIN • Lasting collaborations
  11. Achievements so far • 'Data wrangling' to get flow data

    in suitable 'tidy' (Wickham, 2014) form for analysis • Australian geographical zones • Find datasets for indicators • 'Melbourne Tweets'
  12. Where next? "We’re not going to be able to burn

    it all. Over the course of the next several decades, we’re going to have to build a ramp from how we currently use energy to where we need to use energy. And we’re not going to suddenly turn off a switch and suddenly we’re no longer using fossil fuels, but we have to use this time wisely, so that you have a tapering off of fossil fuels replaced by clean energy sources" (Obama, 2014)
  13. Create flexible 'resilience' indicators "Ultimately, we conclude that the social

    and spatial distribution of oil vulnerability depends on how an energy-con- strained future is envisioned" (Lovelace and Philips, 2014).
  14. Datasets ready for deployment • Mode of travel to work

    • Long-distance commute (Victoria) • Social variables (Victoria) • Likelihood of flooding (altitude) Variables to be calculated • Proximity to key services (OSM + GIS) • Distance of commute (ABS statistics)
  15. Some resilience metrics of interest: • Resilience to coastal flooding

    • Resilience to disease • Resilience to oil price shocks • Resilience to austerity
  16. Policy impact • Ultimately it's about 'evidence-based policy' • Because

    approach is not prescriptive, should be more attractive politically • But most use probably local urban planners and decision makers • Make discussion of future more realistic
  17. Plug: R for big data workshop • To be held

    on 5th December • We'll be using the dplyr package • To analyse Tweet and OD data of Melbourne
  18. References Dodson, J., & Sipe, N. (2005). Oil Vulnerability in

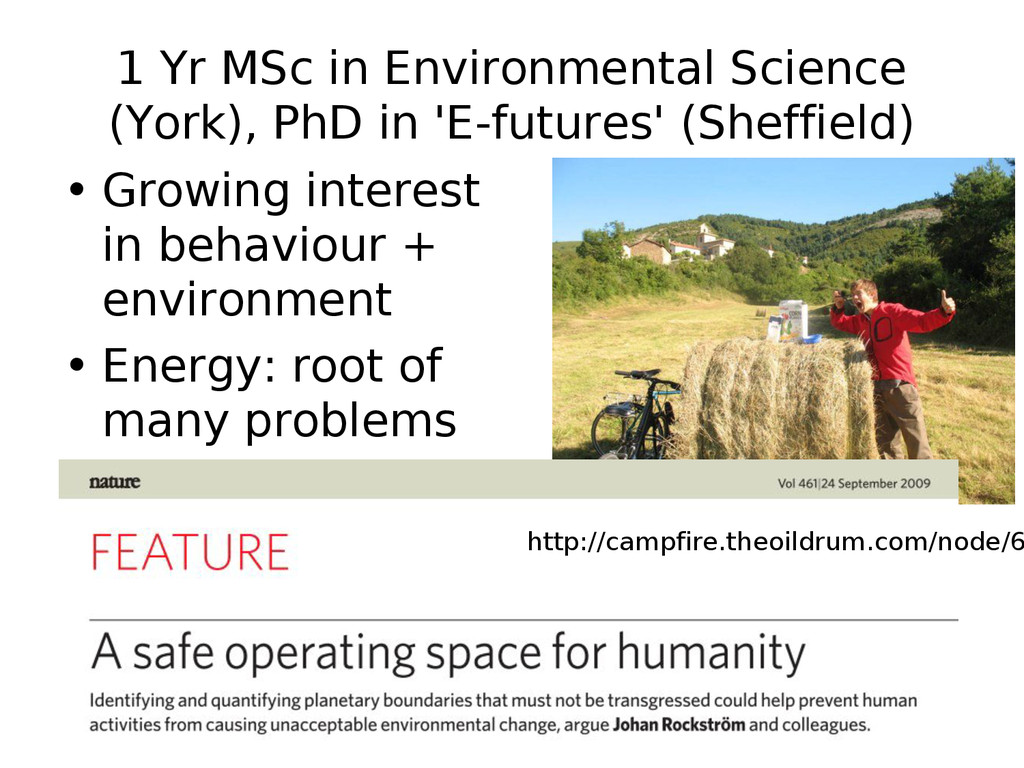
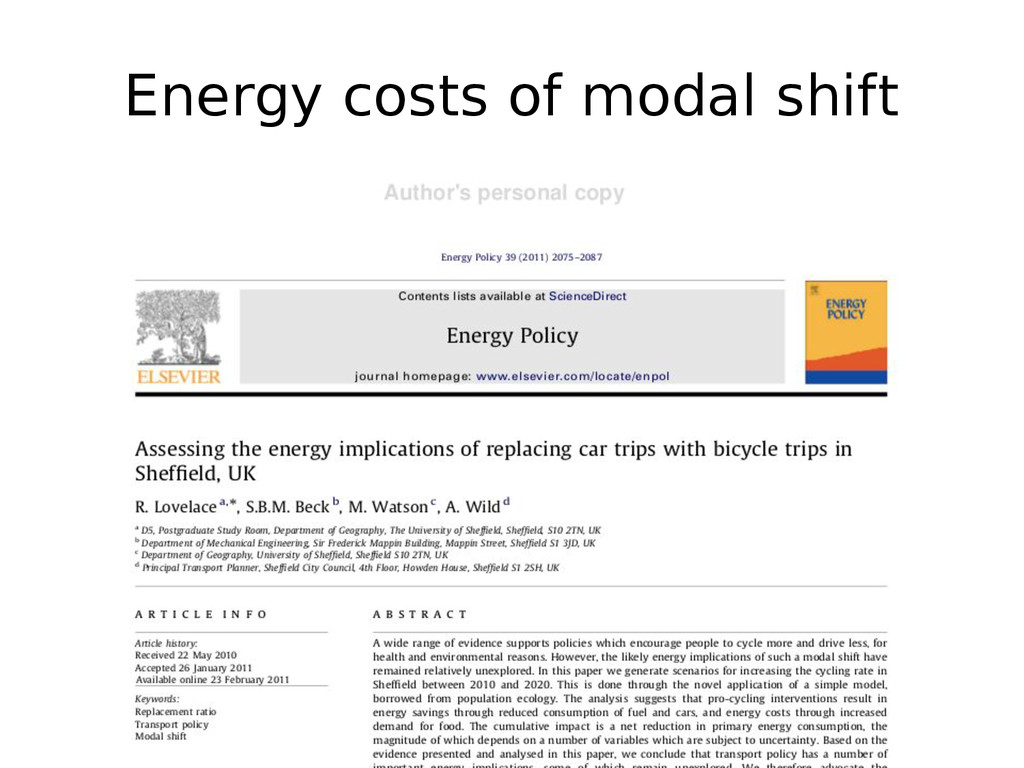
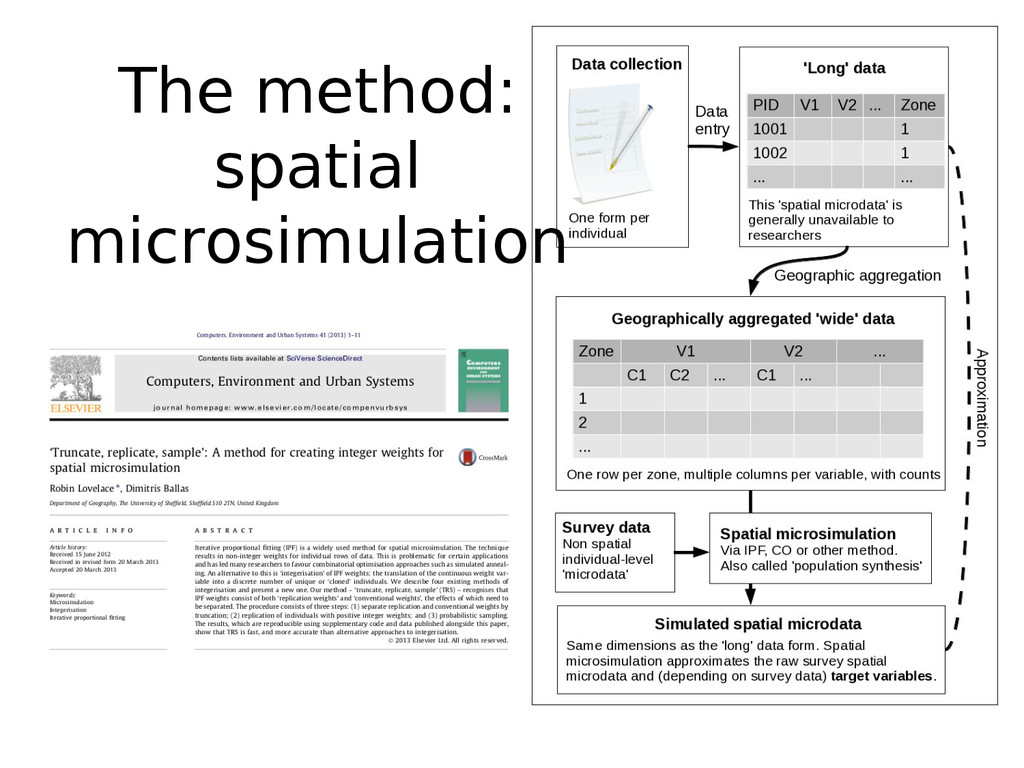
    the Australian City. Lovelace, R. et al. (2011). Assessing the energy implications of replacing car trips with bicycle trips in Sheffield, UK. Energy Policy, 39(4). Lovelace, R., & Ballas, D. (2013). “Truncate, replicate, sample”: A method for creating integer weights for spatial microsimulation. Computers, Environment and Urban Systems, 41, 1–11. Lovelace, R., Ballas, D., & Watson, M. (2014). A spatial microsimulation approach for the analysis of commuter patterns: from individual to regional levels. Journal of Transport Geography, 34(0), 282–296. Lovelace, R., & Philips, I. (2014). The “oil vulnerability” of commuter patterns: A case study from Yorkshire and the Humber, UK. Geoforum, 51(0), 169–182. Obama, B. (2014). Quoted in 'Obama on Obama on Climate', NY Times. Rockstrom, J et al. (2009). A safe operating space for humanity. Nature, 461(7263). Wickham, H. (2014). Tidy data. The Journal of Statistical Software, 14(5). Retrieved from http://www.jstatsoft.org/v59/i10 .