clinical literature • Describe some of the key deficiencies regularly seen in both model development and model validation studies • Discuss a few (published) examples of poor design & methodology and poor reporting
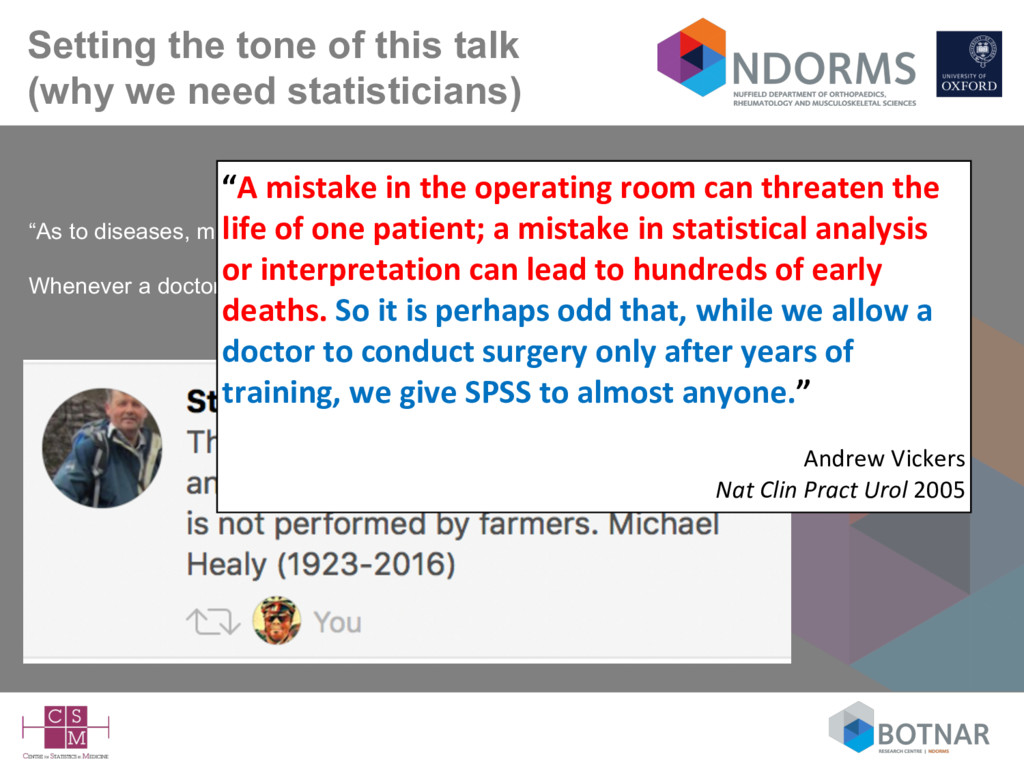
“As to diseases, make a habit of two things — to help, or at least, to do no harm Whenever a doctor cannot do good, [s]he must be kept from doing harm.” Hippocrates “A mistake in the operating room can threaten the life of one patient; a mistake in statistical analysis or interpretation can lead to hundreds of early deaths. So it is perhaps odd that, while we allow a doctor to conduct surgery only after years of training, we give SPSS to almost anyone.” Andrew Vickers Nat Clin Pract Urol 2005
multiple predictors for a particular individual to the probability of • having a particular (undiagnosed) disease => diagnostic • developing a particular health state within a specific time period in the future => prognostic • Collectively diagnostic and prognostic models are called (risk, clinical) prediction models
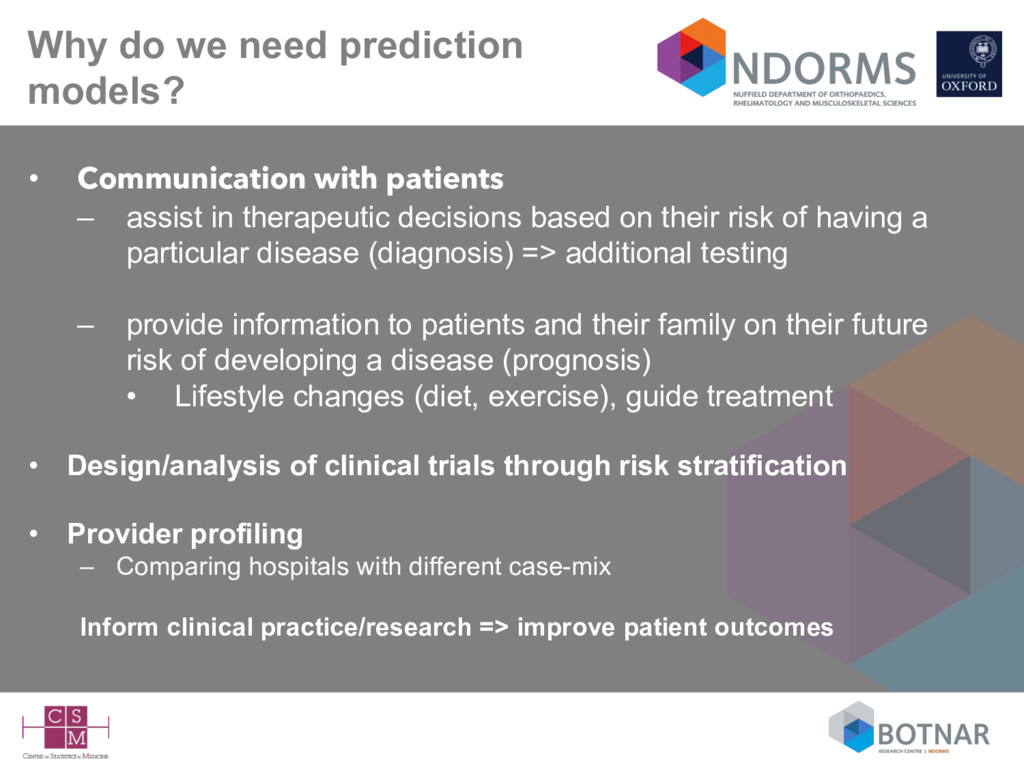
– assist in therapeutic decisions based on their risk of having a particular disease (diagnosis) => additional testing – provide information to patients and their family on their future risk of developing a disease (prognosis) • Lifestyle changes (diet, exercise), guide treatment • Design/analysis of clinical trials through risk stratification • Provider profiling – Comparing hospitals with different case-mix Inform clinical practice/research => improve patient outcomes
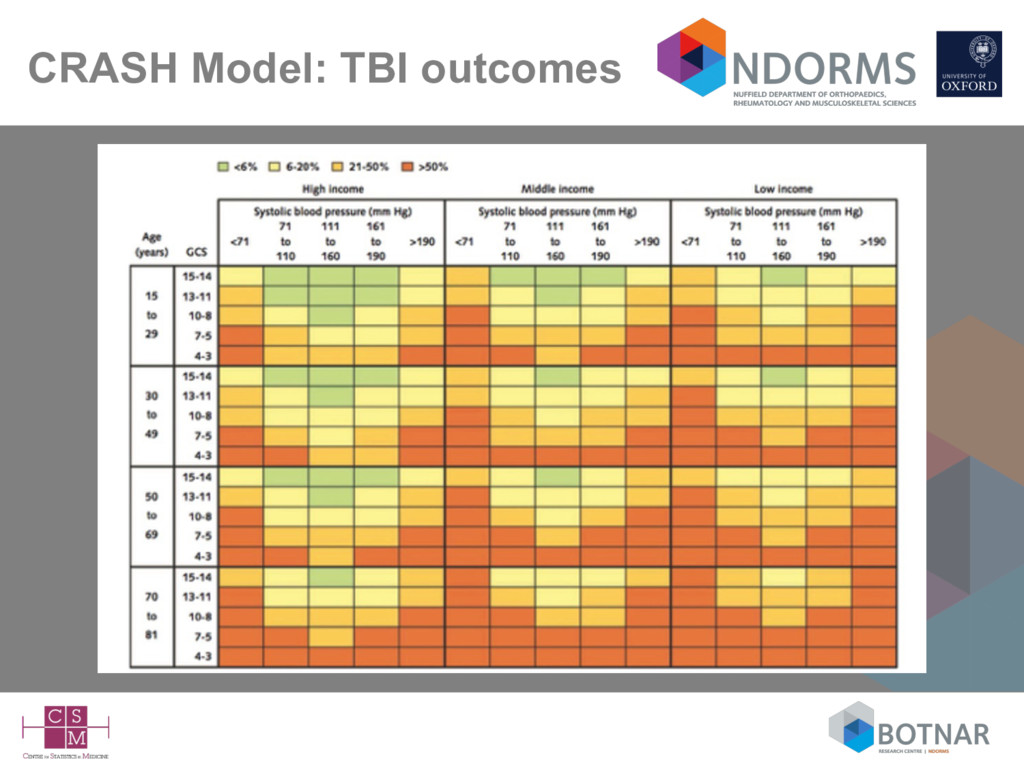
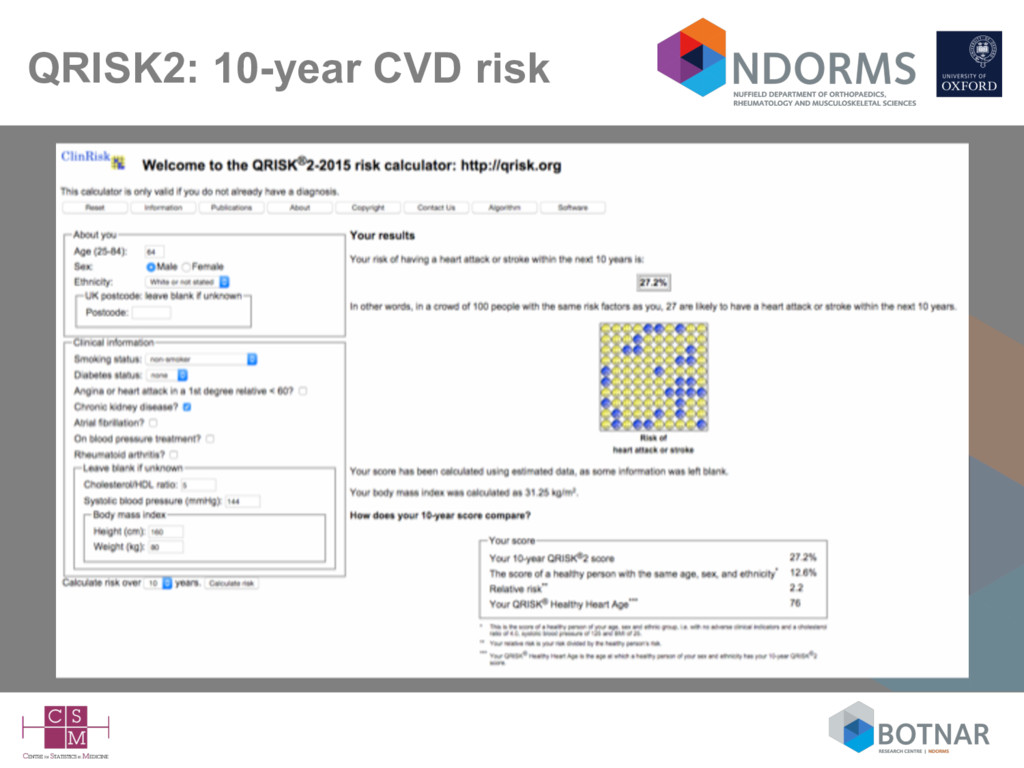
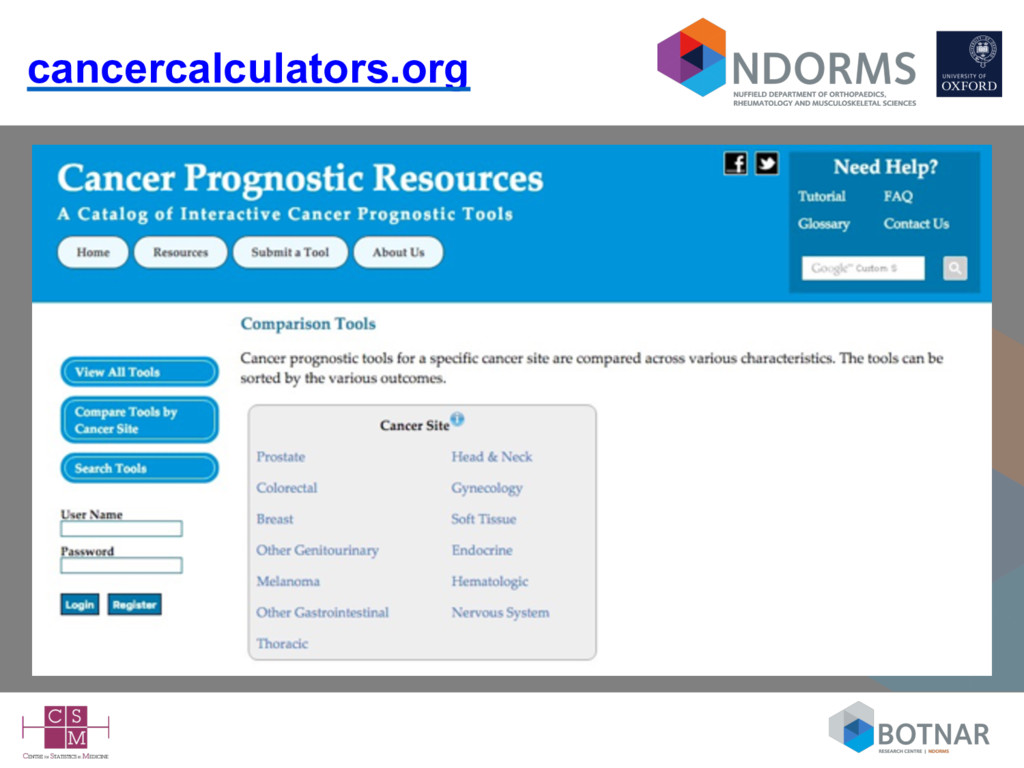
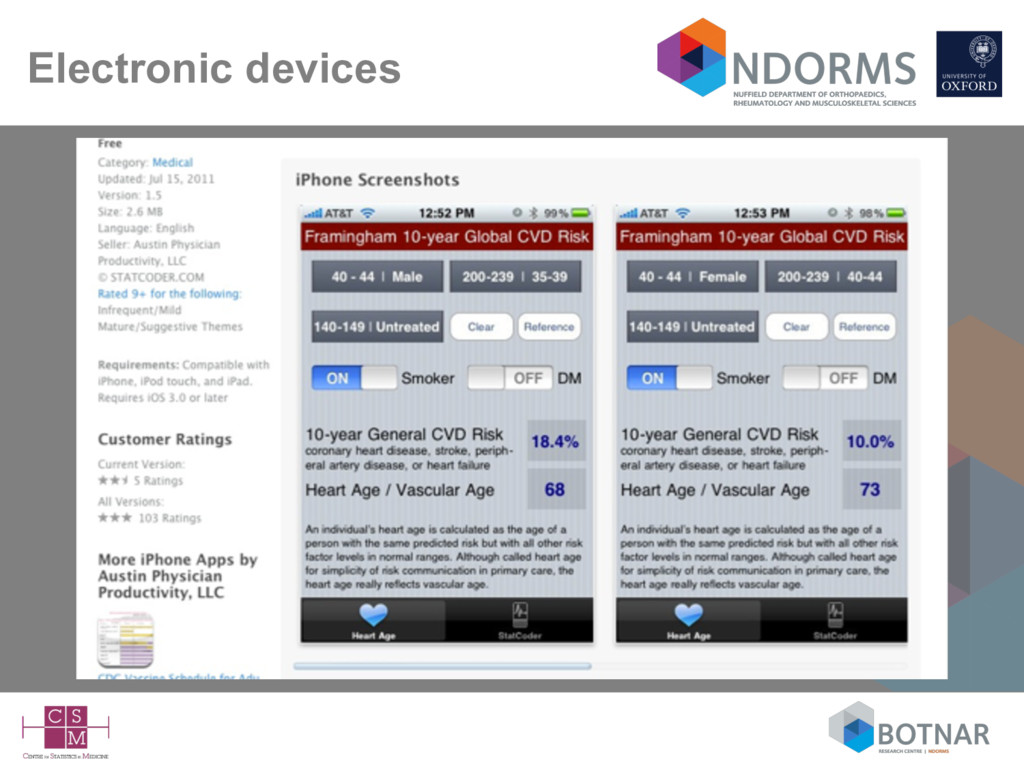
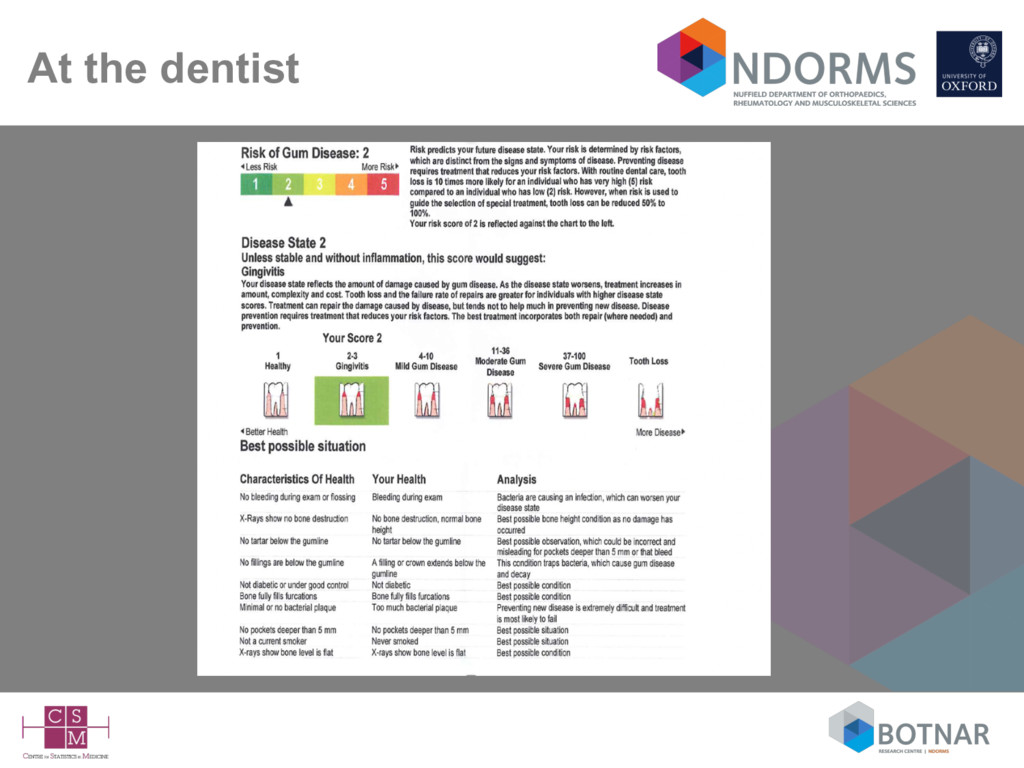
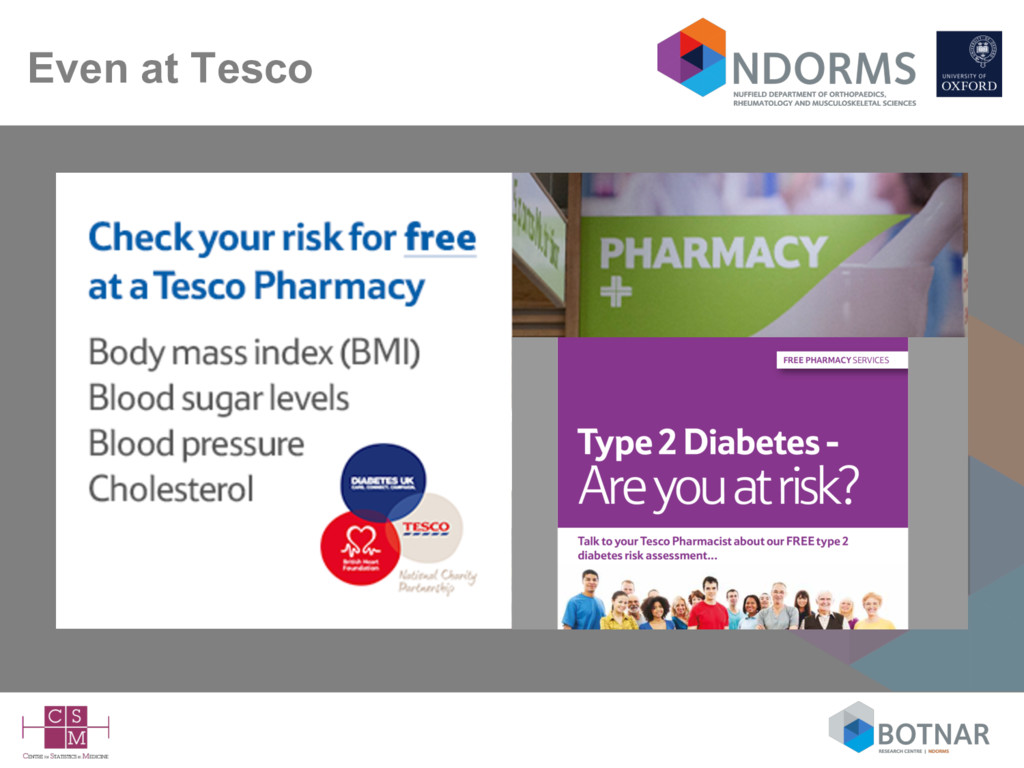
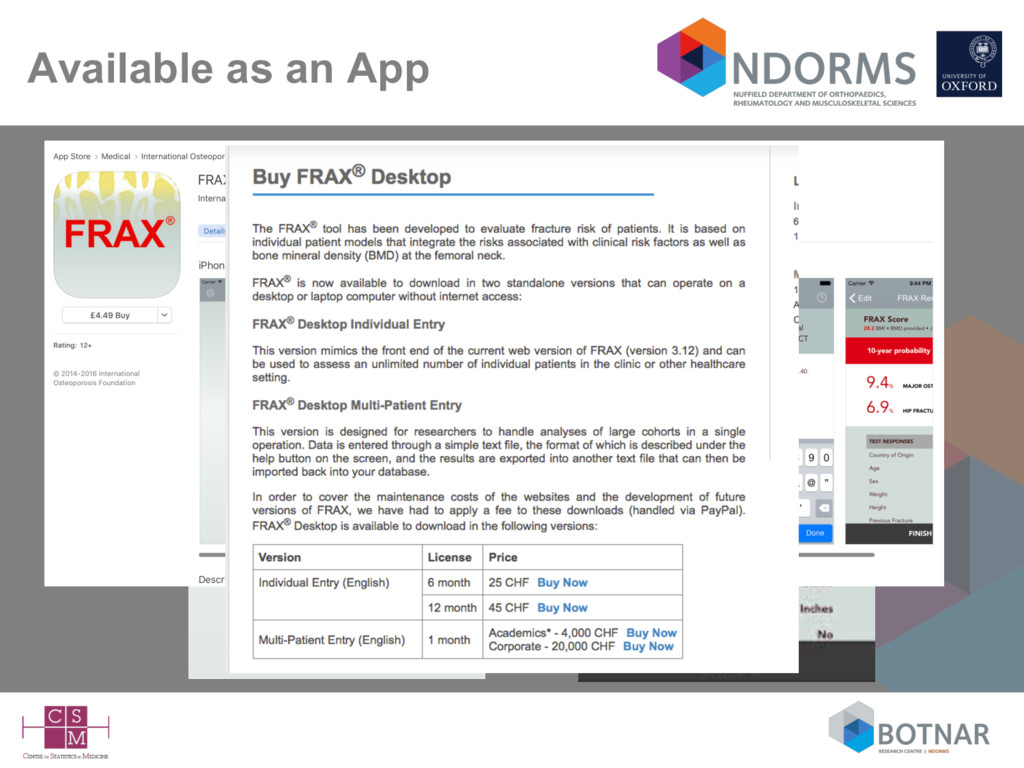
risk – often referred to as prognostic models, prediction models/rules, predictive models/scores, risk scores, scores, risk stratification tools,… • Typically they are presented as – mathematical (regression) formula – simple scores (e.g., regression coefficients rounded to integers) – nomograms (graphical) – score charts (graphical) – increasingly as web calculators and apps for devices (Gray, Diab Med 2013; Rabin, Cancer Epidemiol 2013; Kempf, 2017 [to appear]) • Available to the general public (as well as doctors)
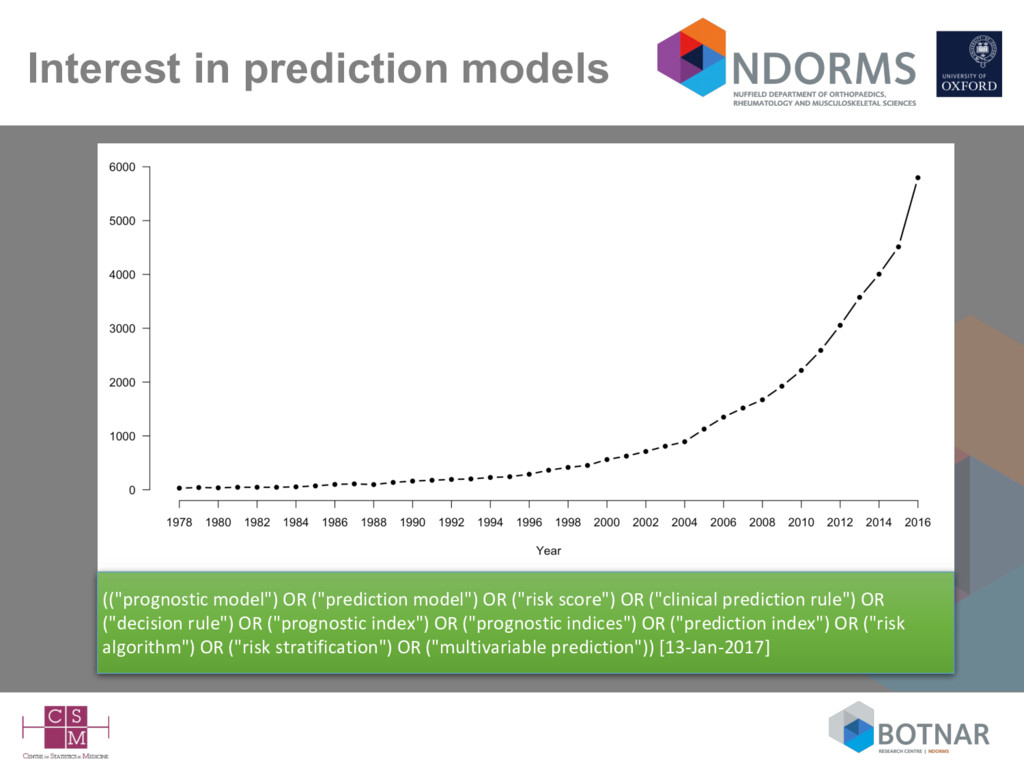
("risk score") OR ("clinical prediction rule") OR ("decision rule") OR ("prognostic index") OR ("prognostic indices") OR ("prediction index") OR ("risk algorithm") OR ("risk stratification") OR ("multivariable prediction")) [13-Jan-2017]
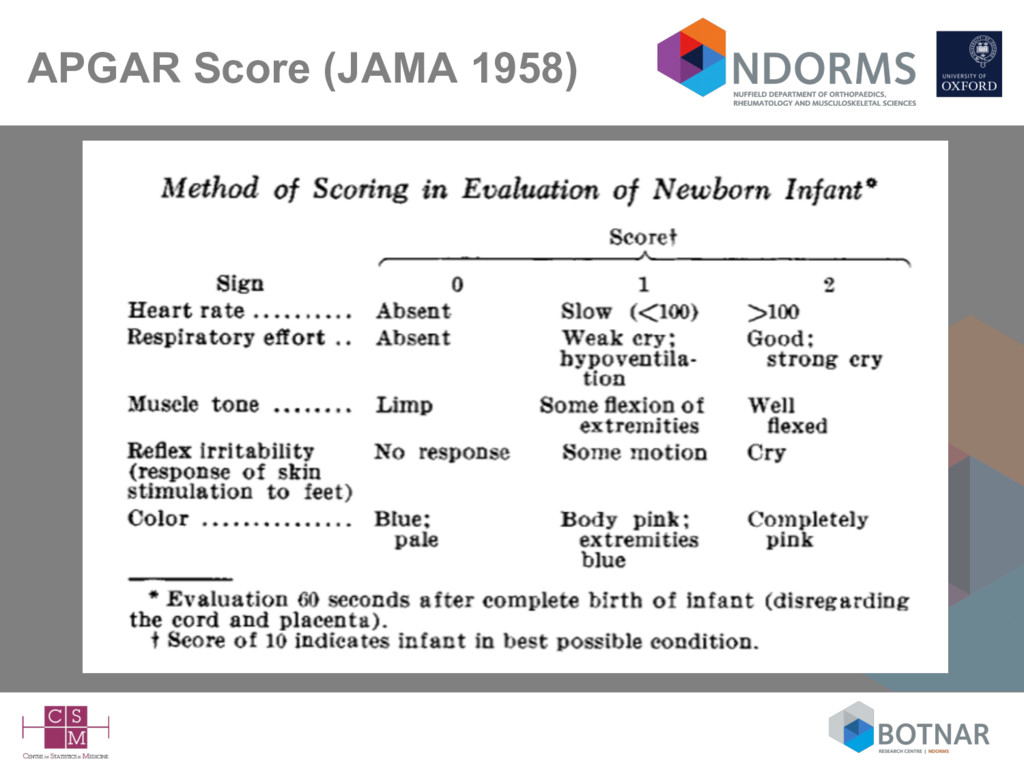
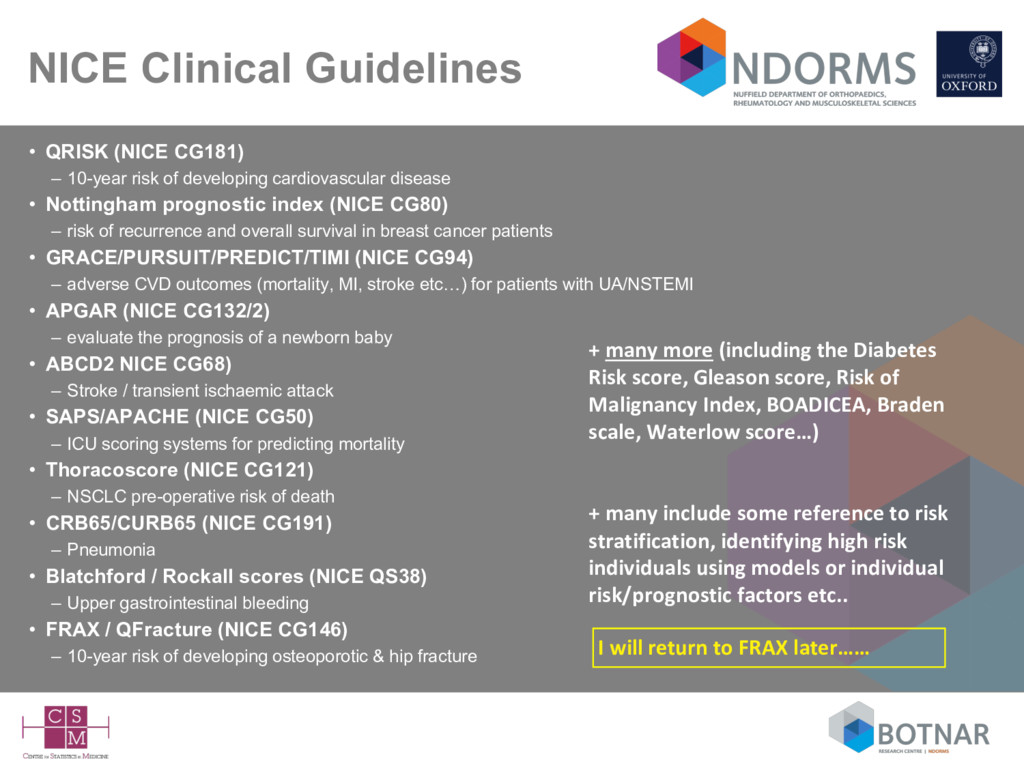
of developing cardiovascular disease • Nottingham prognostic index (NICE CG80) – risk of recurrence and overall survival in breast cancer patients • GRACE/PURSUIT/PREDICT/TIMI (NICE CG94) – adverse CVD outcomes (mortality, MI, stroke etc…) for patients with UA/NSTEMI • APGAR (NICE CG132/2) – evaluate the prognosis of a newborn baby • ABCD2 NICE CG68) – Stroke / transient ischaemic attack • SAPS/APACHE (NICE CG50) – ICU scoring systems for predicting mortality • Thoracoscore (NICE CG121) – NSCLC pre-operative risk of death • CRB65/CURB65 (NICE CG191) – Pneumonia • Blatchford / Rockall scores (NICE QS38) – Upper gastrointestinal bleeding • FRAX / QFracture (NICE CG146) – 10-year risk of developing osteoporotic & hip fracture + many more (including the Diabetes Risk score, Gleason score, Risk of Malignancy Index, BOADICEA, Braden scale, Waterlow score…) I will return to FRAX later…… + many include some reference to risk stratification, identifying high risk individuals using models or individual risk/prognostic factors etc..
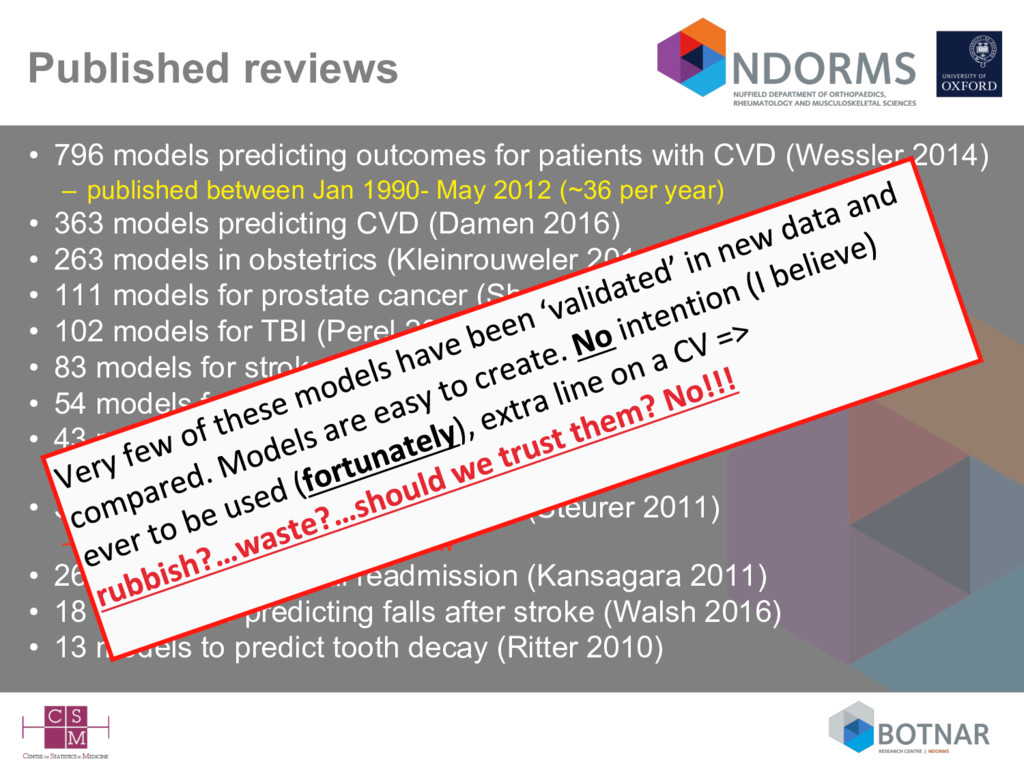
CVD (Wessler 2014) – published between Jan 1990- May 2012 (~36 per year) • 363 models predicting CVD (Damen 2016) • 263 models in obstetrics (Kleinrouweler 2016) • 111 models for prostate cancer (Shariat 2006) • 102 models for TBI (Perel 2006) • 83 models for stroke (Counsell 2001) • 54 models for breast cancer (Altman 2009) • 43 models for type 2 diabetes (Collins 2011) – 30+ more have since been published • 31 models for osteoporotic fracture (Steurer 2011) – excluded FRAX from the review • 26 models for hospital readmission (Kansagara 2011) • 18 models for predicting falls after stroke (Walsh 2016) • 13 models to predict tooth decay (Ritter 2010)
no statistician involved • Many published with no intention (???) of being used (fortunately) • Most are never/rarely cited • Rarely are prediction model studies protocol driven – very few are published – (difficult to get funding for) • Extra line on a CV • => ‘waste in research’? - Lancet series in 2014
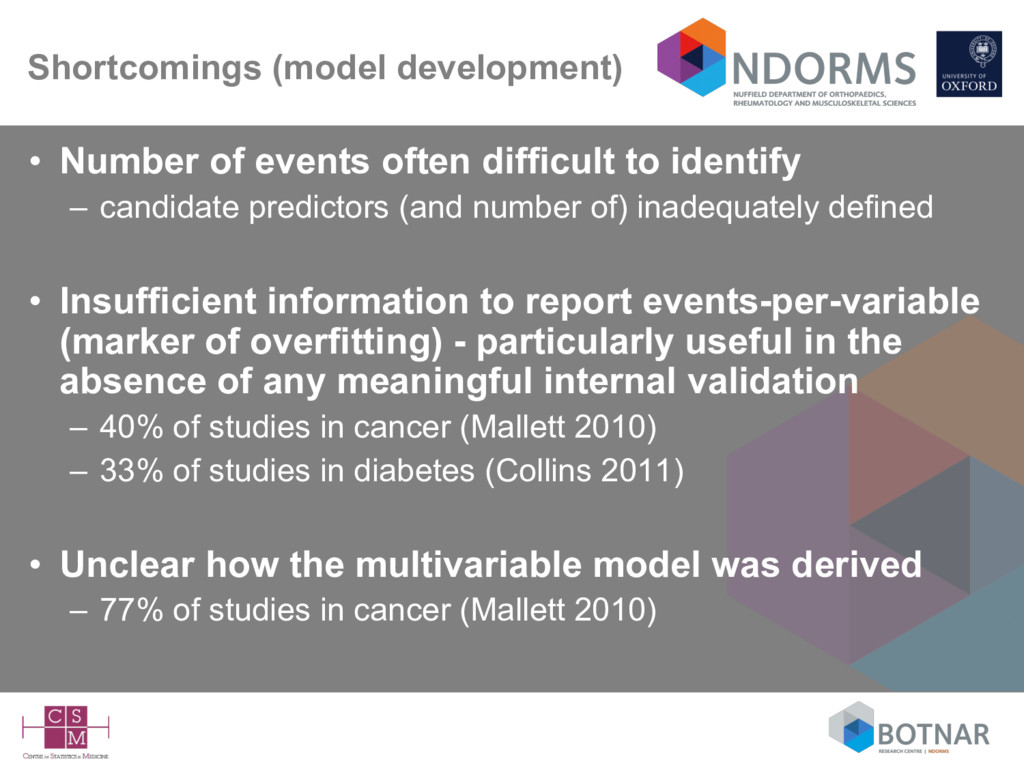
identify – candidate predictors (and number of) inadequately defined • Insufficient information to report events-per-variable (marker of overfitting) - particularly useful in the absence of any meaningful internal validation – 40% of studies in cancer (Mallett 2010) – 33% of studies in diabetes (Collins 2011) • Unclear how the multivariable model was derived – 77% of studies in cancer (Mallett 2010)
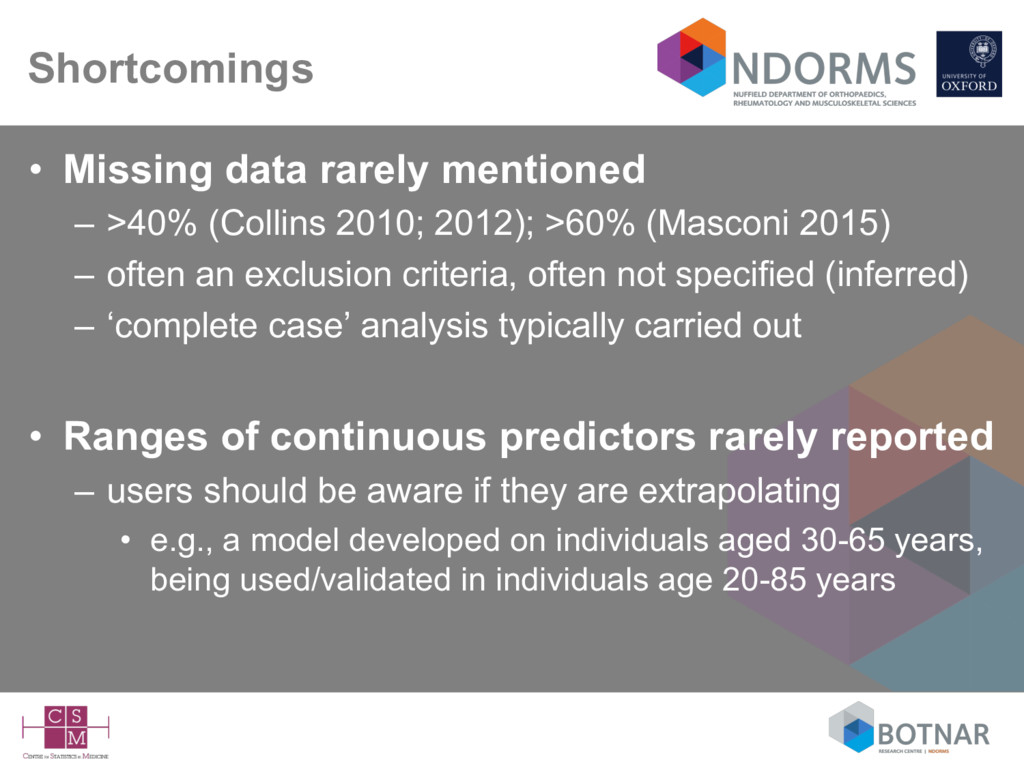
2012); >60% (Masconi 2015) – often an exclusion criteria, often not specified (inferred) – ‘complete case’ analysis typically carried out • Ranges of continuous predictors rarely reported – users should be aware if they are extrapolating • e.g., a model developed on individuals aged 30-65 years, being used/validated in individuals age 20-85 years
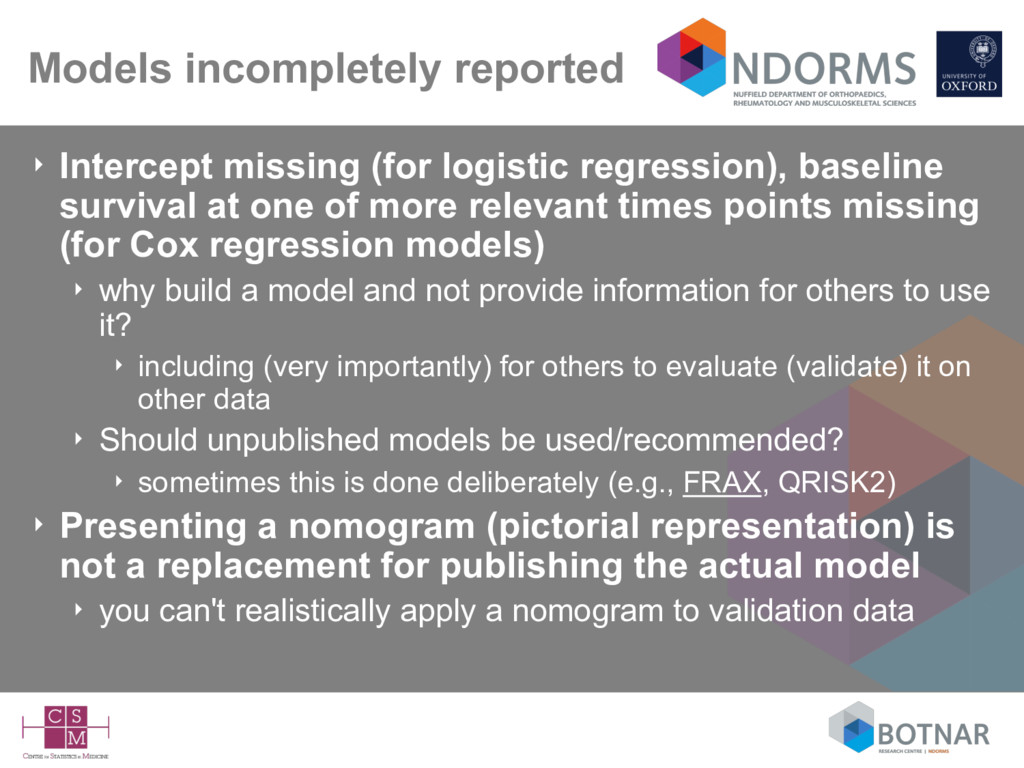
survival at one of more relevant times points missing (for Cox regression models) ‣ why build a model and not provide information for others to use it? ‣ including (very importantly) for others to evaluate (validate) it on other data ‣ Should unpublished models be used/recommended? ‣ sometimes this is done deliberately (e.g., FRAX, QRISK2) ‣ Presenting a nomogram (pictorial representation) is not a replacement for publishing the actual model ‣ you can't realistically apply a nomogram to validation data
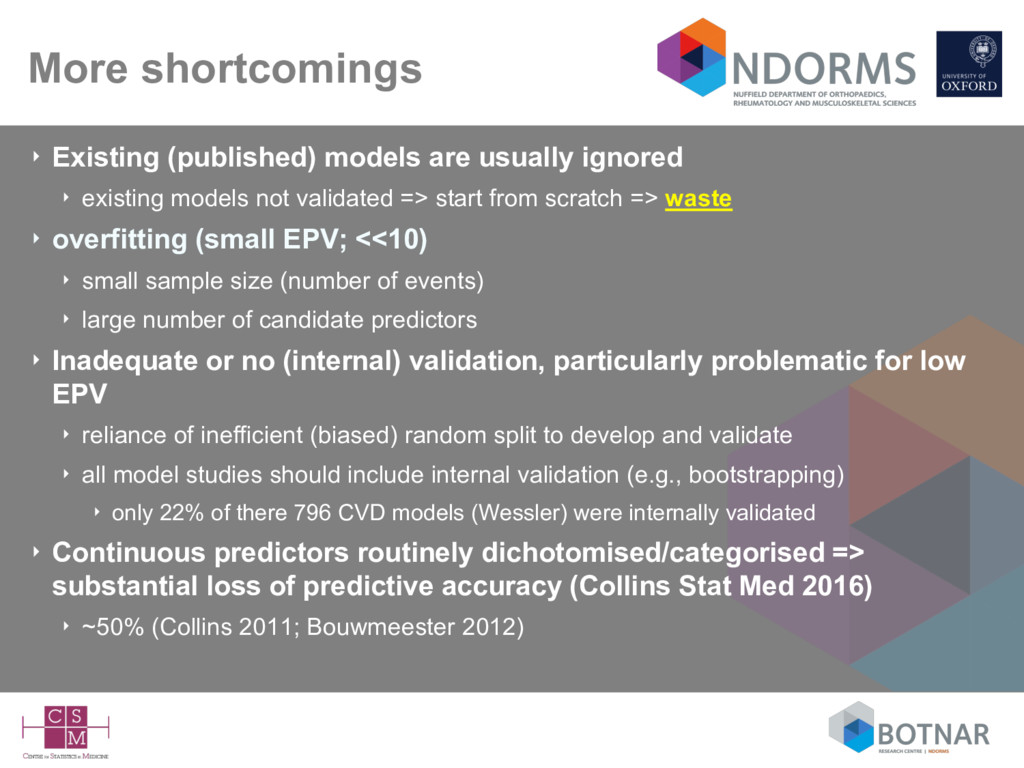
existing models not validated => start from scratch => waste ‣ overfitting (small EPV; <<10) ‣ small sample size (number of events) ‣ large number of candidate predictors ‣ Inadequate or no (internal) validation, particularly problematic for low EPV ‣ reliance of inefficient (biased) random split to develop and validate ‣ all model studies should include internal validation (e.g., bootstrapping) ‣ only 22% of there 796 CVD models (Wessler) were internally validated ‣ Continuous predictors routinely dichotomised/categorised => substantial loss of predictive accuracy (Collins Stat Med 2016) ‣ ~50% (Collins 2011; Bouwmeester 2012)
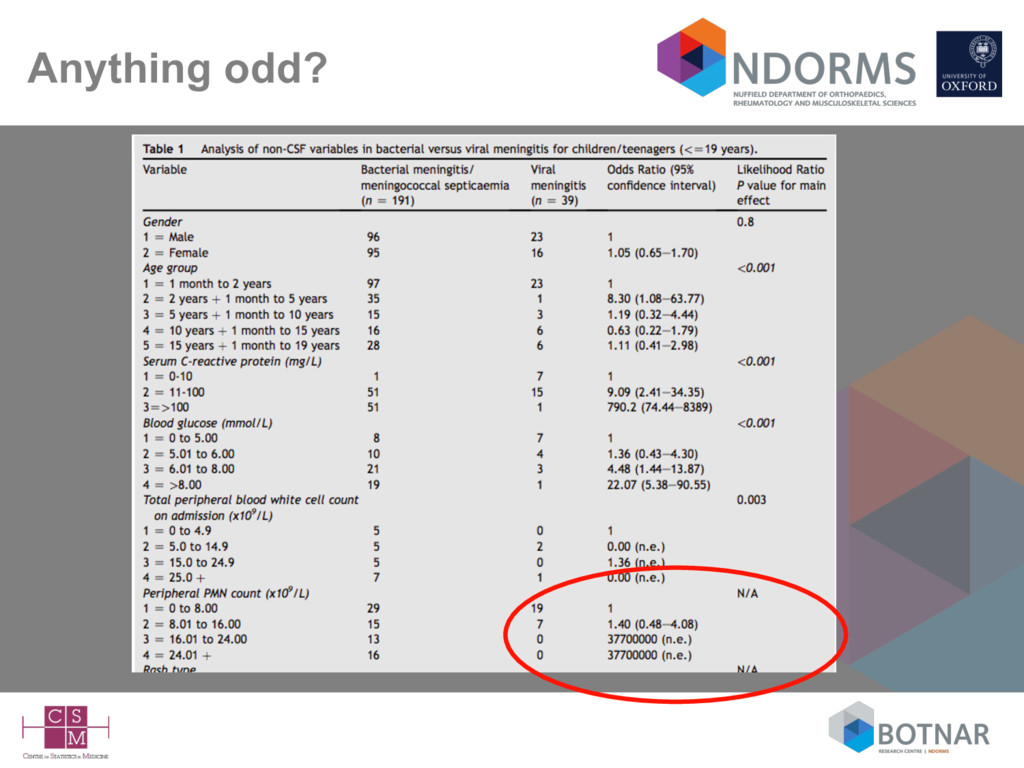
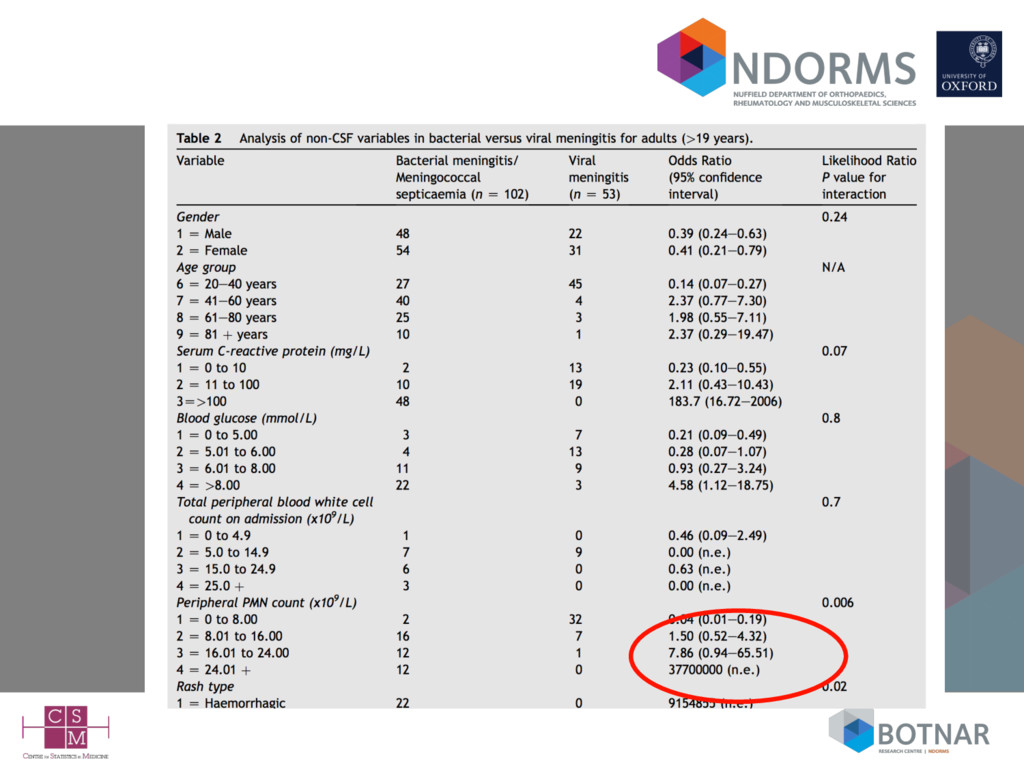
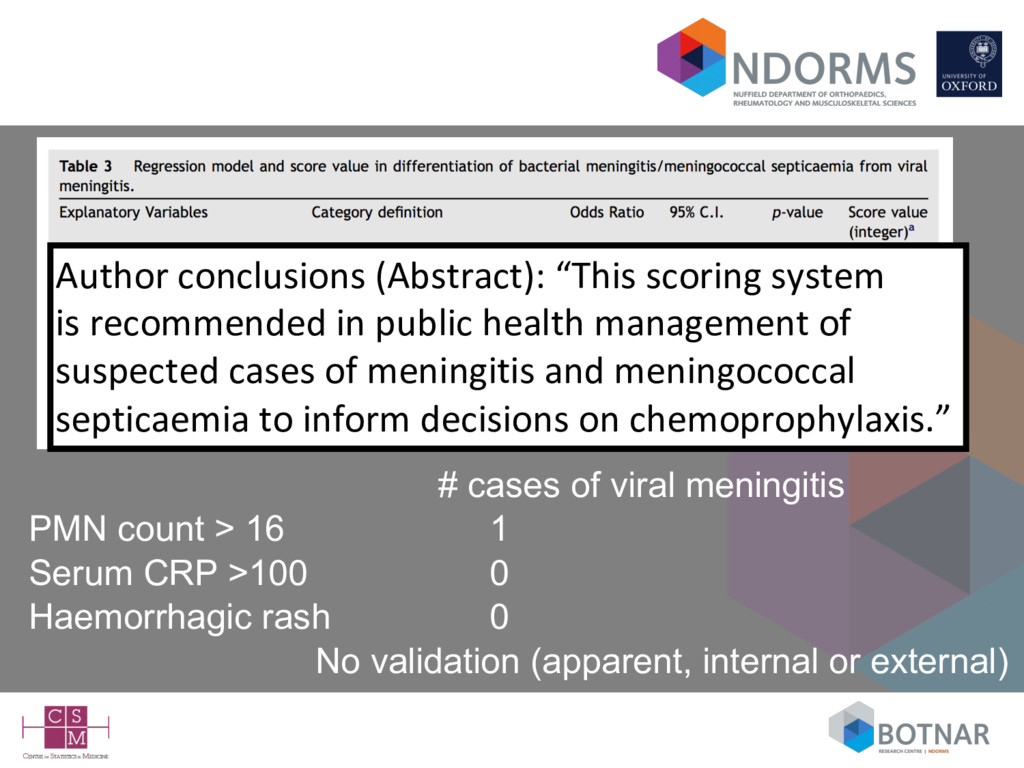
Serum CRP >100 0 Haemorrhagic rash 0 No validation (apparent, internal or external) Author conclusions (Abstract): “This scoring system is recommended in public health management of suspected cases of meningitis and meningococcal septicaemia to inform decisions on chemoprophylaxis.”
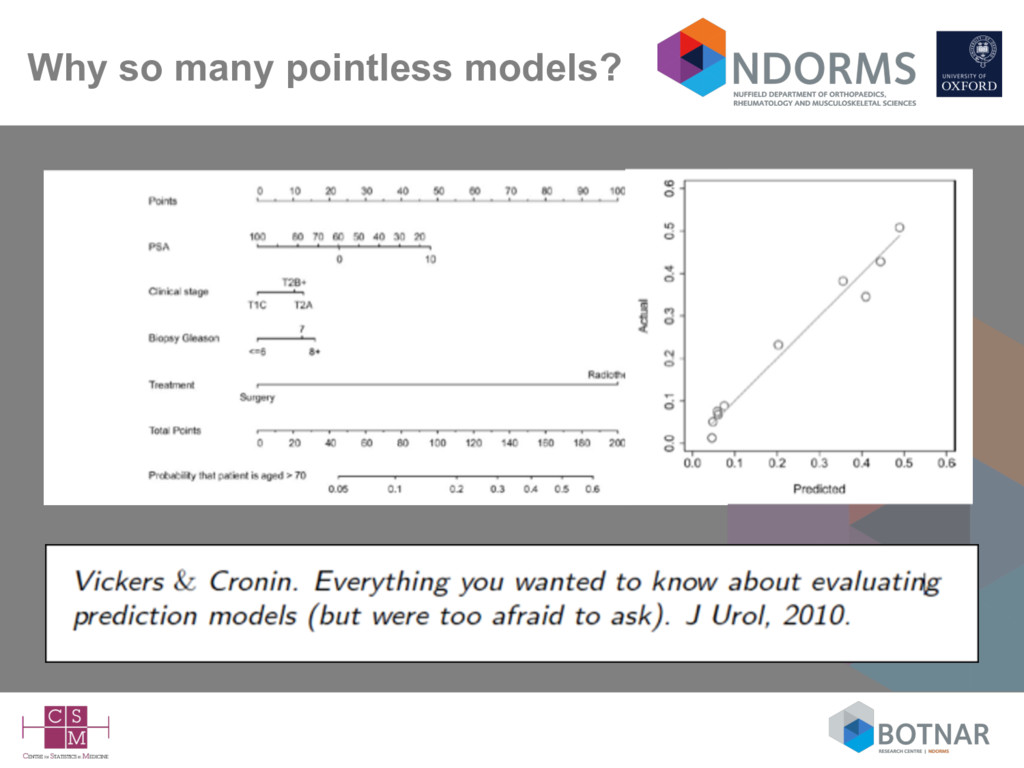
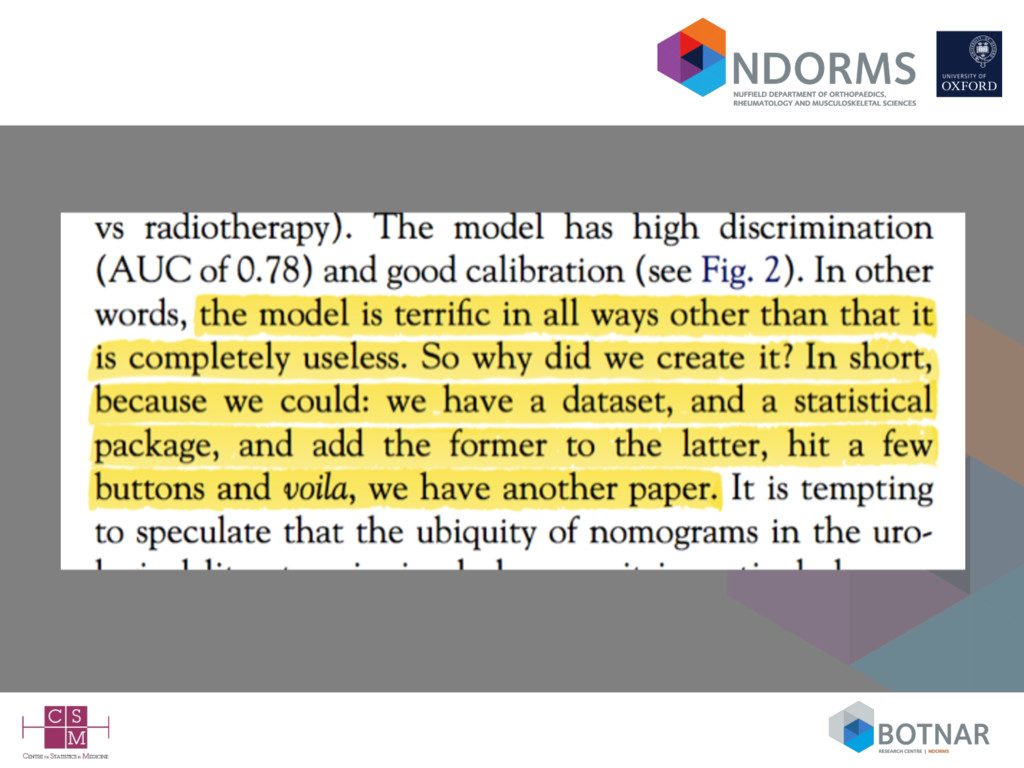
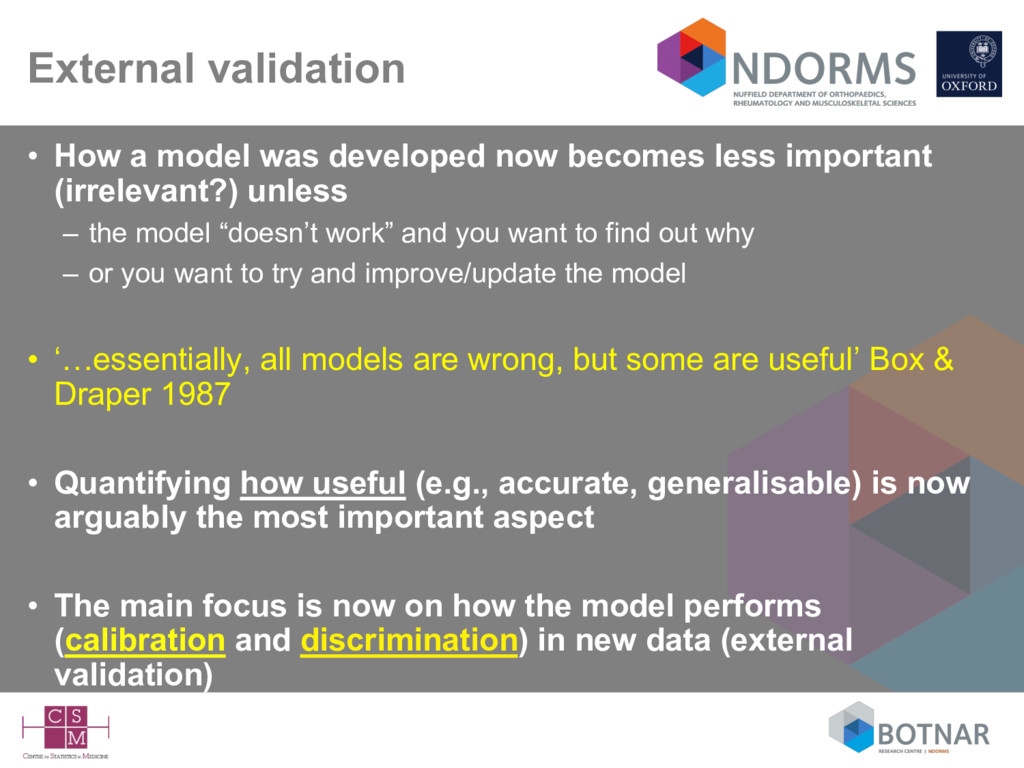
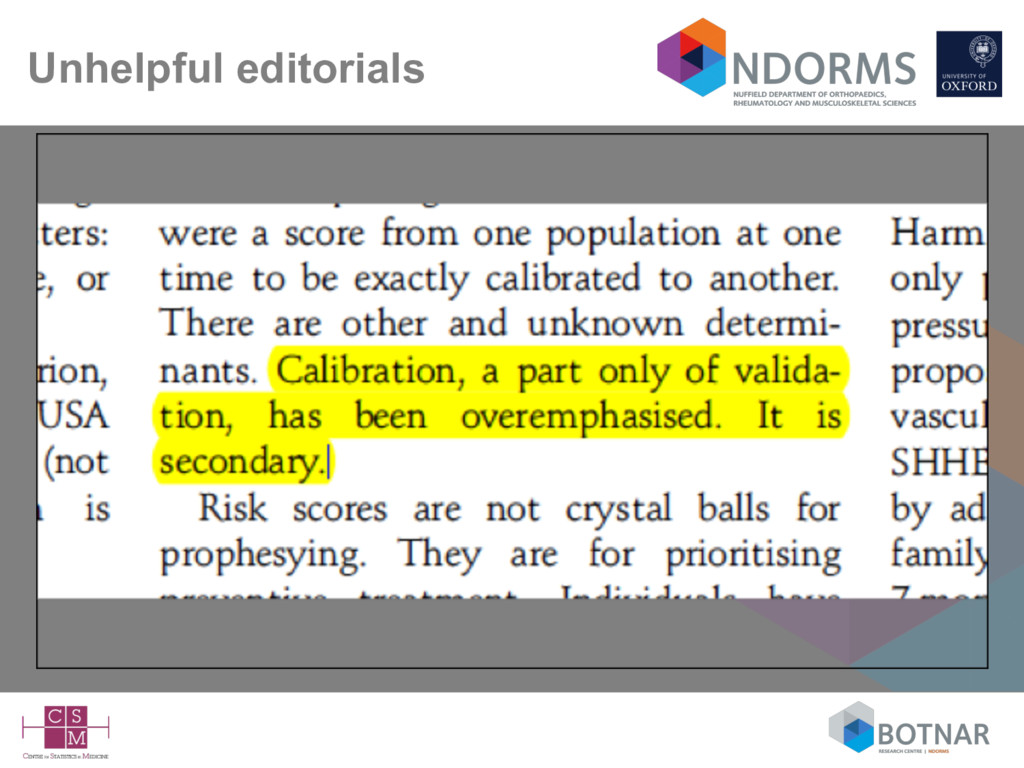
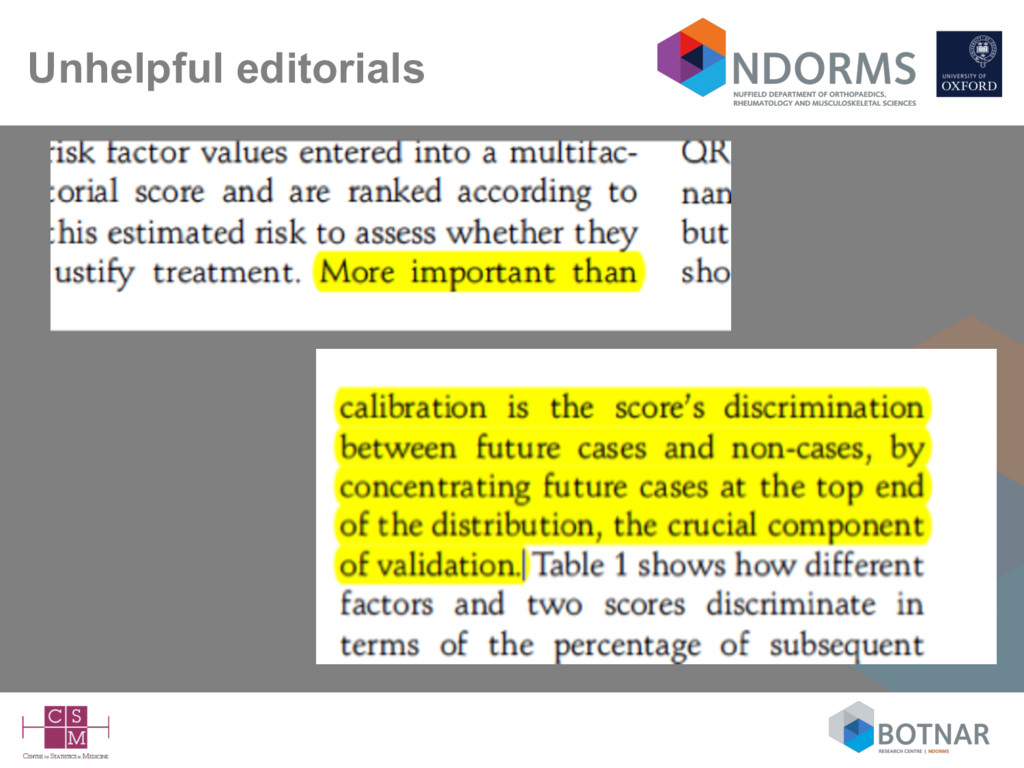
less important (irrelevant?) unless – the model “doesn’t work” and you want to find out why – or you want to try and improve/update the model • ‘…essentially, all models are wrong, but some are useful’ Box & Draper 1987 • Quantifying how useful (e.g., accurate, generalisable) is now arguably the most important aspect • The main focus is now on how the model performs (calibration and discrimination) in new data (external validation)
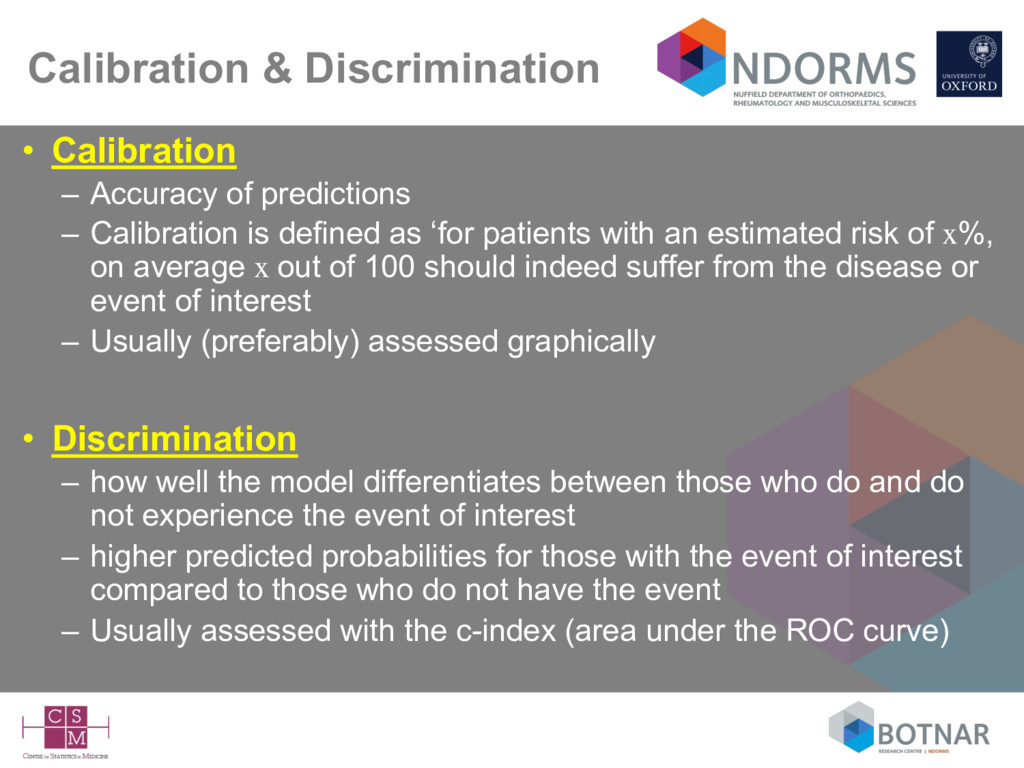
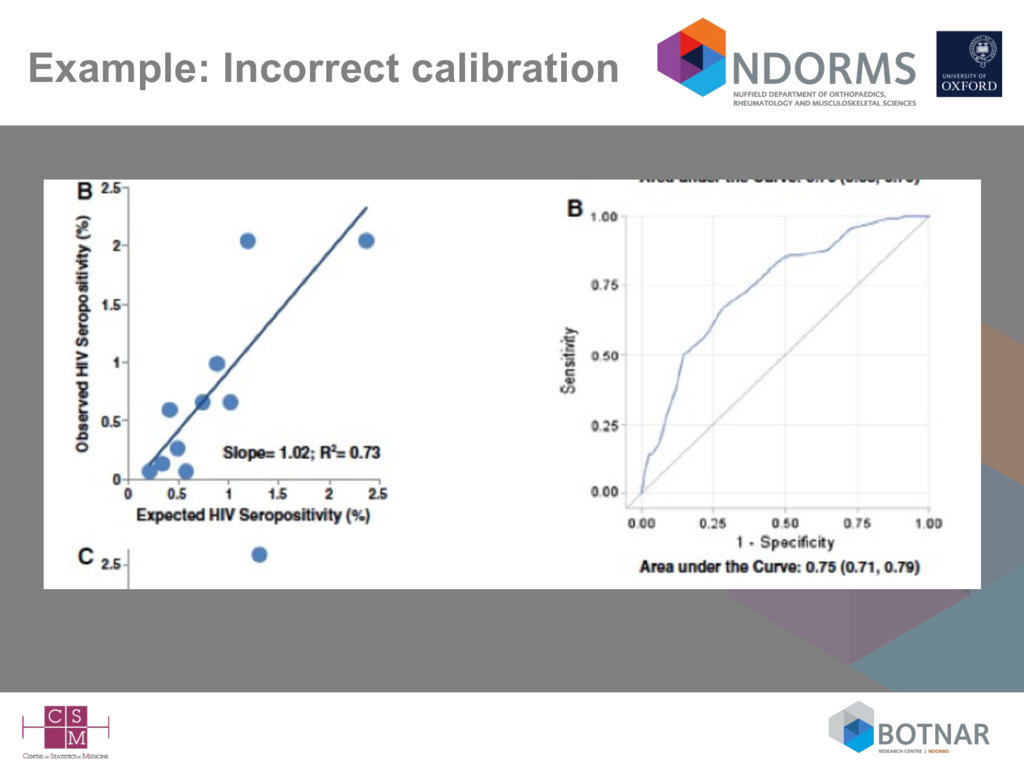
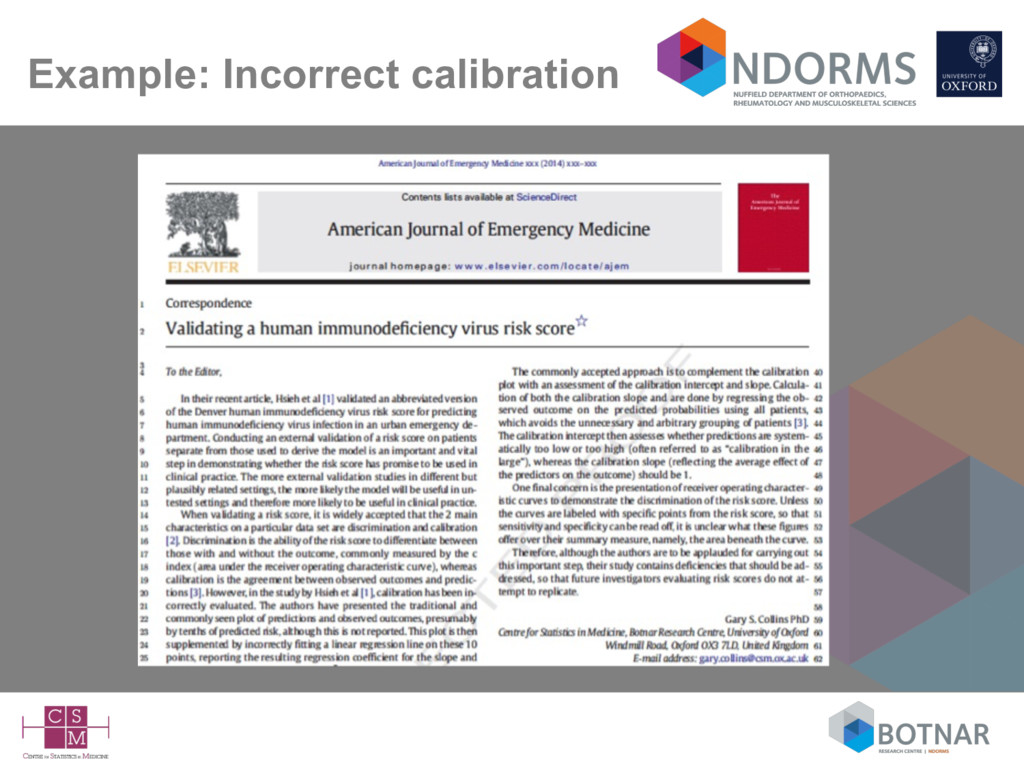
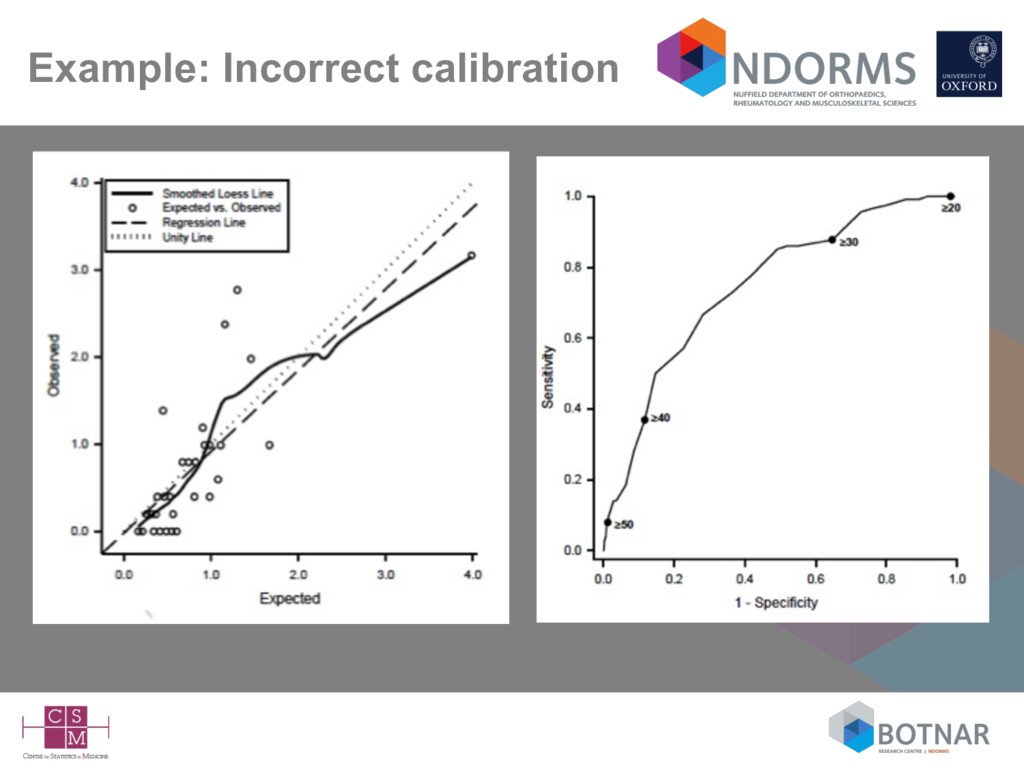
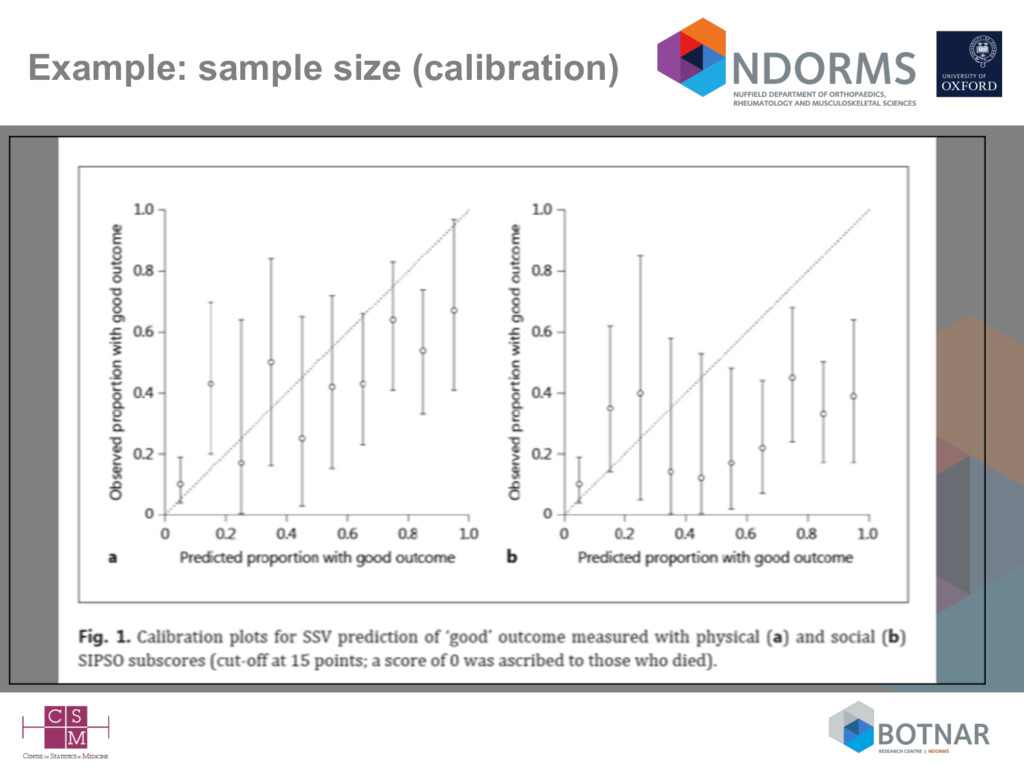
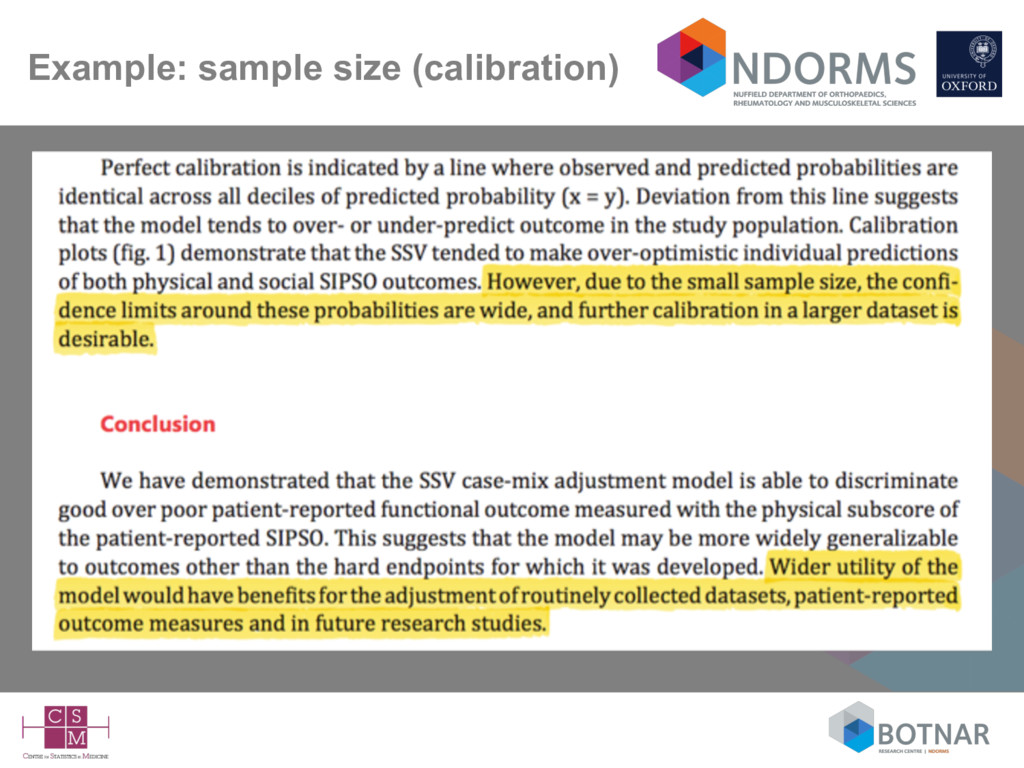
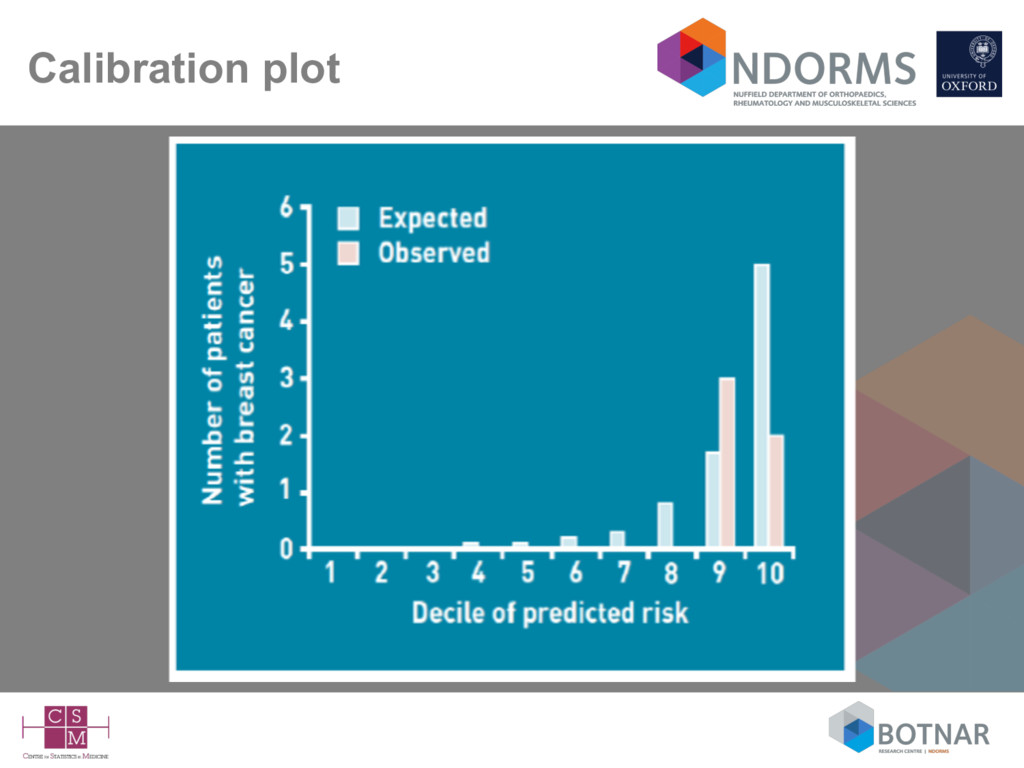
Calibration is defined as ‘for patients with an estimated risk of x%, on average x out of 100 should indeed suffer from the disease or event of interest – Usually (preferably) assessed graphically • Discrimination – how well the model differentiates between those who do and do not experience the event of interest – higher predicted probabilities for those with the event of interest compared to those who do not have the event – Usually assessed with the c-index (area under the ROC curve)
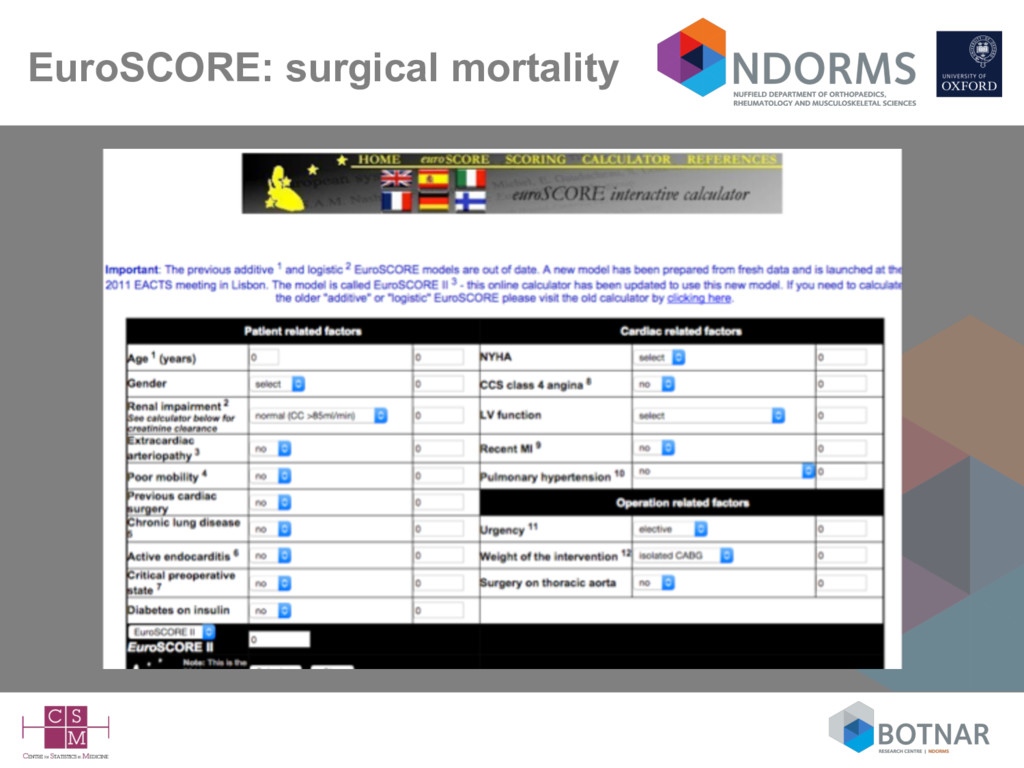
more likely the model will be generalisable to plausibly related (but untested) settings • Yet, very few published external validation studies – notable exceptions (Framingham, SAPS, APACHE, EuroSCORE) • External validation studies (unsurprisingly) are also poorly conducted and poorly reported (Collins 2014; Siontis 2015)
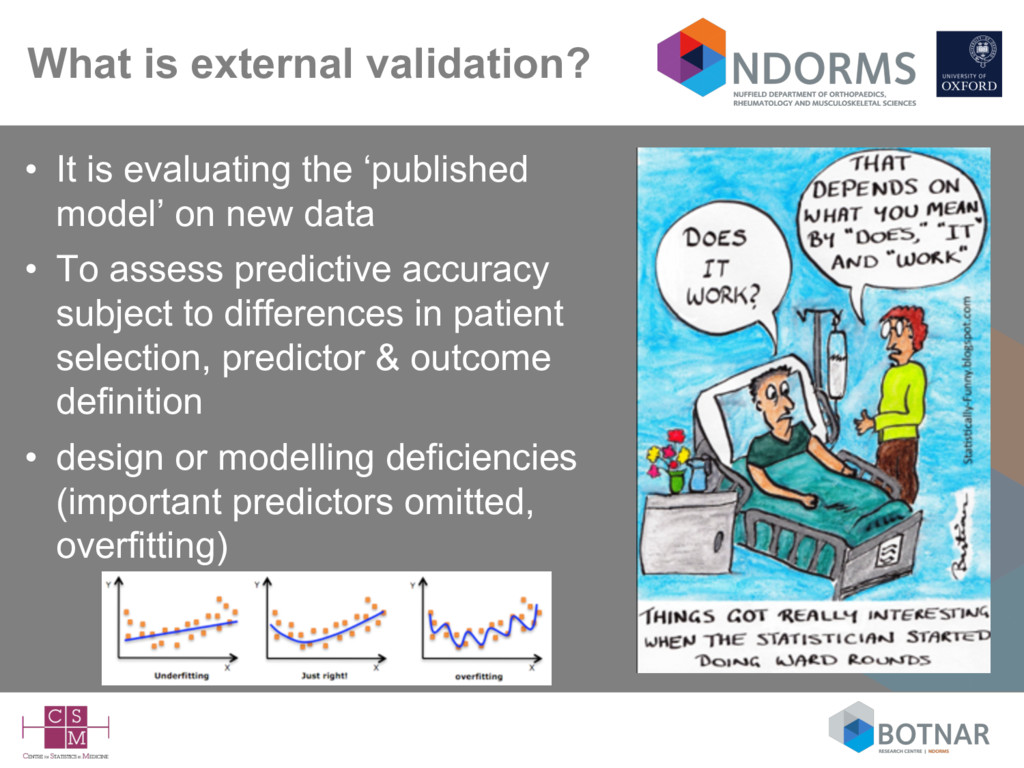
model’ on new data • To assess predictive accuracy subject to differences in patient selection, predictor & outcome definition • design or modelling deficiencies (important predictors omitted, overfitting)
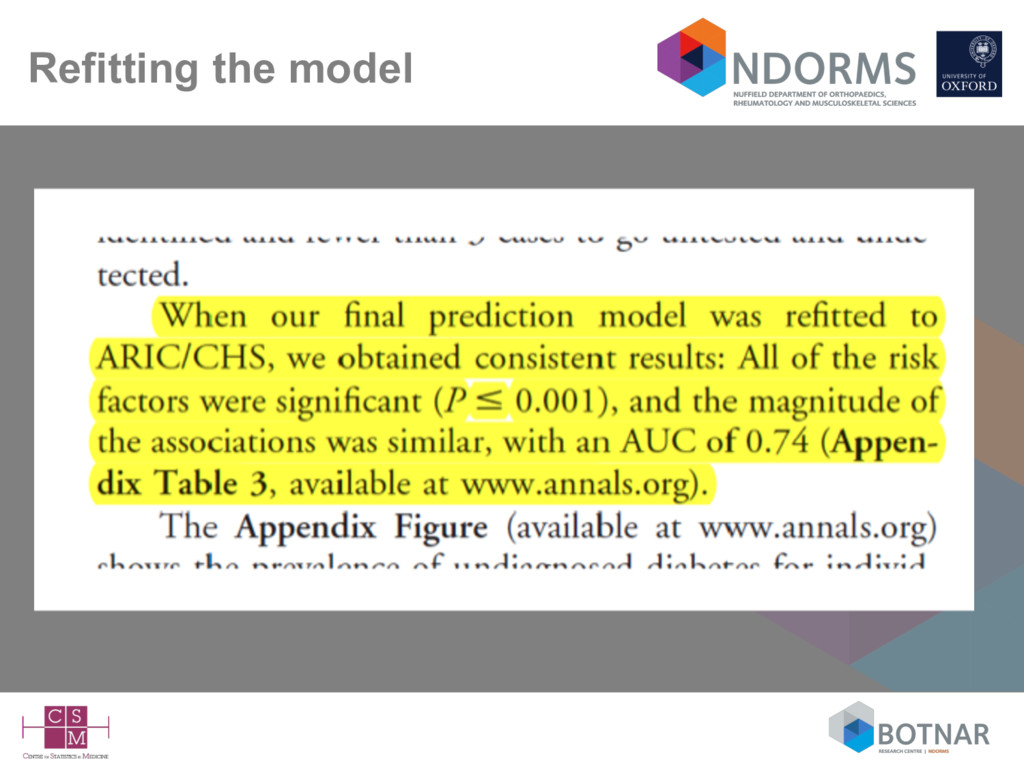
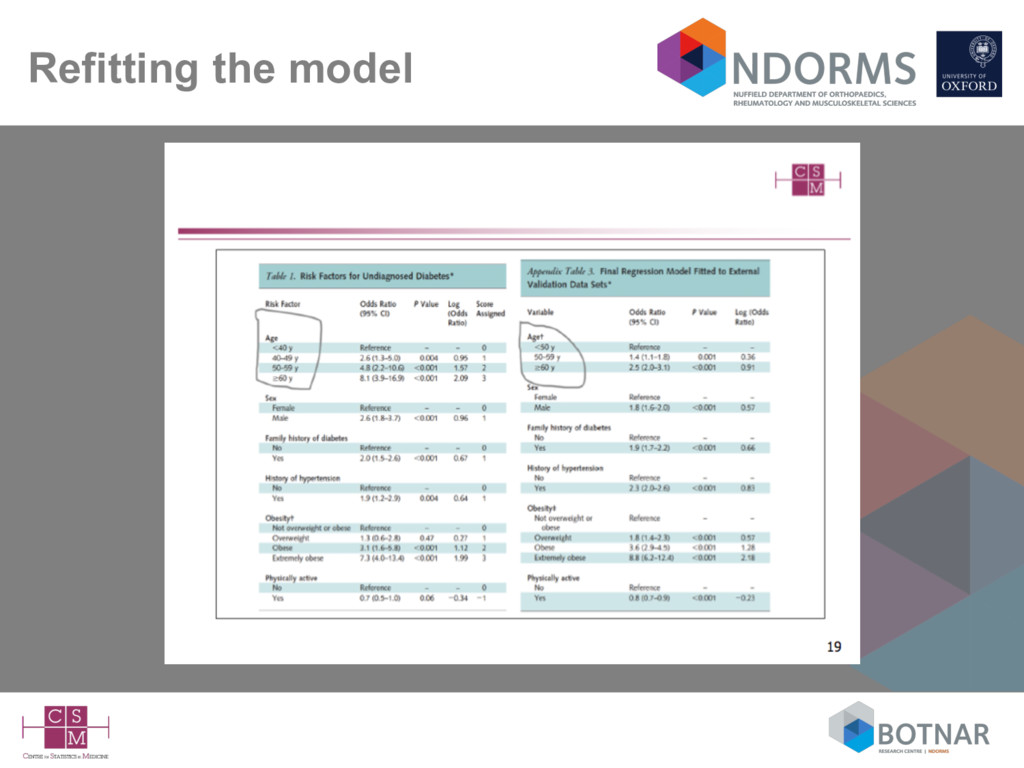
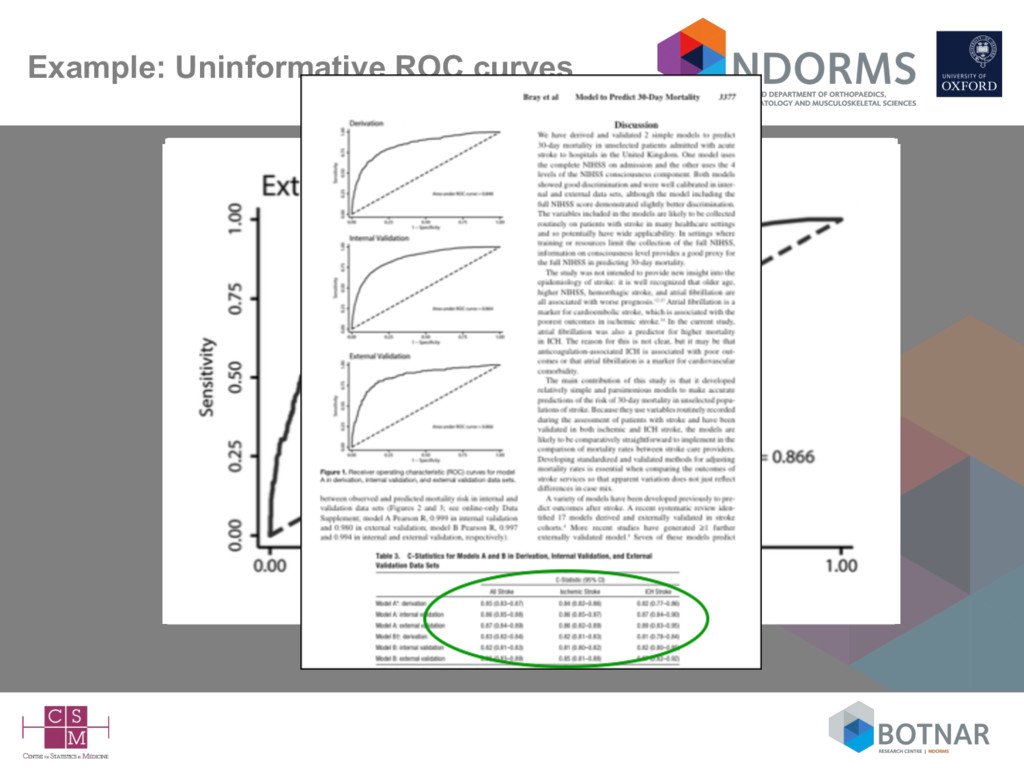
repeating all the steps from the development study in new data – refitting the model and evaluating this (new) re-fitted model – refitting the model in new data and comparing the results/regression coefficients to the original study • Overwhelming focus on reporting discrimination – 3/4 studies examine only discrimination – only 1/3 assessed calibration (not necessarily correctly) – 1/4 presented (uninformative) ‘blank’ ROC curves • Failure to interpret the results in the context of case-mix differences
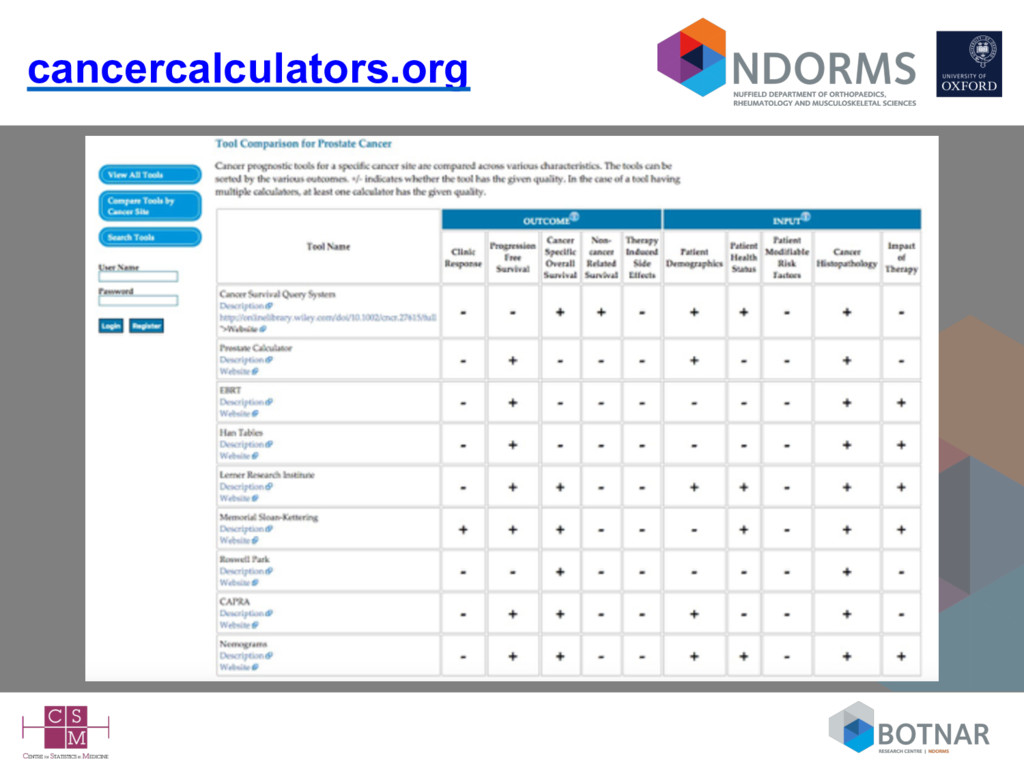
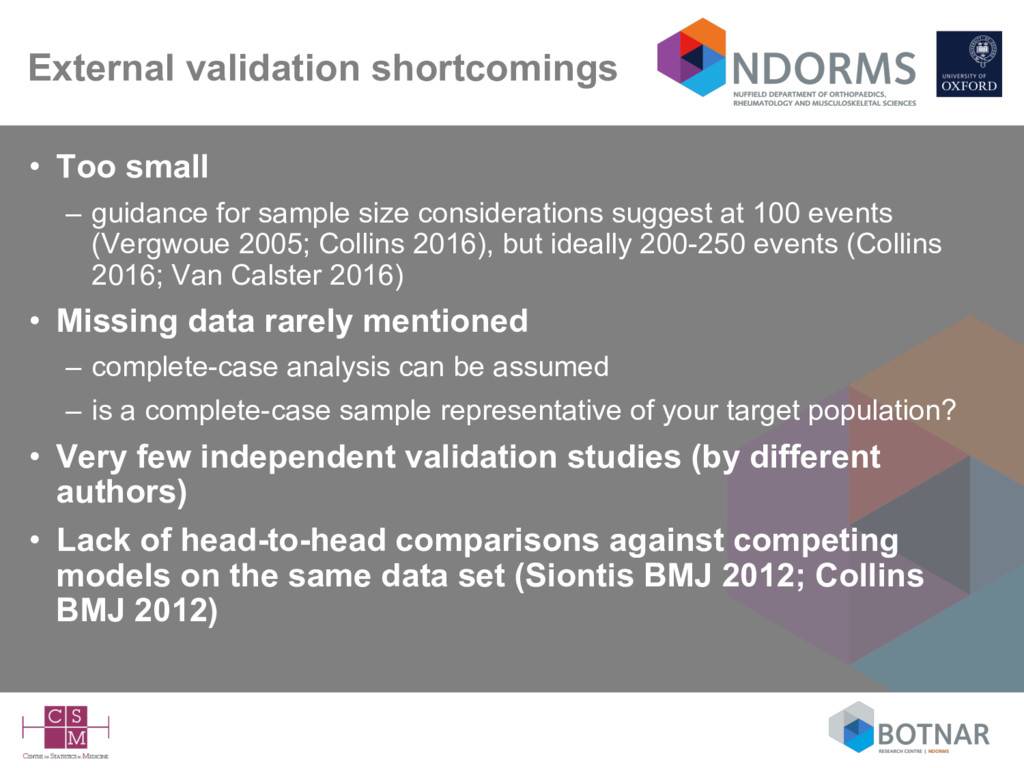
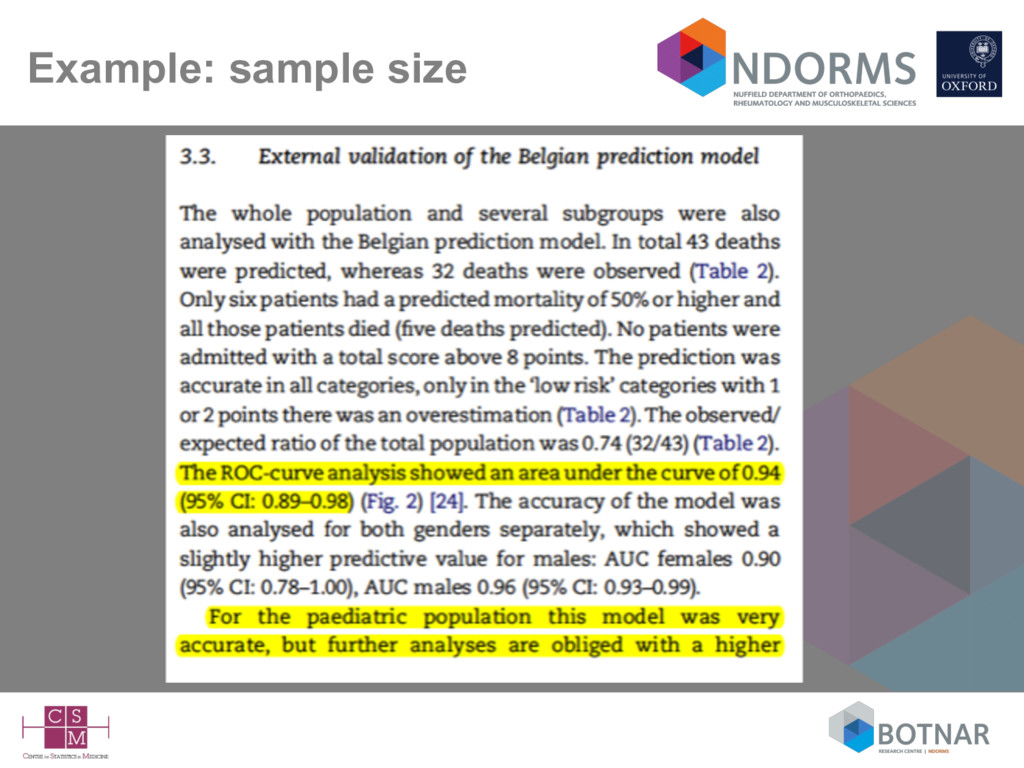
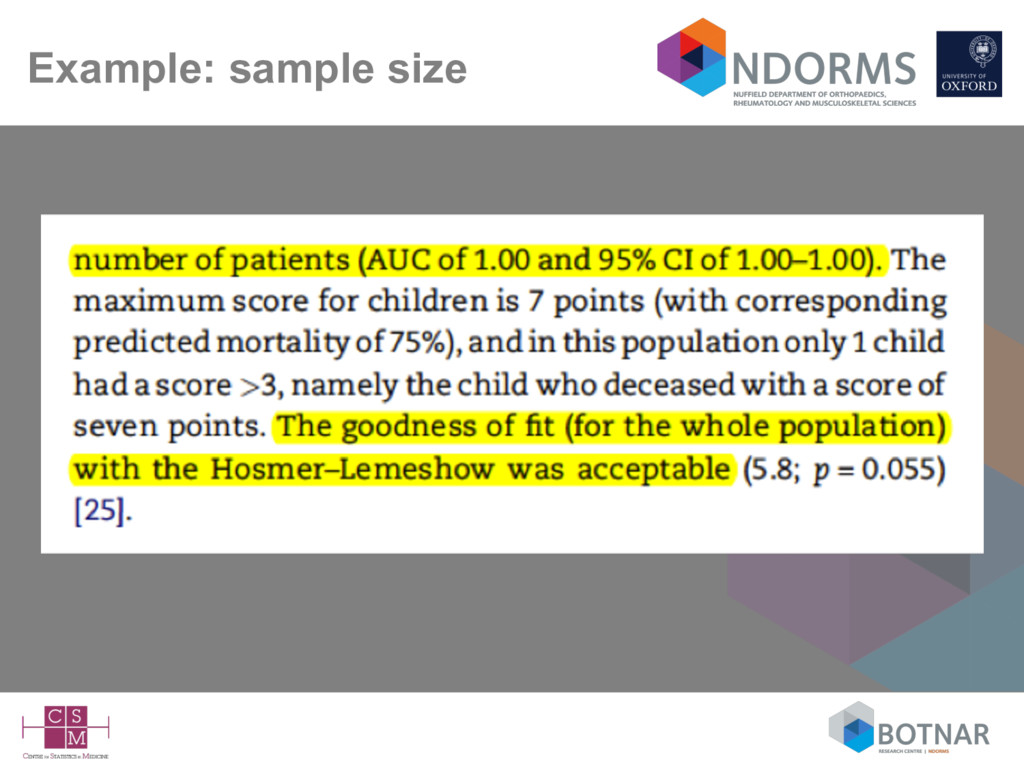
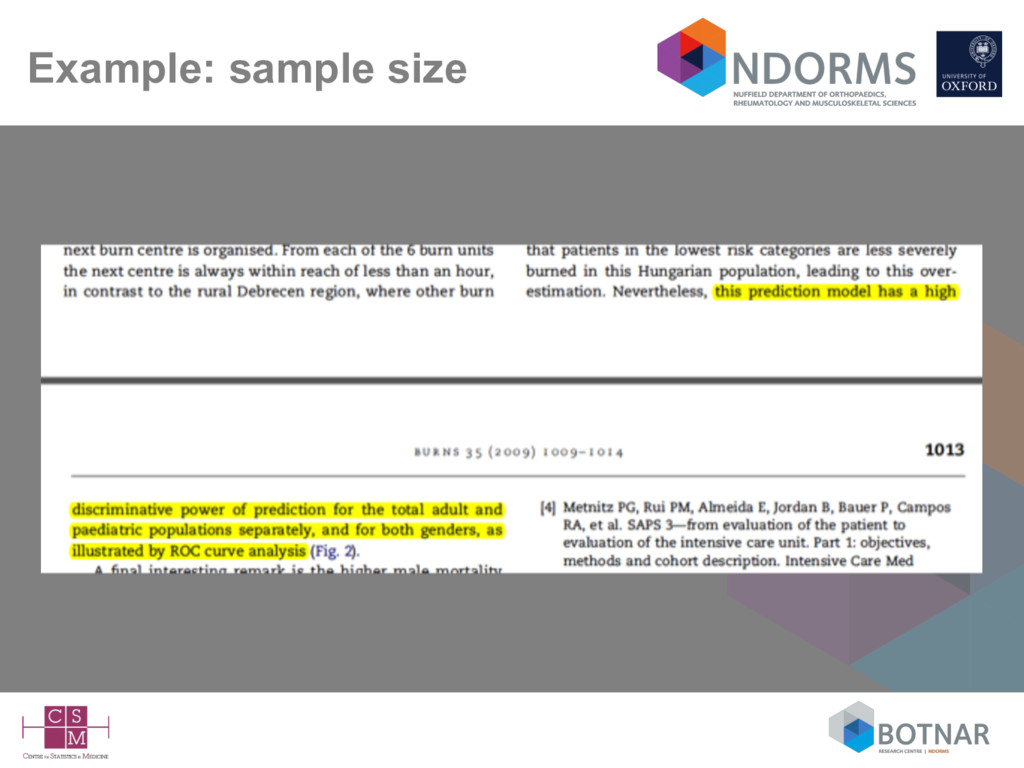
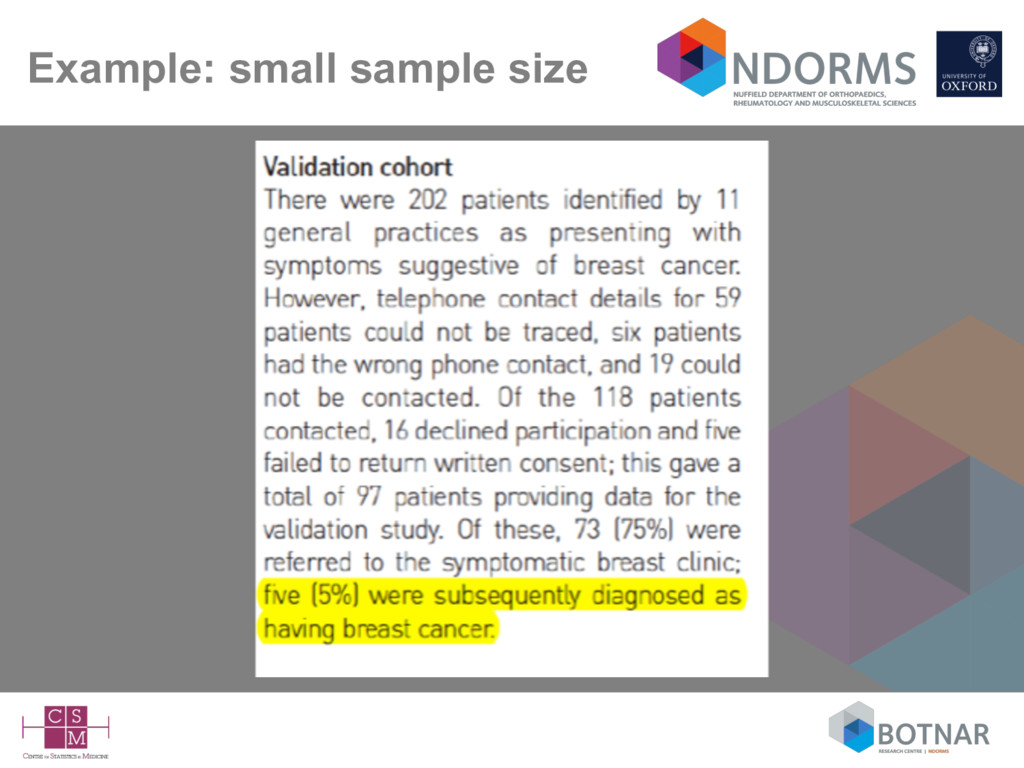
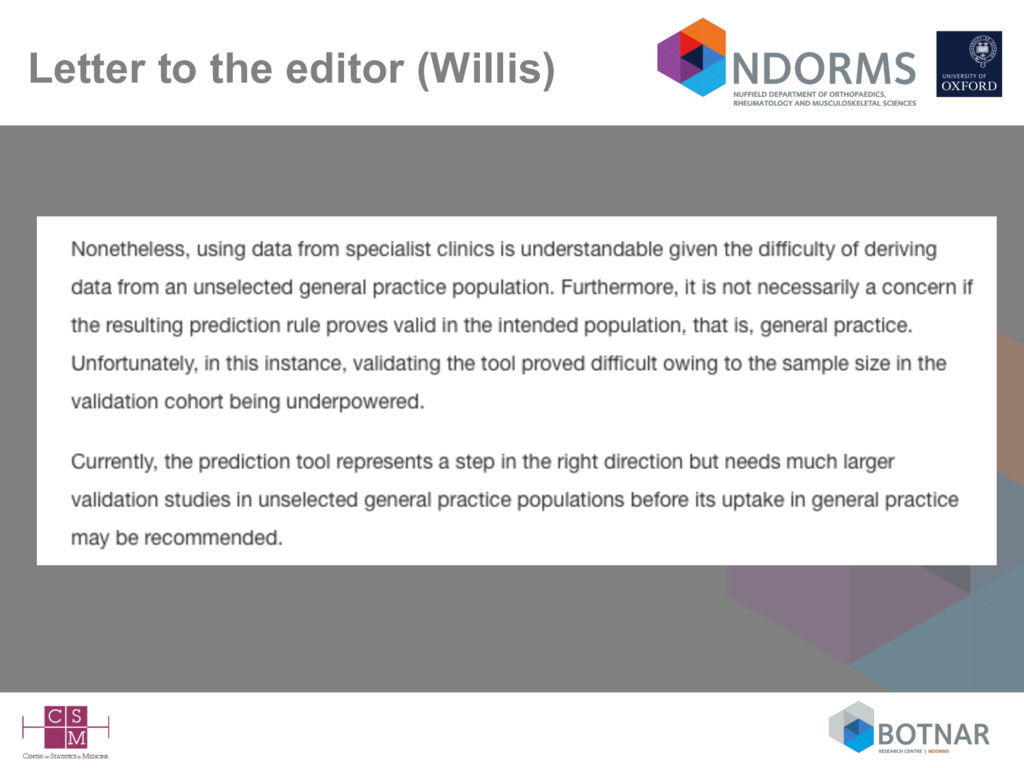
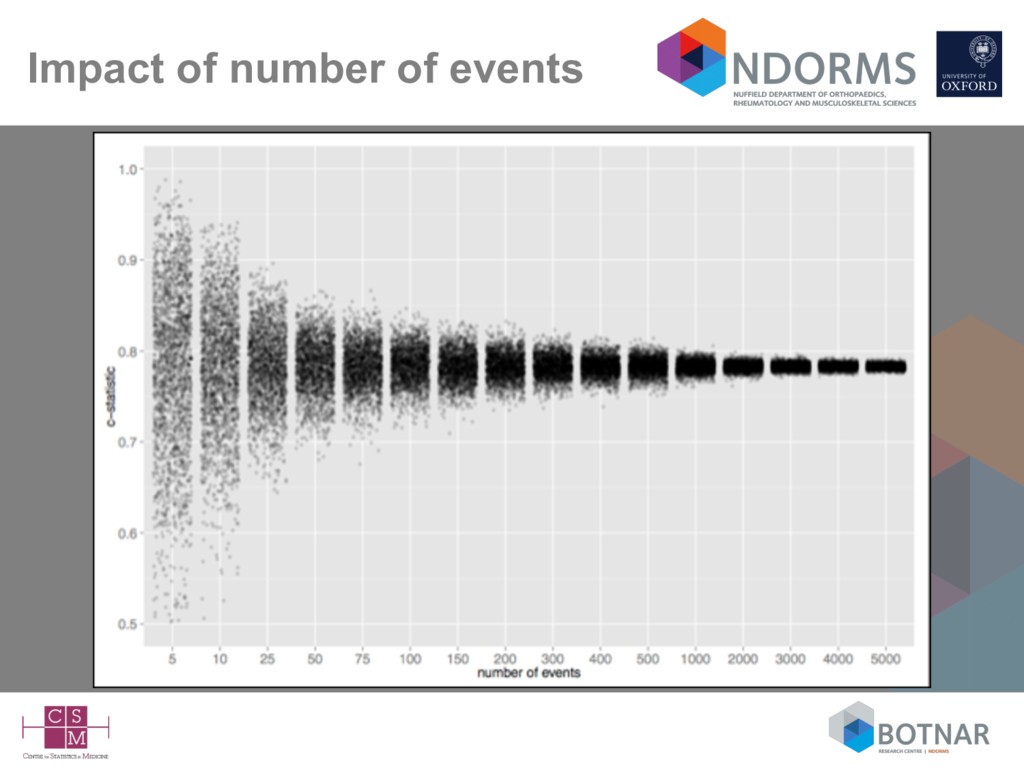
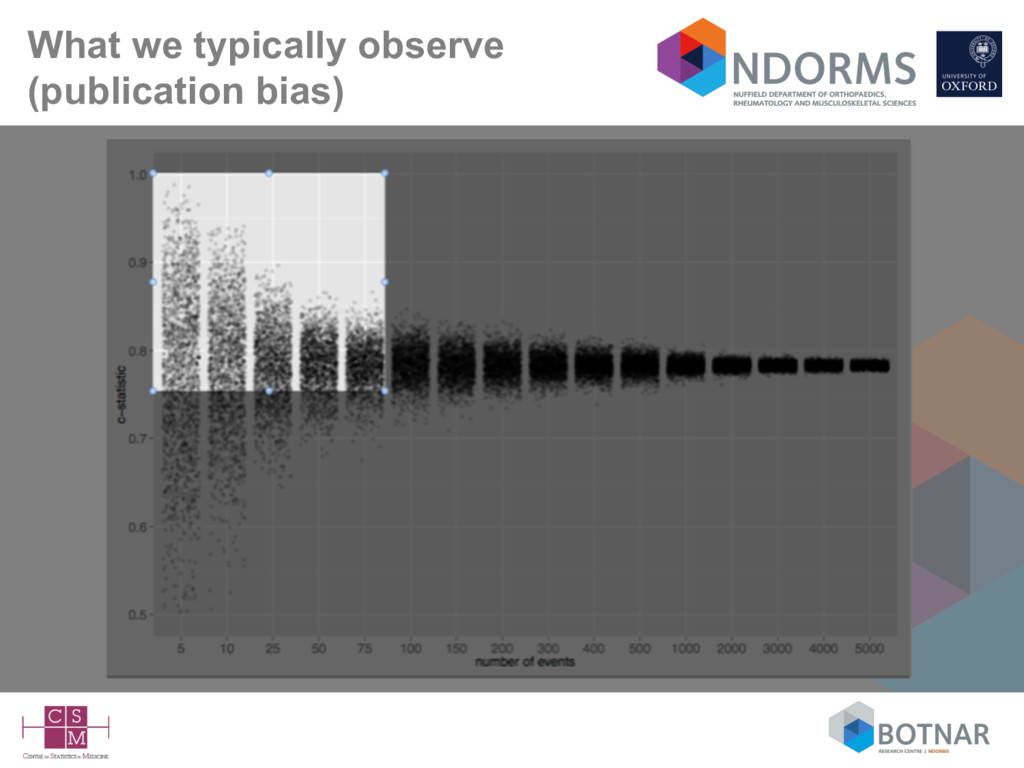
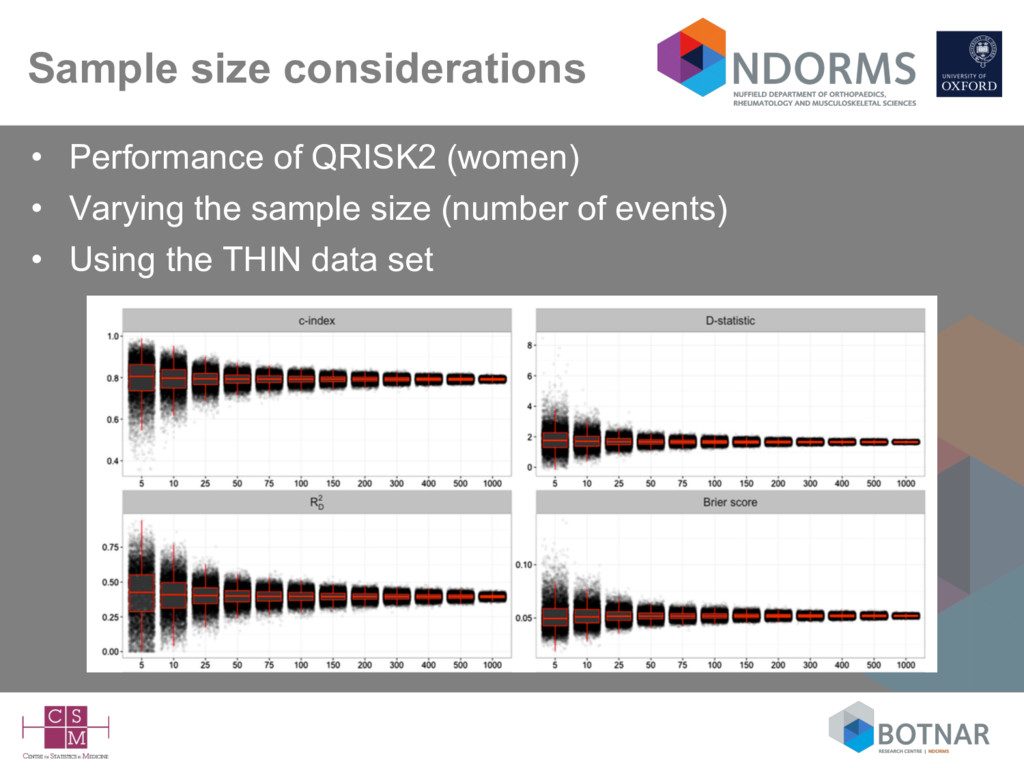
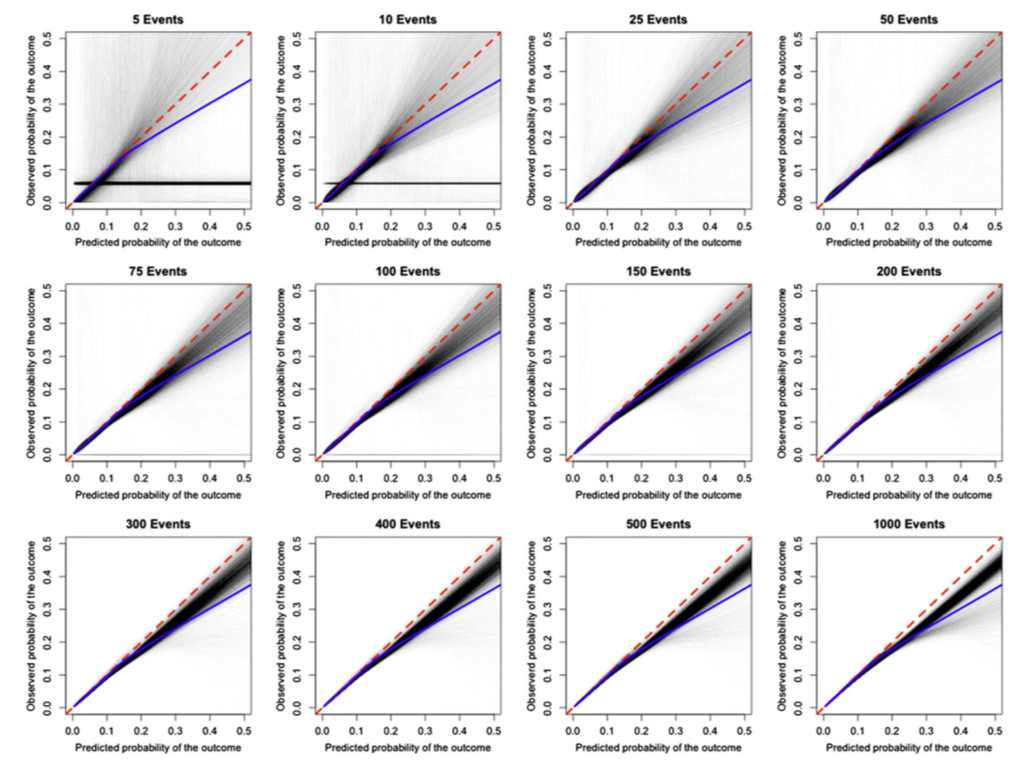
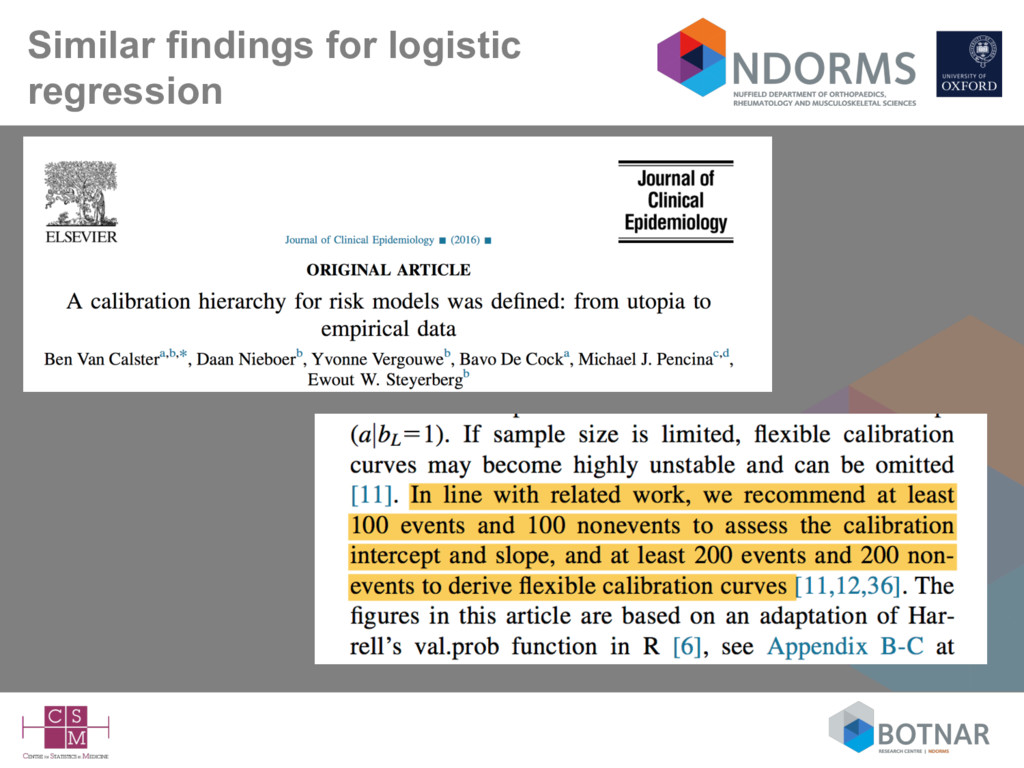
size considerations suggest at 100 events (Vergwoue 2005; Collins 2016), but ideally 200-250 events (Collins 2016; Van Calster 2016) • Missing data rarely mentioned – complete-case analysis can be assumed – is a complete-case sample representative of your target population? • Very few independent validation studies (by different authors) • Lack of head-to-head comparisons against competing models on the same data set (Siontis BMJ 2012; Collins BMJ 2012)
to be on • developing more models - easy to do - ‘discovery’ and easy to publish • this seems to be what journal appear to like? • evaluating whether newly discovered ‘biomarkers’ improve existing prediction models – they often don’t make much dramatic improvement
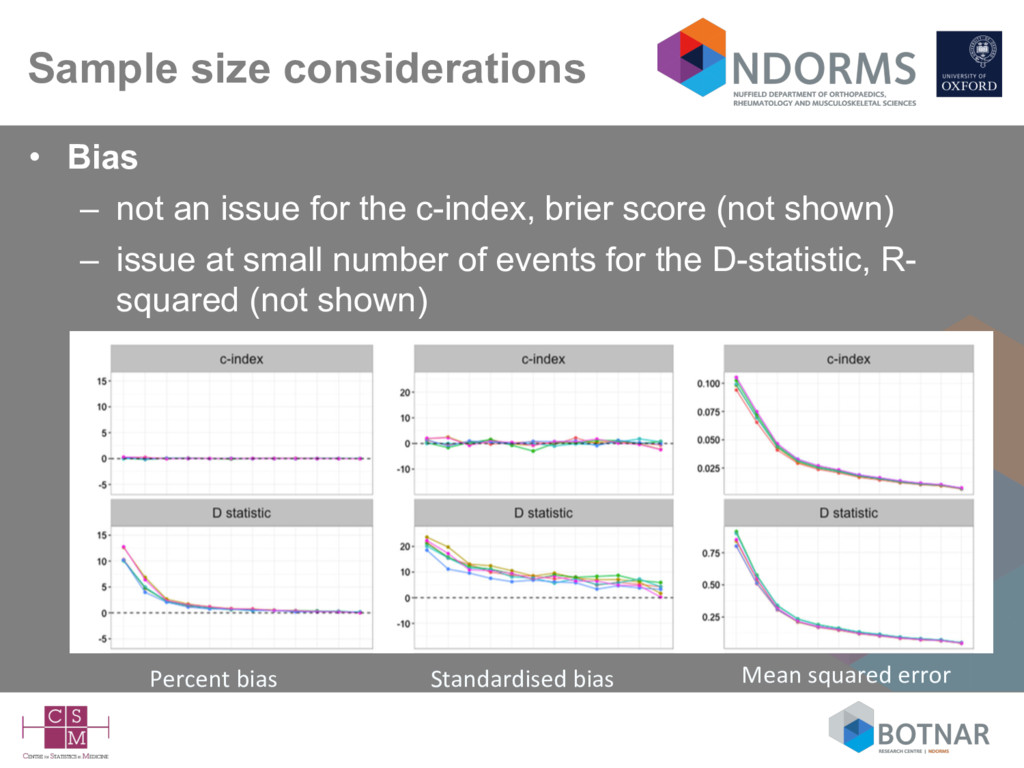
the c-index, brier score (not shown) – issue at small number of events for the D-statistic, R- squared (not shown) Percent bias Standardised bias Mean squared error
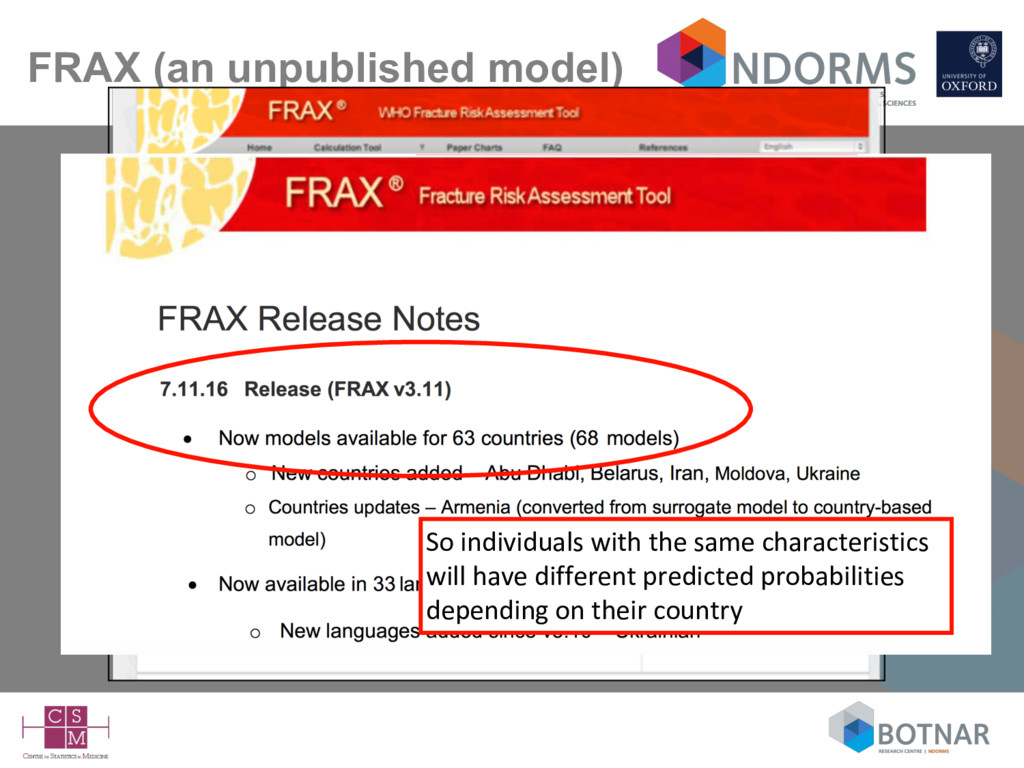
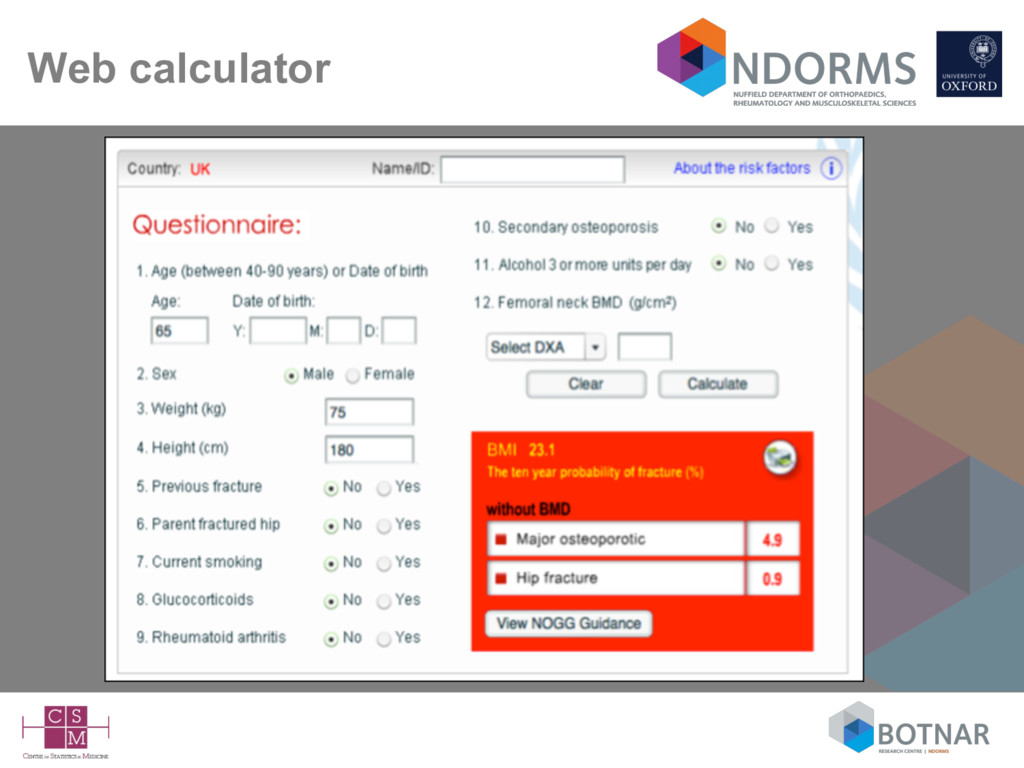
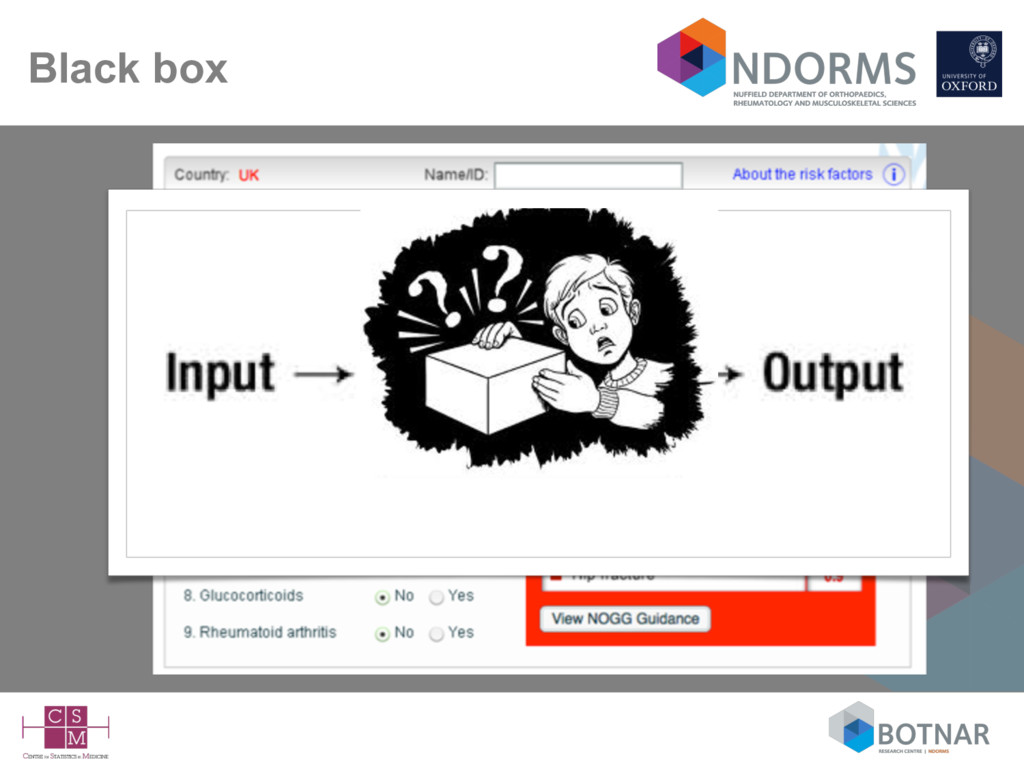
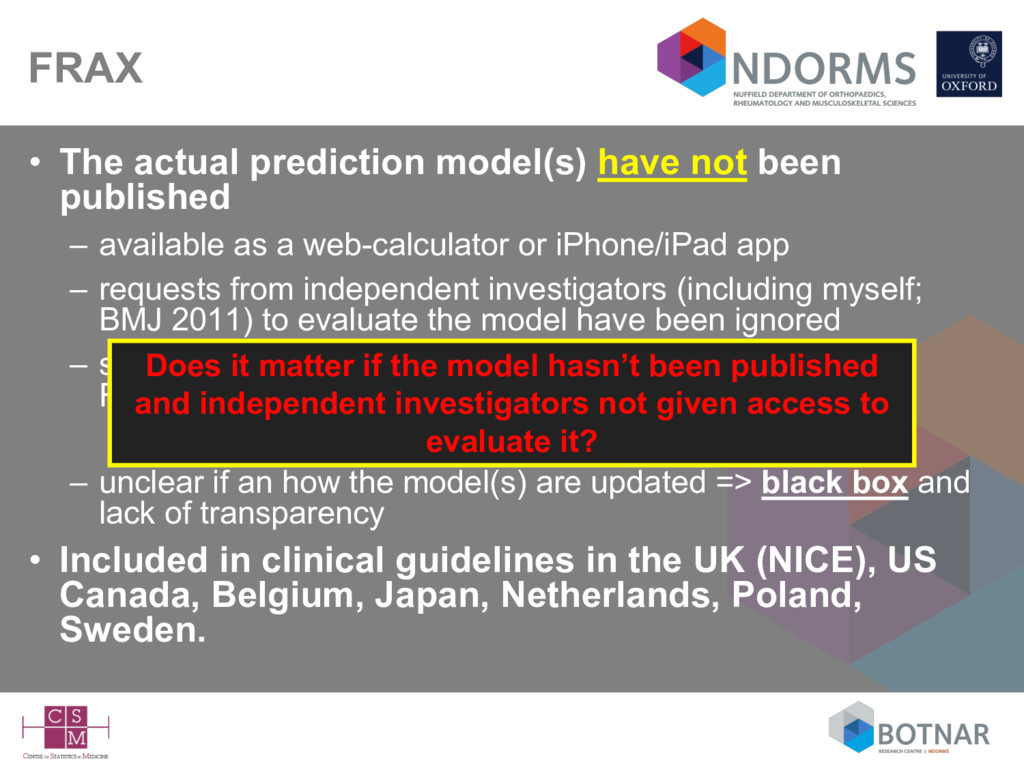
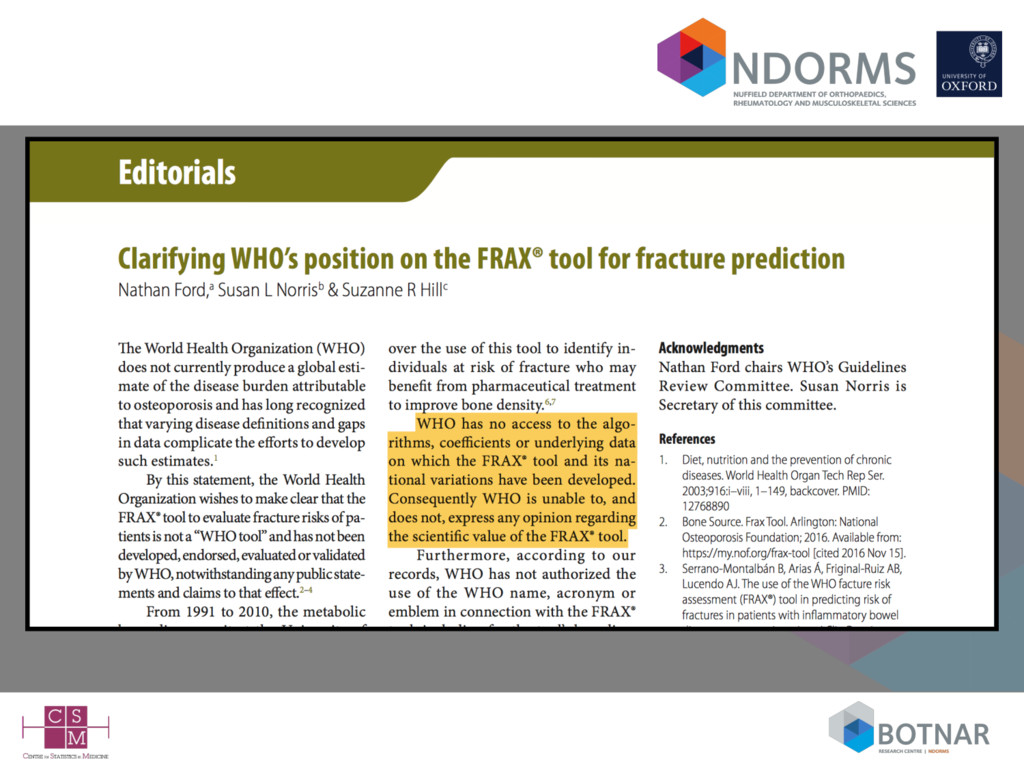
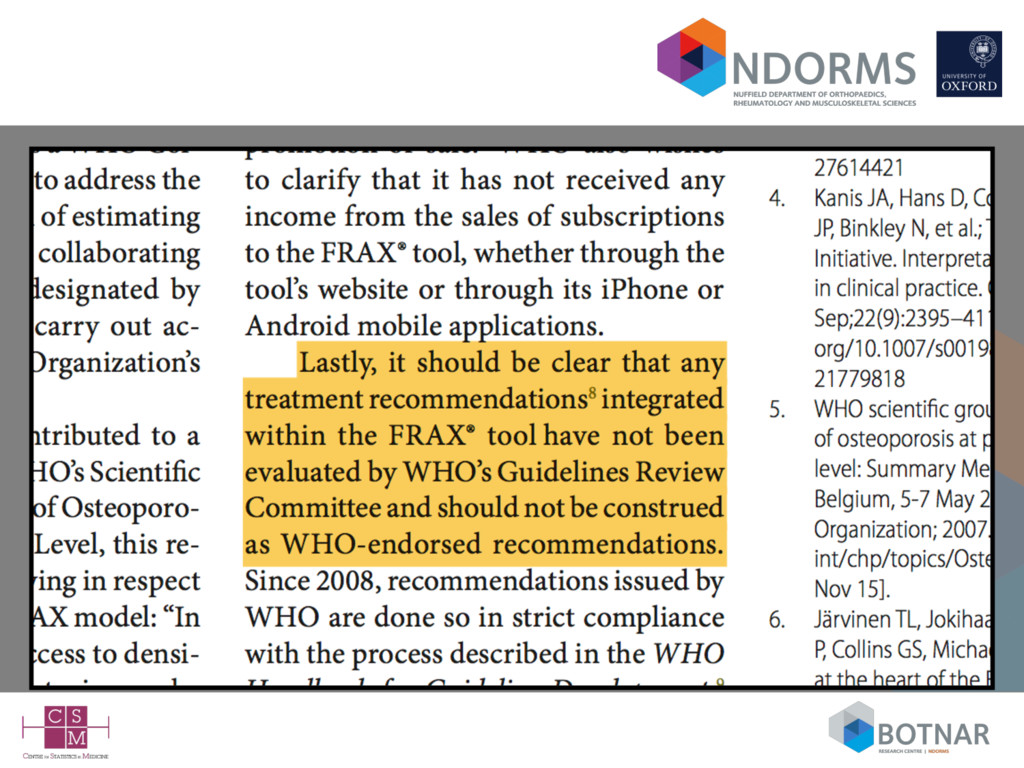
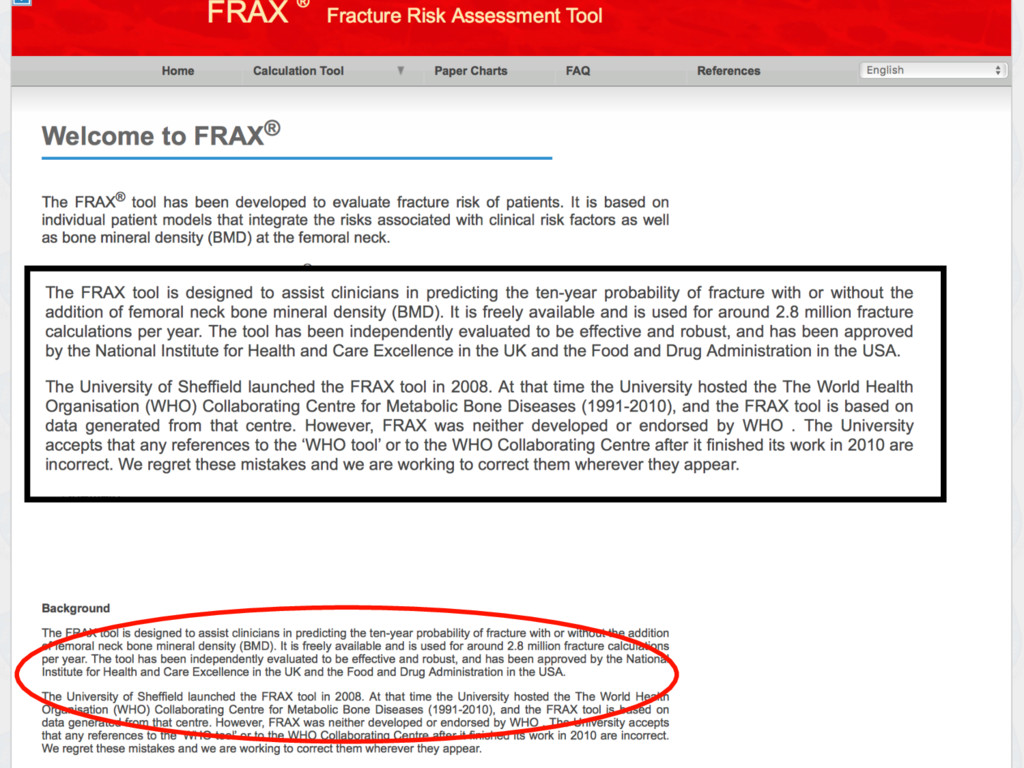
– available as a web-calculator or iPhone/iPad app – requests from independent investigators (including myself; BMJ 2011) to evaluate the model have been ignored – so-called validation have usually included authors of the FRAX model => lack of independence • exceptions include some very small low quality studies – unclear if an how the model(s) are updated => black box and lack of transparency • Included in clinical guidelines in the UK (NICE), US Canada, Belgium, Japan, Netherlands, Poland, Sweden. Does it matter if the model hasn’t been published and independent investigators not given access to evaluate it?
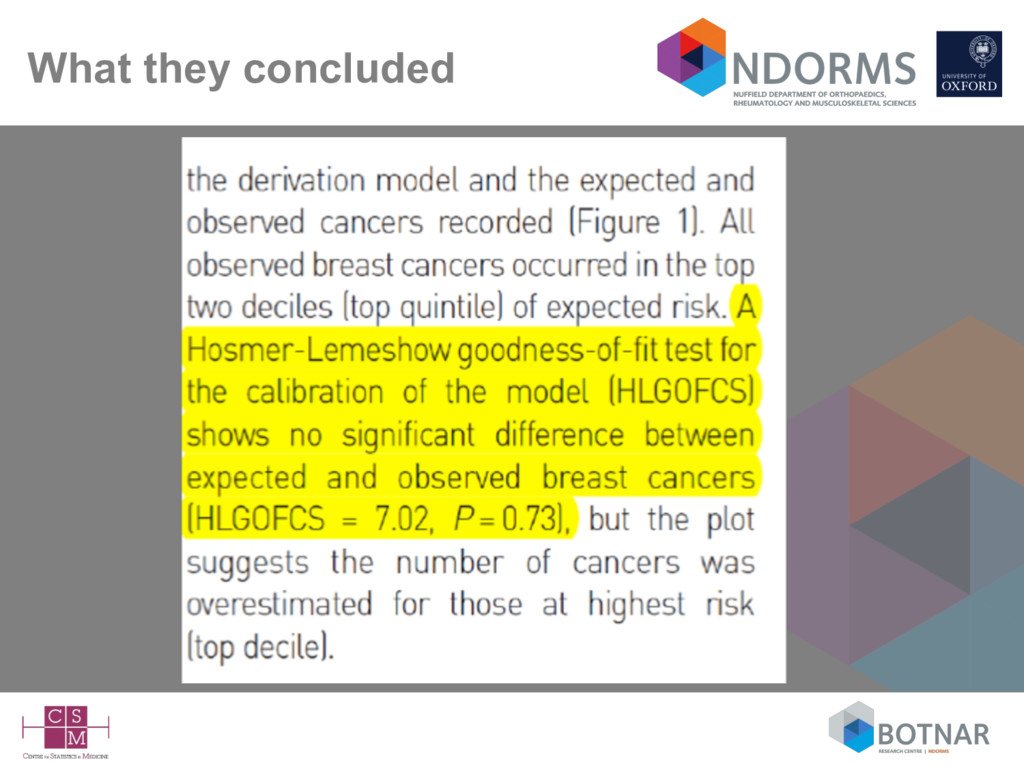
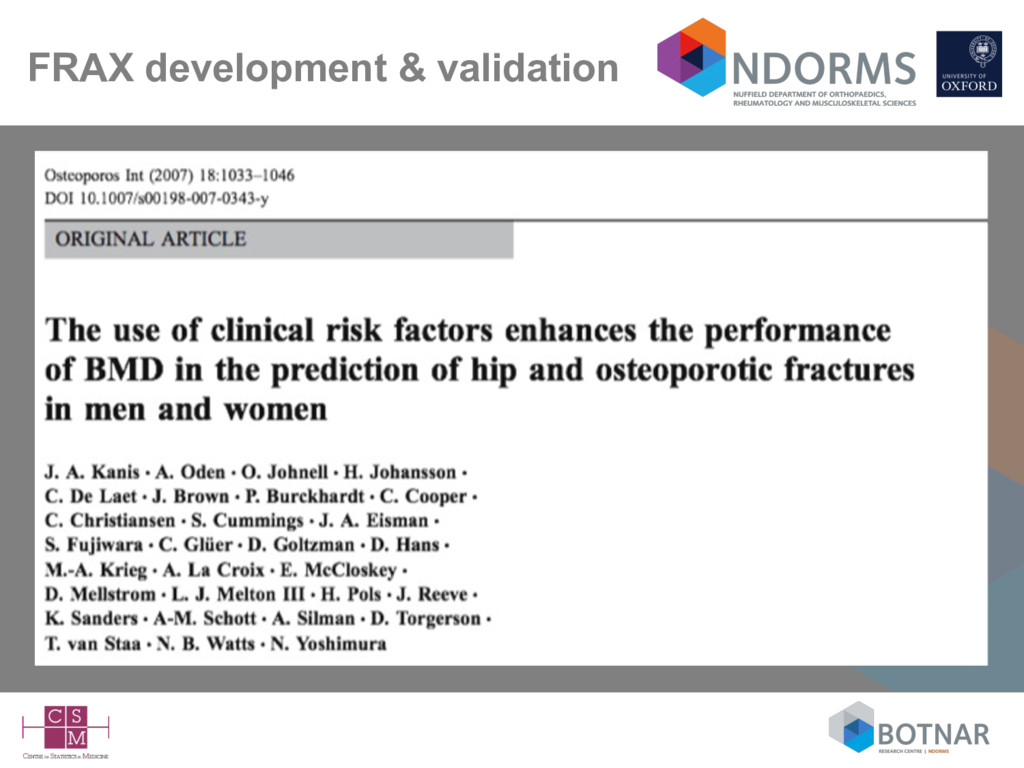
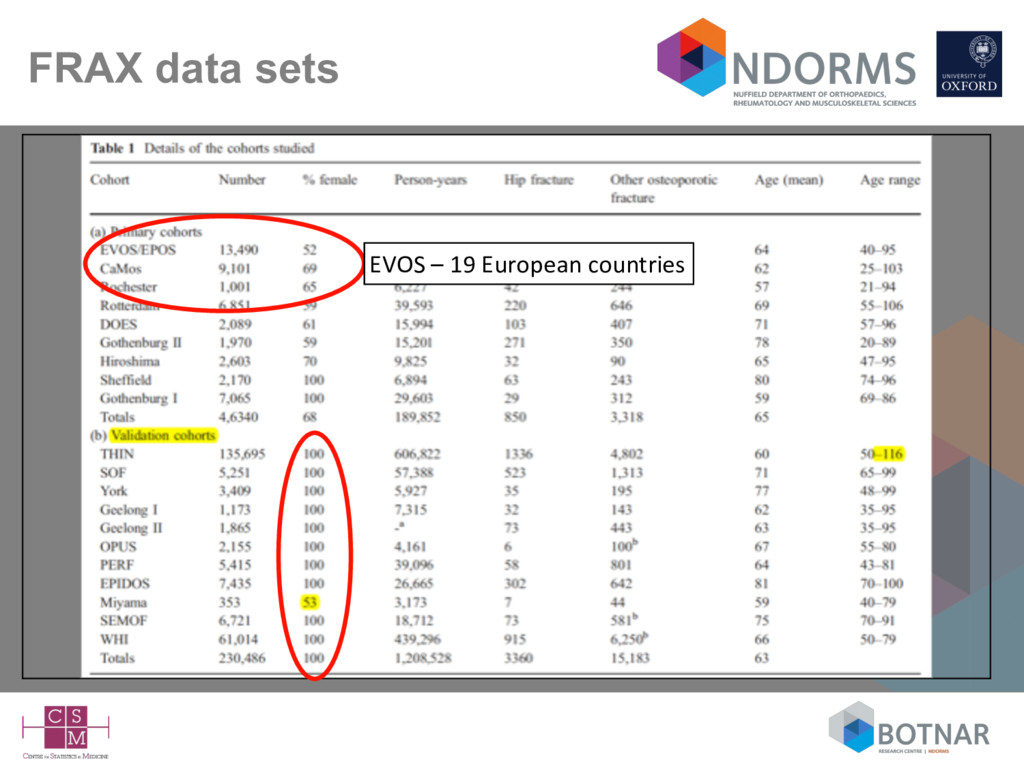
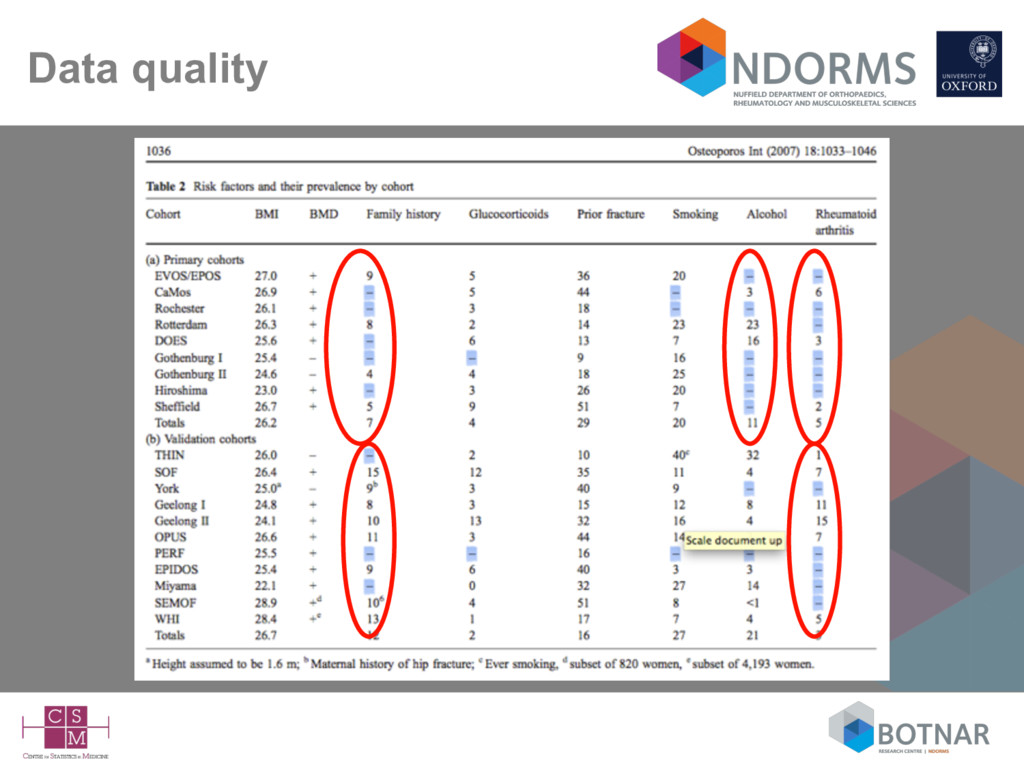
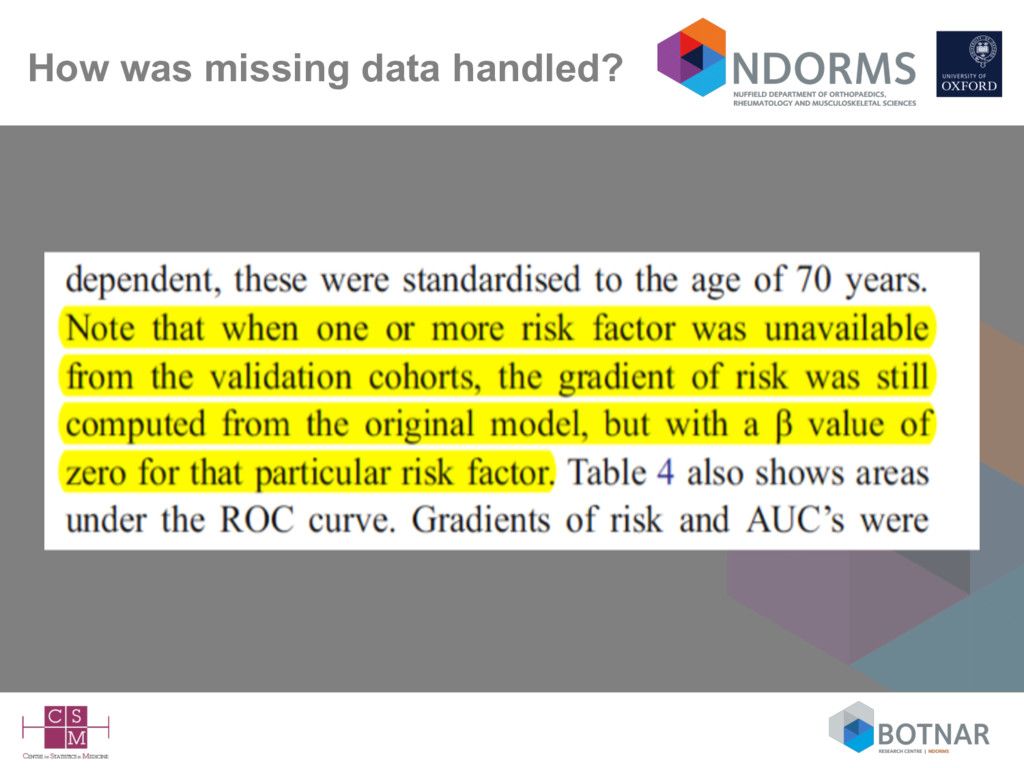
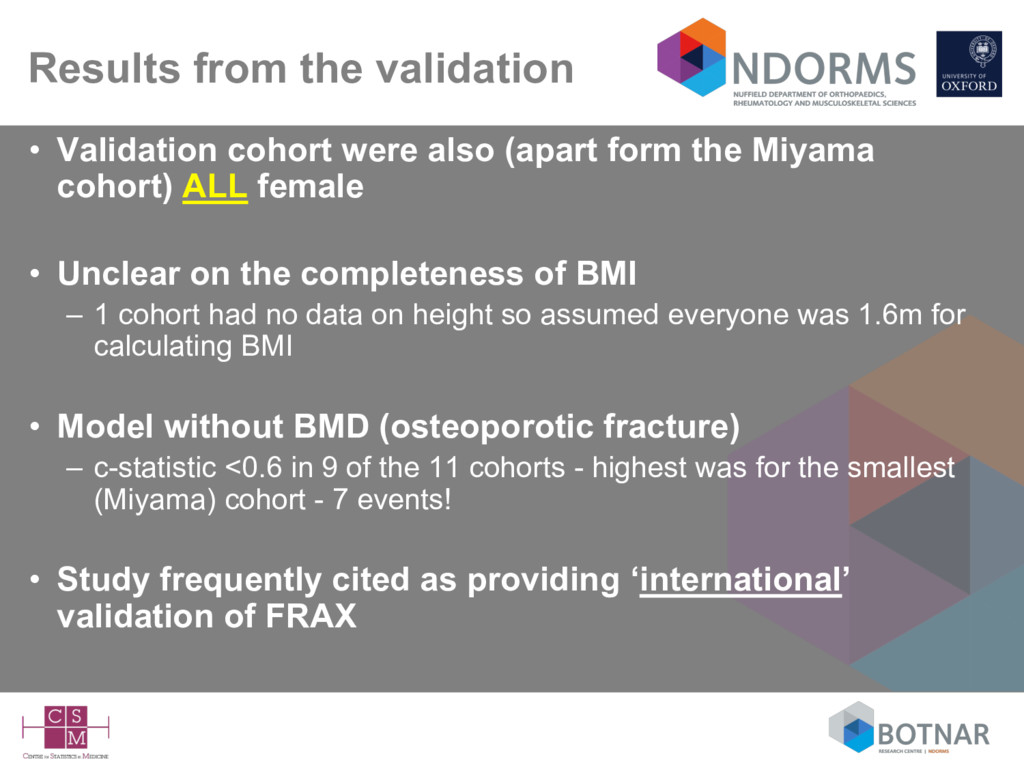
form the Miyama cohort) ALL female • Unclear on the completeness of BMI – 1 cohort had no data on height so assumed everyone was 1.6m for calculating BMI • Model without BMD (osteoporotic fracture) – c-statistic <0.6 in 9 of the 11 cohorts - highest was for the smallest (Miyama) cohort - 7 events! • Study frequently cited as providing ‘international’ validation of FRAX
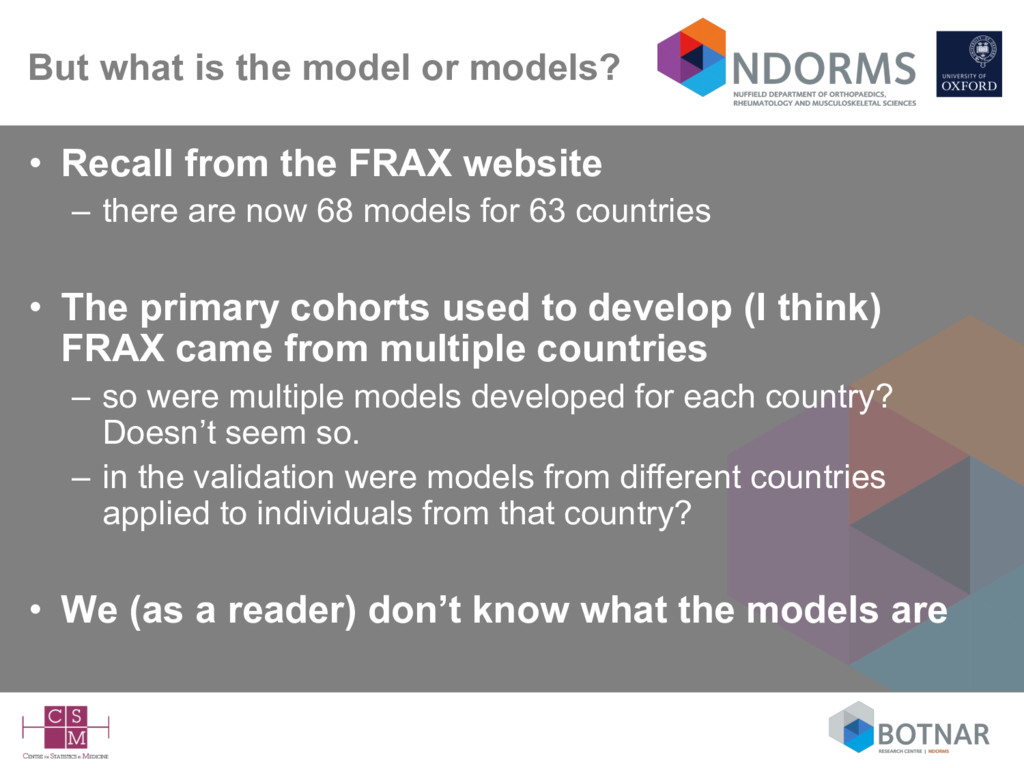
the FRAX website – there are now 68 models for 63 countries • The primary cohorts used to develop (I think) FRAX came from multiple countries – so were multiple models developed for each country? Doesn’t seem so. – in the validation were models from different countries applied to individuals from that country? • We (as a reader) don’t know what the models are
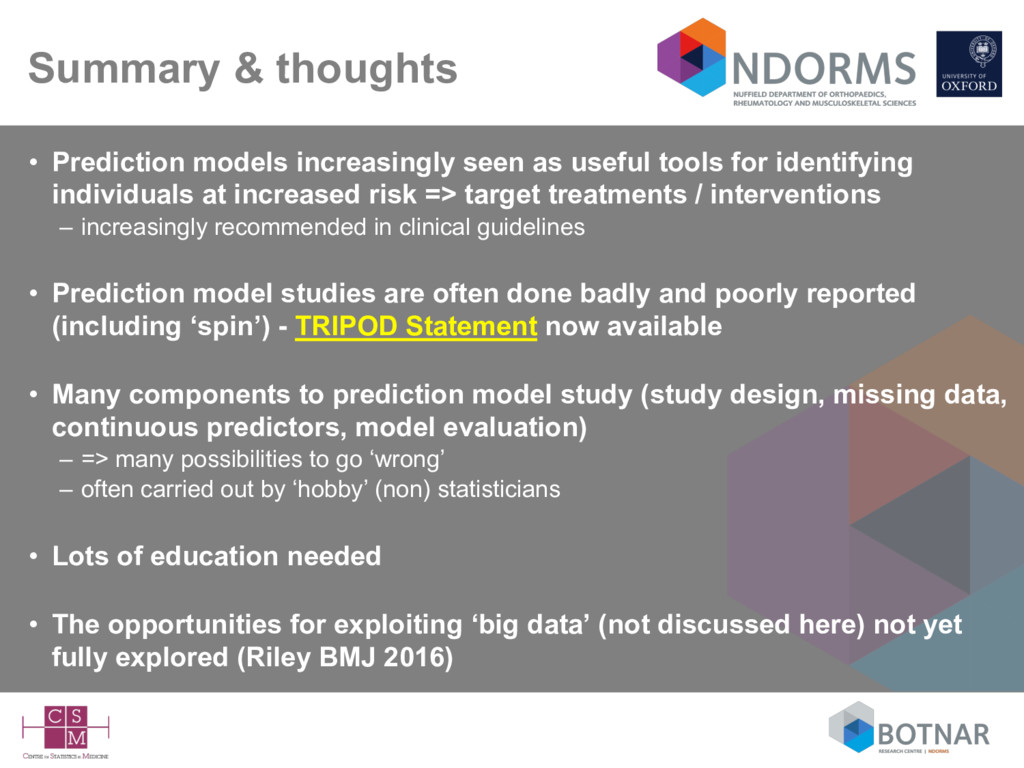
tools for identifying individuals at increased risk => target treatments / interventions – increasingly recommended in clinical guidelines • Prediction model studies are often done badly and poorly reported (including ‘spin’) - TRIPOD Statement now available • Many components to prediction model study (study design, missing data, continuous predictors, model evaluation) – => many possibilities to go ‘wrong’ – often carried out by ‘hobby’ (non) statisticians • Lots of education needed • The opportunities for exploiting ‘big data’ (not discussed here) not yet fully explored (Riley BMJ 2016)