Upgrade to Pro — share decks privately, control downloads, hide ads and more …

Alessandro Gasparini

Alessandro Gasparini

SAM Conference 2017

July 04, 2017
Tweet

More Decks by SAM Conference 2017

Other Decks in Research

Transcript

  1. Impact of model misspecification in survival models with frailties Alessandro

    Gasparini1 Keith R Abrams1 Michael J Crowther1 1Department of Health Sciences, University of Leicester, Leicester, United Kingdom Statistical Analysis of Multi-Outcome Data Conference 2017
  2. Motivation Survival data is commonly analysed by using parametric survival

    models or the Cox model. Nevertheless: 1. Subjects may be exposed to different baseline risk levels 2. Subjects may be clustered (clinical trials, geographical clusters, paired organs, twin studies, …) 3. Subjects may experience repeated events (infections, cancer recurrence, …) An elegant and increasingly popular approach: including in the model a multiplicative random effect that allows accounting for this unobserved heterogeneity (i.e. a frailty). Further details in Hougaard (2000) and Wienke (2010). [email protected] 1 of 19
  3. Survival models with shared frailty For the jth individual in

    the ith cluster: hij(t) = h0(t) exp(Xijβ)ui (1) hij(t) = h0(t) exp(Xijβ + wi) (2) In a parametric world, we need to choose: 1. baseline hazard h0(·): exponential, Weibull, Gompertz, flexible spline-based, … 2. distribution of the frailty ui (or wi ): Gamma, log-Normal, positive stable, … [email protected] 2 of 19
  4. Misspecification What we know: 1. The choice of the baseline

    hazard is often data-driven, using information criteria such as AIC and BIC 2. Relative risk estimates are insensitive to the correct specification of the baseline hazard (Rutherford, 2015) 3. Flexible parametric models (Royston, 2002) are robust to the choice of degrees of freedom for the spline function, assuming a sufficient number of degrees of freedom it is used (Rutherford, 2015) 4. The choice of frailty distribution has little impact on the estimation and testing of regression coefficients (Pickles, 1995) [email protected] 3 of 19
  5. A simulation study (1) Aim: assessing the impact of misspecifying

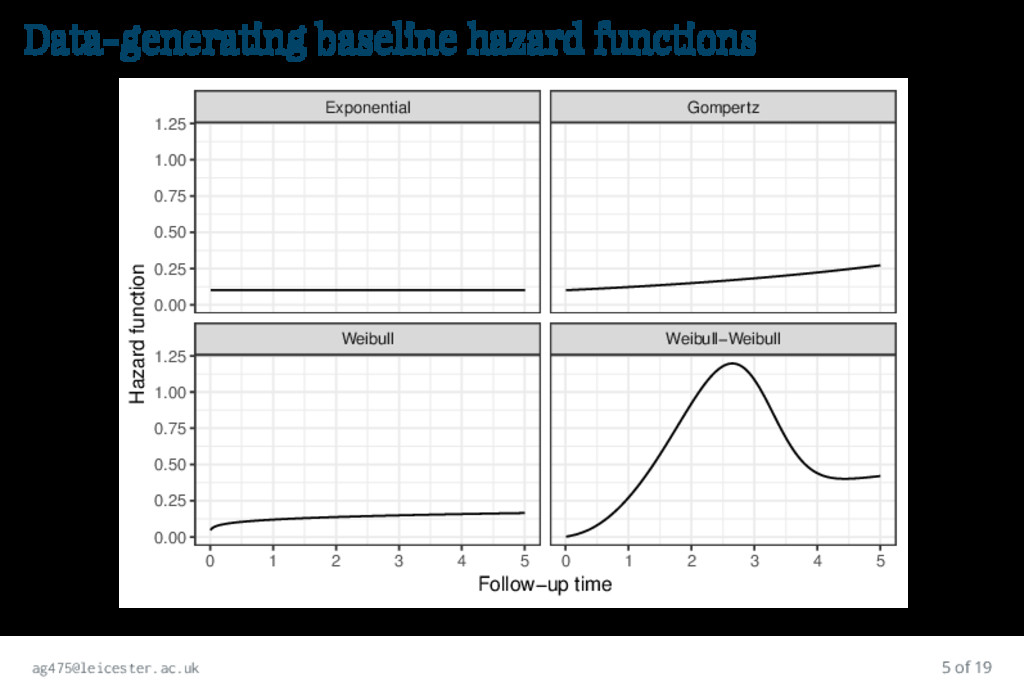
    the baseline hazard or the frailty distribution in a wide range of clinically and biologically plausible scenarios Data-generating mechanisms: • exponential baseline hazard • Weibull baseline hazard • Gompertz baseline hazard • mixture Weibull baseline hazard [email protected] 4 of 19
  6. Data-generating baseline hazard functions Weibull Weibull−Weibull Exponential Gompertz 0 1

    2 3 4 5 0 1 2 3 4 5 0.00 0.25 0.50 0.75 1.00 1.25 0.00 0.25 0.50 0.75 1.00 1.25 Follow−up time Hazard function [email protected] 5 of 19
  7. A simulation study (2) Data-generating mechanisms: • Gamma and log-Normal

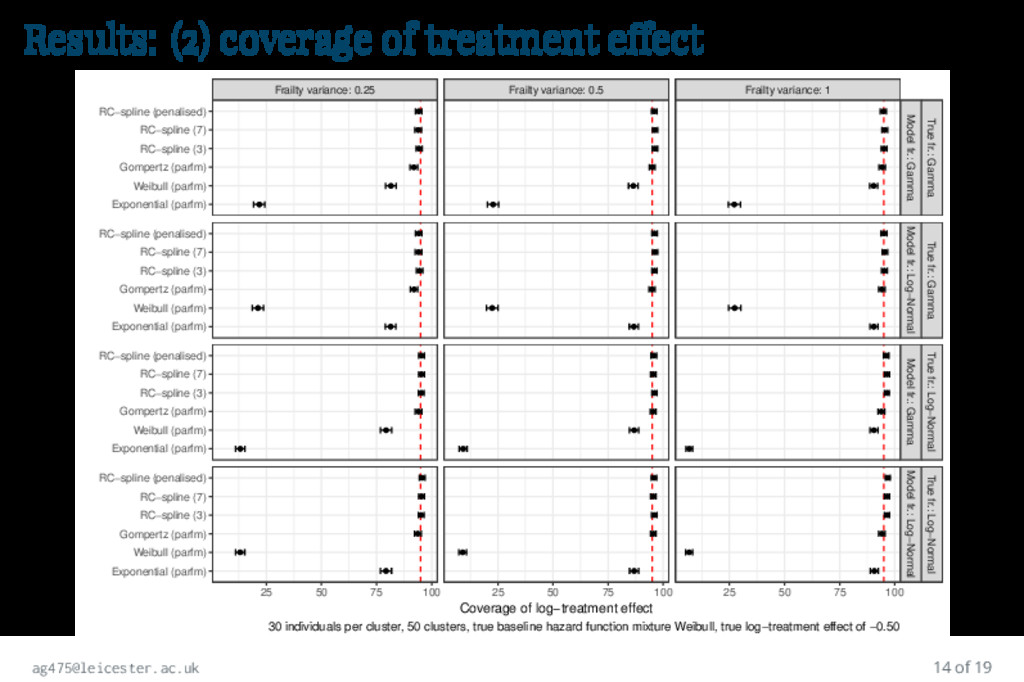
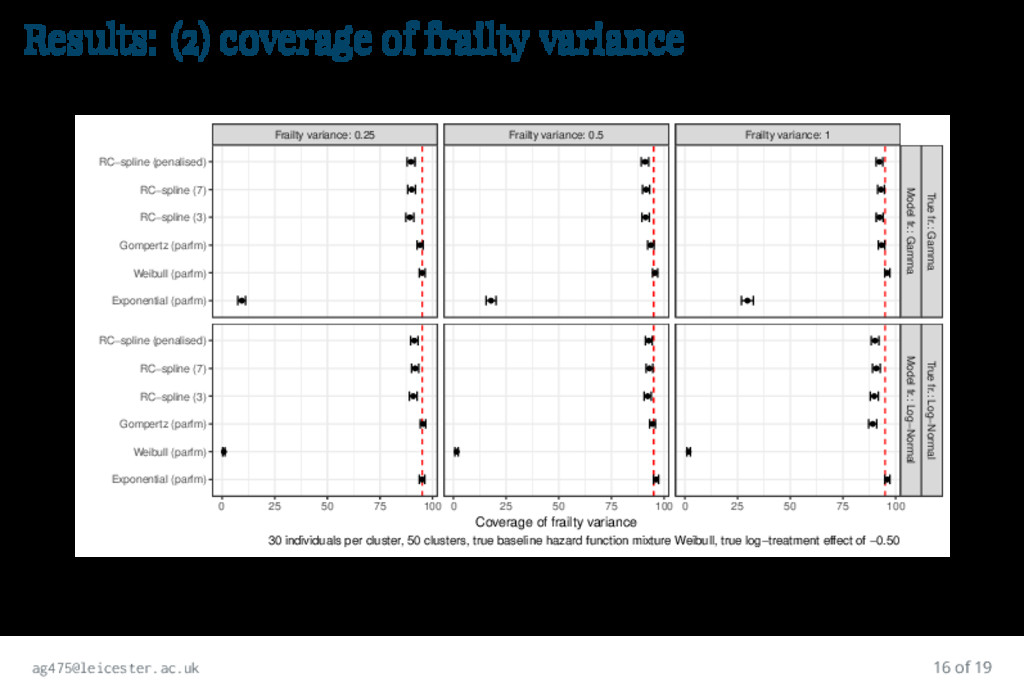
    frailty distribution • number of clusters (15, 50) and number of individuals per cluster (30, 100) • frailty variance (0.25, 0.50, 1.00) • log-treatment effect of -0.50 Methods: • exponential, Weibull, Gompertz parametric survival models • Royston-Parmar model with 3 to 9 degrees of freedom • Royston-Parmar model using penalised likelihood • each model with Gamma or log-Normal frailty [email protected] 6 of 19
  8. A simulation study (3) Estimands: • log-treatment effect • frailty

    variance Performance measures: • bias and percentage bias • coverage [email protected] 7 of 19
  9. Results Fully factorial design: 96 simulated scenarios. We present: 50

    clusters of 100 individuals each, frailty variance of 0.50 50 clusters of 30 individuals each, mixture Weibull baseline hazard [email protected] 8 of 19
  10. Results: (1) bias of treatment effect q q q q

    q q q q q q q q q q q q q q q q q q q q q q q q q q q q q q q q q q q q q q q q q q q q q q q q q q q q q q q q q q q q q q q q q q q q True hazard: Exponential True hazard: Weibull True hazard: Weibull−Weibull Model fr.: Gamma True fr.: Gamma Model fr.: Log−Normal True fr.: Gamma Model fr.: Gamma True fr.: Log−Normal Model fr.: Log−Normal True fr.: Log−Normal −0.05 0.00 0.05 0.10 0.15 −0.05 0.00 0.05 0.10 0.15 −0.05 0.00 0.05 0.10 0.15 Exponential (parfm) Weibull (parfm) Gompertz (parfm) RC−spline (3) RC−spline (7) RC−spline (penalised) Exponential (parfm) Weibull (parfm) Gompertz (parfm) RC−spline (3) RC−spline (7) RC−spline (penalised) Exponential (parfm) Weibull (parfm) Gompertz (parfm) RC−spline (3) RC−spline (7) RC−spline (penalised) Exponential (parfm) Weibull (parfm) Gompertz (parfm) RC−spline (3) RC−spline (7) RC−spline (penalised) Bias of log−treatment effect 100 individuals per cluster, 50 clusters, frailty variance of 0.50, true log−treatment effect of −0.50 [email protected] 9 of 19
  11. Results: (1) coverage of treatment effect q q q q

    q q q q q q q q q q q q q q q q q q q q q q q q q q q q q q q q q q q q q q q q q q q q q q q q q q q q q q q q q q q q q q q q q q q q True hazard: Exponential True hazard: Weibull True hazard: Weibull−Weibull Model fr.: Gamma True fr.: Gamma Model fr.: Log−Normal True fr.: Gamma Model fr.: Gamma True fr.: Log−Normal Model fr.: Log−Normal True fr.: Log−Normal 0 25 50 75 100 0 25 50 75 100 0 25 50 75 100 Exponential (parfm) Weibull (parfm) Gompertz (parfm) RC−spline (3) RC−spline (7) RC−spline (penalised) Exponential (parfm) Weibull (parfm) Gompertz (parfm) RC−spline (3) RC−spline (7) RC−spline (penalised) Exponential (parfm) Weibull (parfm) Gompertz (parfm) RC−spline (3) RC−spline (7) RC−spline (penalised) Exponential (parfm) Weibull (parfm) Gompertz (parfm) RC−spline (3) RC−spline (7) RC−spline (penalised) Coverage of log−treatment effect 100 individuals per cluster, 50 clusters, frailty variance of 0.50, true log−treatment effect of −0.50 [email protected] 10 of 19
  12. Results: (1) bias of frailty variance q q q q

    q q q q q q q q q q q q q q q q q q q q q q q q q q q q q q q q True hazard: Exponential True hazard: Weibull True hazard: Weibull−Weibull Model fr.: Gamma True fr.: Gamma Model fr.: Log−Normal True fr.: Log−Normal −0.2 −0.1 0.0 0.1 −0.2 −0.1 0.0 0.1 −0.2 −0.1 0.0 0.1 Exponential (parfm) Weibull (parfm) Gompertz (parfm) RC−spline (3) RC−spline (7) RC−spline (penalised) Exponential (parfm) Weibull (parfm) Gompertz (parfm) RC−spline (3) RC−spline (7) RC−spline (penalised) Bias of frailty variance 100 individuals per cluster, 50 clusters, frailty variance of 0.50, true log−treatment effect of −0.50 [email protected] 11 of 19
  13. Results: (1) coverage of frailty variance q q q q

    q q q q q q q q q q q q q q q q q q q q q q q q q q q q q q q q True hazard: Exponential True hazard: Weibull True hazard: Weibull−Weibull Model fr.: Gamma True fr.: Gamma Model fr.: Log−Normal True fr.: Log−Normal 0 25 50 75 100 0 25 50 75 100 0 25 50 75 100 Exponential (parfm) Weibull (parfm) Gompertz (parfm) RC−spline (3) RC−spline (7) RC−spline (penalised) Exponential (parfm) Weibull (parfm) Gompertz (parfm) RC−spline (3) RC−spline (7) RC−spline (penalised) Coverage of frailty variance 100 individuals per cluster, 50 clusters, frailty variance of 0.50, true log−treatment effect of −0.50 [email protected] 12 of 19
  14. Results: (2) bias of treatment effect q q q q

    q q q q q q q q q q q q q q q q q q q q q q q q q q q q q q q q q q q q q q q q q q q q q q q q q q q q q q q q q q q q q q q q q q q q Frailty variance: 0.25 Frailty variance: 0.5 Frailty variance: 1 Model fr.: Gamma True fr.: Gamma Model fr.: Log−Normal True fr.: Gamma Model fr.: Gamma True fr.: Log−Normal Model fr.: Log−Normal True fr.: Log−Normal 0.0 0.1 0.0 0.1 0.0 0.1 Exponential (parfm) Weibull (parfm) Gompertz (parfm) RC−spline (3) RC−spline (7) RC−spline (penalised) Exponential (parfm) Weibull (parfm) Gompertz (parfm) RC−spline (3) RC−spline (7) RC−spline (penalised) Exponential (parfm) Weibull (parfm) Gompertz (parfm) RC−spline (3) RC−spline (7) RC−spline (penalised) Exponential (parfm) Weibull (parfm) Gompertz (parfm) RC−spline (3) RC−spline (7) RC−spline (penalised) Bias of log−treatment effect 30 individuals per cluster, 50 clusters, true baseline hazard function mixture Weibull, true log−treatment effect of −0.50 [email protected] 13 of 19
  15. Results: (2) coverage of treatment effect q q q q

    q q q q q q q q q q q q q q q q q q q q q q q q q q q q q q q q q q q q q q q q q q q q q q q q q q q q q q q q q q q q q q q q q q q q Frailty variance: 0.25 Frailty variance: 0.5 Frailty variance: 1 Model fr.: Gamma True fr.: Gamma Model fr.: Log−Normal True fr.: Gamma Model fr.: Gamma True fr.: Log−Normal Model fr.: Log−Normal True fr.: Log−Normal 25 50 75 100 25 50 75 100 25 50 75 100 Exponential (parfm) Weibull (parfm) Gompertz (parfm) RC−spline (3) RC−spline (7) RC−spline (penalised) Exponential (parfm) Weibull (parfm) Gompertz (parfm) RC−spline (3) RC−spline (7) RC−spline (penalised) Exponential (parfm) Weibull (parfm) Gompertz (parfm) RC−spline (3) RC−spline (7) RC−spline (penalised) Exponential (parfm) Weibull (parfm) Gompertz (parfm) RC−spline (3) RC−spline (7) RC−spline (penalised) Coverage of log−treatment effect 30 individuals per cluster, 50 clusters, true baseline hazard function mixture Weibull, true log−treatment effect of −0.50 [email protected] 14 of 19
  16. Results: (2) percentage bias of frailty variance q q q

    q q q q q q q q q q q q q q q q q q q q q q q q q q q q q q q q q Frailty variance: 0.25 Frailty variance: 0.5 Frailty variance: 1 Model fr.: Gamma True fr.: Gamma Model fr.: Log−Normal True fr.: Log−Normal −50 −25 0 25 −50 −25 0 25 −50 −25 0 25 Exponential (parfm) Weibull (parfm) Gompertz (parfm) RC−spline (3) RC−spline (7) RC−spline (penalised) Exponential (parfm) Weibull (parfm) Gompertz (parfm) RC−spline (3) RC−spline (7) RC−spline (penalised) Percentage bias of frailty variance 30 individuals per cluster, 50 clusters, true baseline hazard function mixture Weibull, true log−treatment effect of −0.50 [email protected] 15 of 19
  17. Results: (2) coverage of frailty variance q q q q

    q q q q q q q q q q q q q q q q q q q q q q q q q q q q q q q q Frailty variance: 0.25 Frailty variance: 0.5 Frailty variance: 1 Model fr.: Gamma True fr.: Gamma Model fr.: Log−Normal True fr.: Log−Normal 0 25 50 75 100 0 25 50 75 100 0 25 50 75 100 Exponential (parfm) Weibull (parfm) Gompertz (parfm) RC−spline (3) RC−spline (7) RC−spline (penalised) Exponential (parfm) Weibull (parfm) Gompertz (parfm) RC−spline (3) RC−spline (7) RC−spline (penalised) Coverage of frailty variance 30 individuals per cluster, 50 clusters, true baseline hazard function mixture Weibull, true log−treatment effect of −0.50 [email protected] 16 of 19
  18. Conclusions Misspecification of the baseline hazard can yield markedly biased

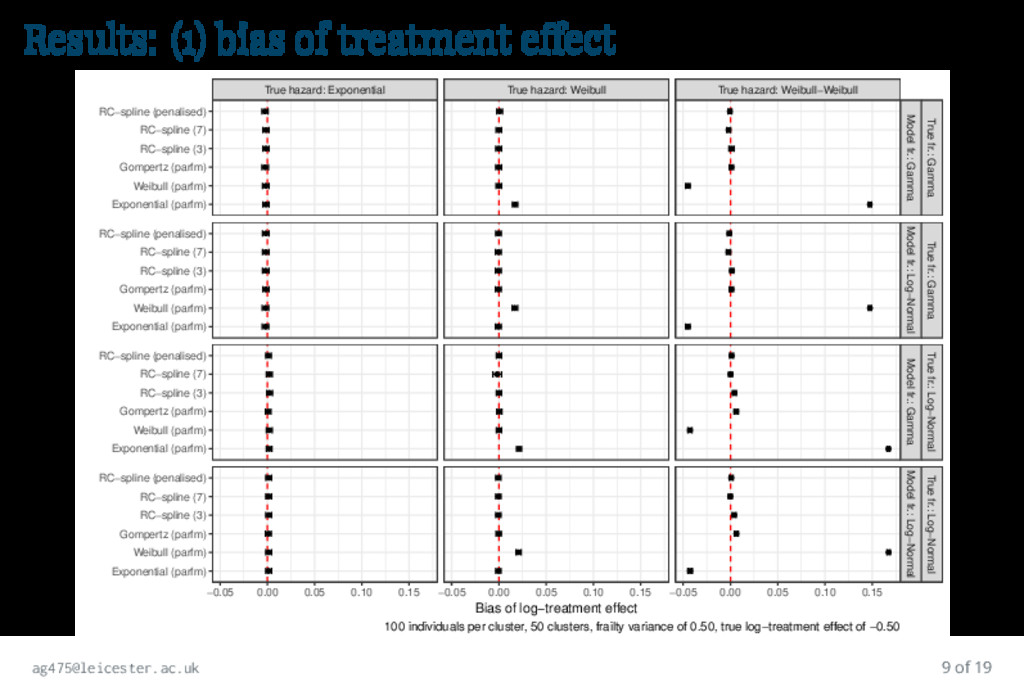
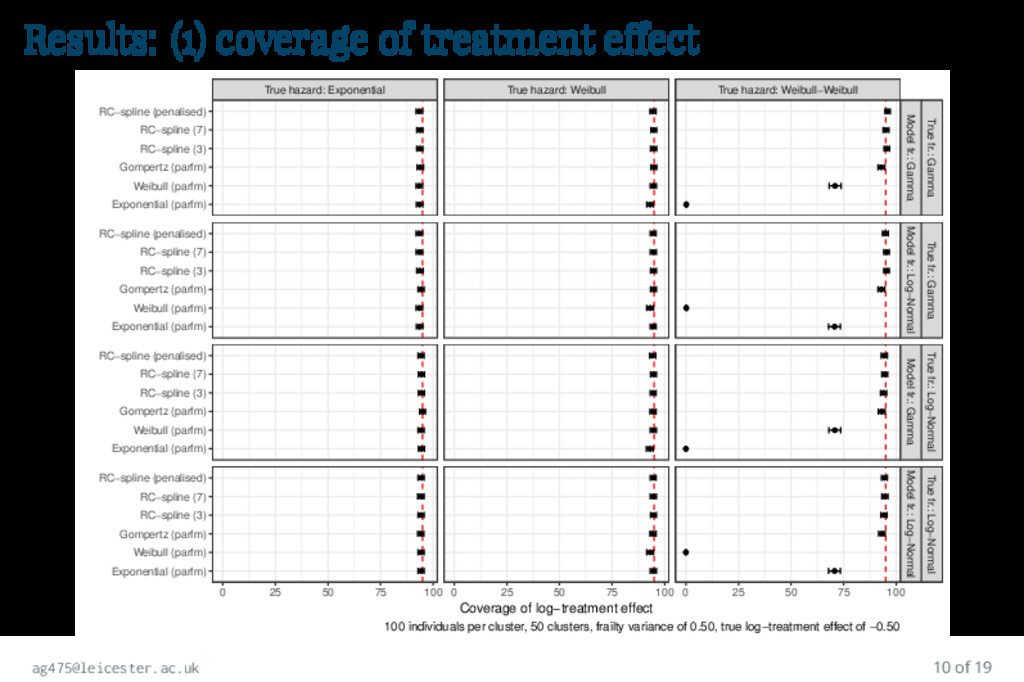
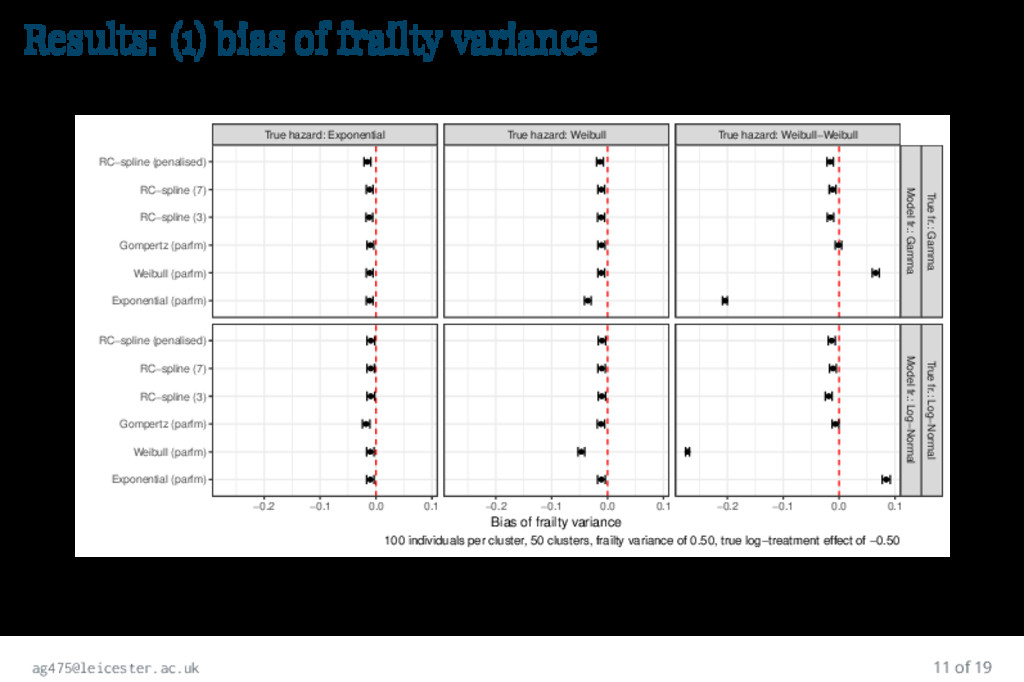
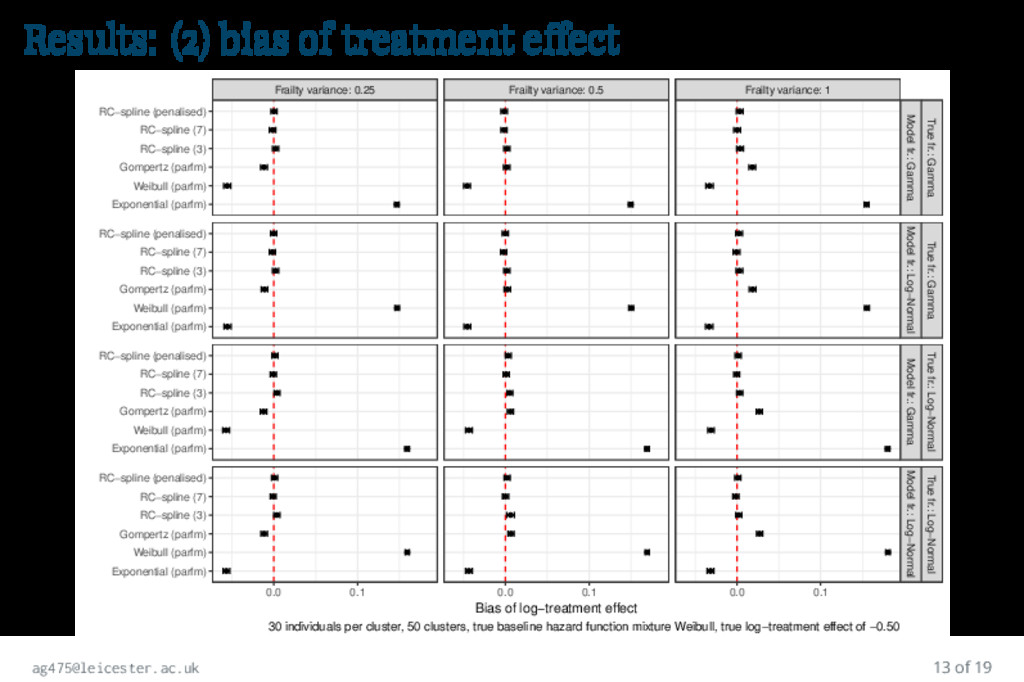
    regression coefficients, irrespectively of the frailty distribution Misspecification of the baseline hazard can also yield biased estimates of the frailty variance, even when the frailty distribution is well specified Misspecification of the frailty distribution has a negligible impact on bias of regression coefficients Flexible parametric models tend to be quite robust to model misspecification, using both full and penalised likelihood estimation procedures Further simulations will provide greater insight on the topic, especially on absolute risk predictions [email protected] 17 of 19
  19. Next steps 1. Adding a simulation scenario with 1,000 clusters

    of 2 observations each: twin data 2. Adding marginal survival as estimand: ease of obtaining absolute risk predictions is one of the advantages of parametric models 3. Adding further comparisons with available software: shared frailty models with M-splines on the hazard scale estimated using penalised likelihood (R package frailtypack), … [email protected] 18 of 19
  20. References Hougaard P (2000). Analysis of multivariate survival data, Springer,

    New York Wienke A (2010). Frailty models in survival analysis, Chapman and Hall / CRC Rutherford MJ, Crowther MJ and Lambert PC (2015). The use of restricted cubic splines to approximate complex hazard functions in the analysis of time-to-event data: a simulation study, Journal of Statistical Computation and Simulation, 85(4):777-793 Royston P and Parmar MK (2002). Flexible parametric proportional-hazards and proportional-odds models for censored survival data, with application to prognostic modelling and estimation of treatment effects, Statistics in Medicine, 21(15):2175-2197 Pickles A and Crouchley R (1995). A comparison of frailty models for multivariate survival data, Statistics in Medicine, 14(13):1447-1461 [email protected] 19 of 19