• Allows increased precision, identification of effect sizes too small to be identified in single studies, and allows questions additional to those originally posed in the data to be answered • Gold standard – Individual Participant/Patient Data (IPD) meta-analyses, where data for each individual recorded in studies identified in the meta-analysis is available.
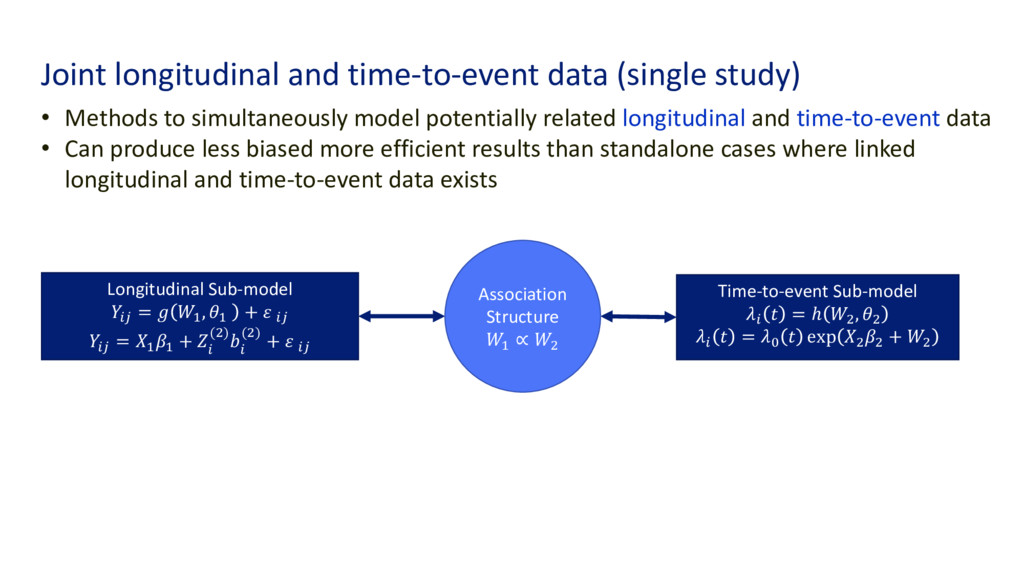
multiple studies • Clustering of data within studies must be accounted for (e.g. through random effects, interaction terms, stratified baseline hazard) Longitudinal Sub-model <"# = ' , + <"# <"# = ' ' + <" (1) <" (1) + <" (=) < (=) + <"# Study 1 Longitudinal Data Study 2 Longitudinal Data Study Longitudinal Data Time-to-event Sub-model <" = ℎ 1 , <" = 7 exp 1 1 + 1 Study 1 Event time Data Study 2 Event time Data Study Event time Data Association Structure ' ∝ 1
approaches – one stage or two stage • Two stage approaches • Separate joint models fitted to data from each study • Results from each study pooled using standard meta-analytic techniques • One stage approaches • Joint model fitted to meta-dataset (containing data from all studies) • Clustering of data must be accounted for
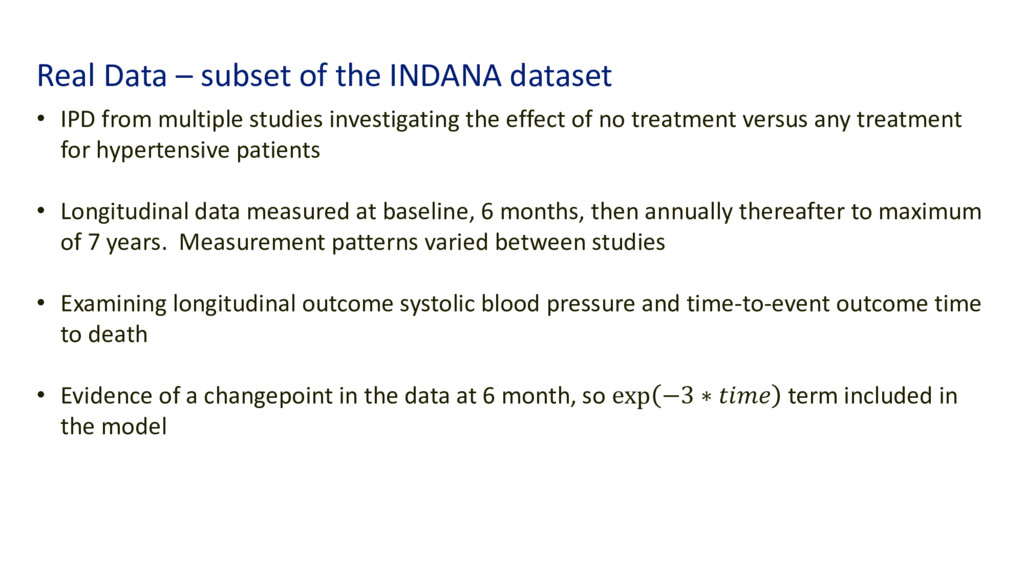
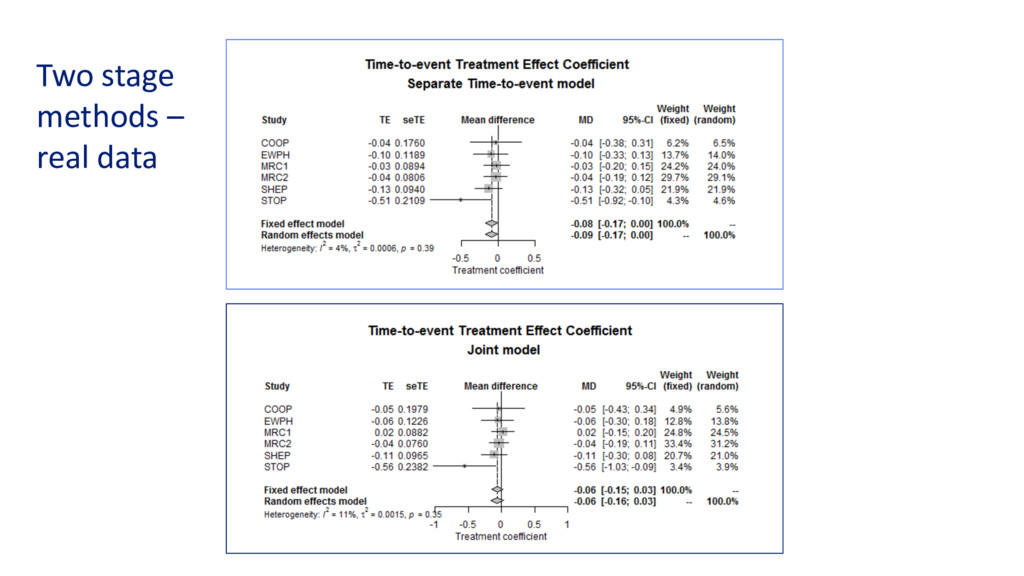
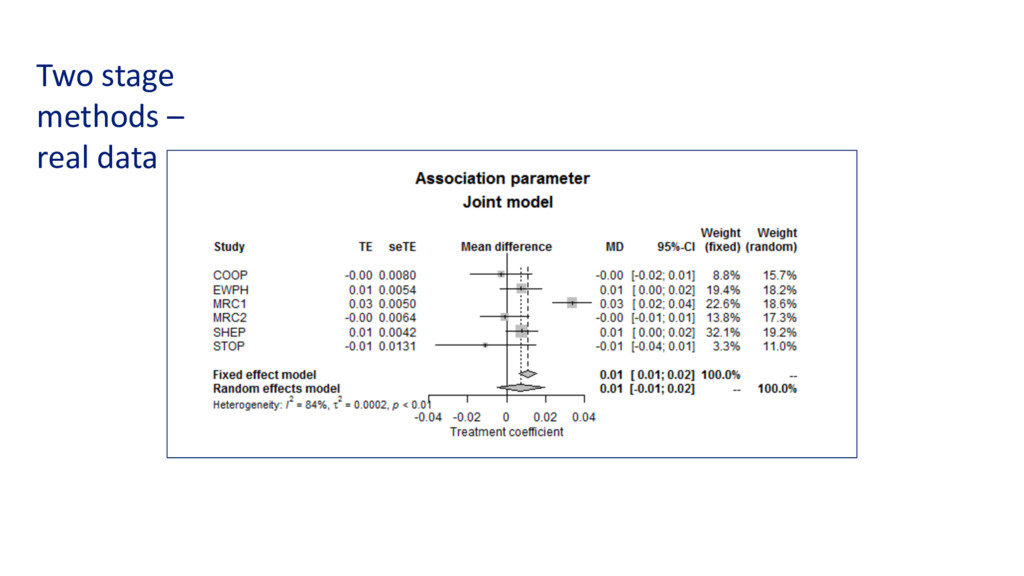
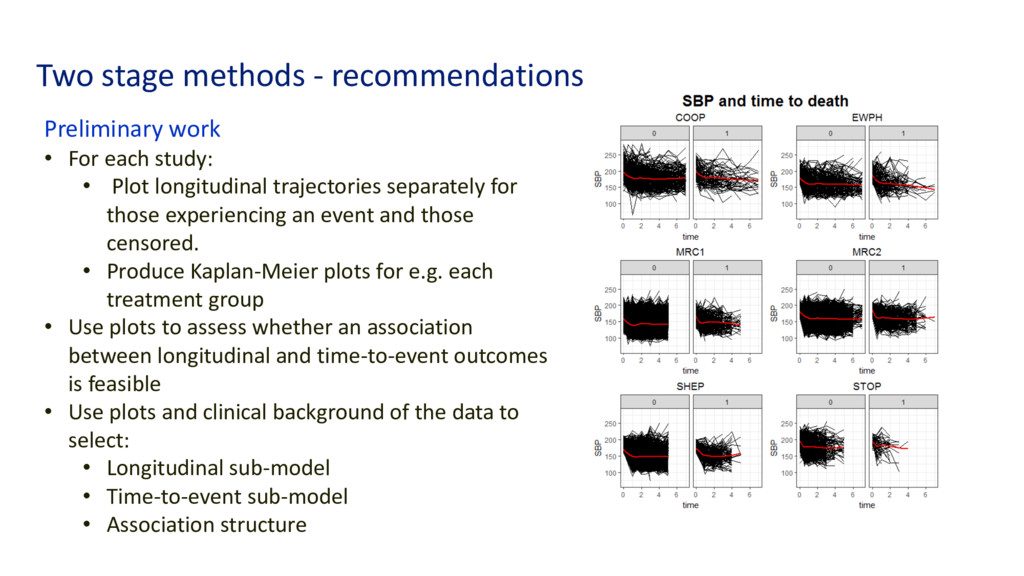
from multiple studies investigating the effect of no treatment versus any treatment for hypertensive patients • Longitudinal data measured at baseline, 6 months, then annually thereafter to maximum of 7 years. Measurement patterns varied between studies • Examining longitudinal outcome systolic blood pressure and time-to-event outcome time to death • Evidence of a changepoint in the data at 6 month, so exp −3 ∗ term included in the model
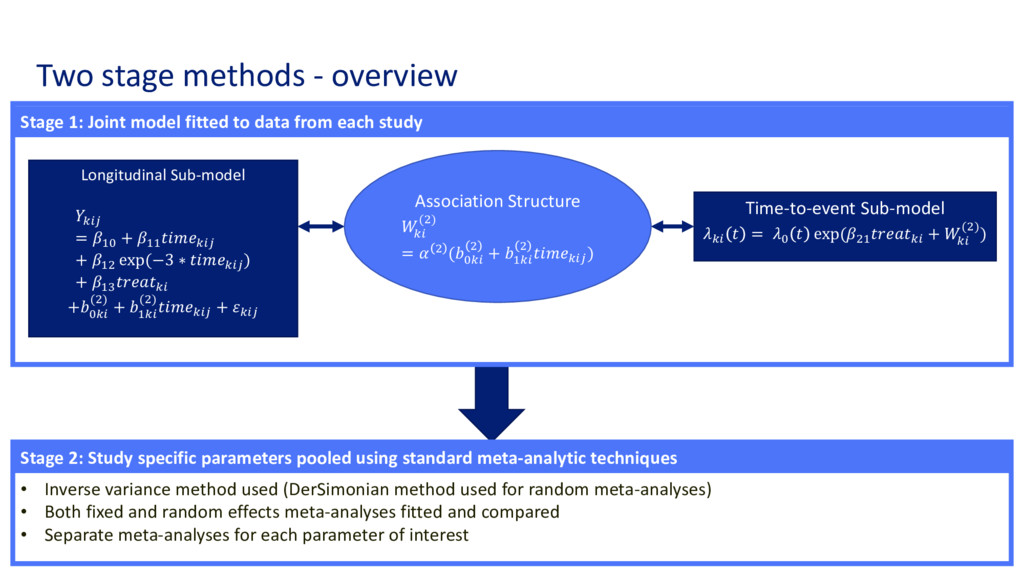
to data from each study Stage 2: Study specific parameters pooled using standard meta-analytic techniques Longitudinal Sub-model <"# = '7 + '' <"# + '1 exp(−3 ∗ <"# ) + '= <" + 7<" (1) + '<" (1)<"# + <"# Time-to-event Sub-model <" = 7 exp(1' <" + <" (1)) Association Structure <" (1) = 1 (7<" 1 + '<" 1 <"# ) • Inverse variance method used (DerSimonian method used for random meta-analyses) • Both fixed and random effects meta-analyses fitted and compared • Separate meta-analyses for each parameter of interest
study: • Plot longitudinal trajectories separately for those experiencing an event and those censored. • Produce Kaplan-Meier plots for e.g. each treatment group • Use plots to assess whether an association between longitudinal and time-to-event outcomes is feasible • Use plots and clinical background of the data to select: • Longitudinal sub-model • Time-to-event sub-model • Association structure
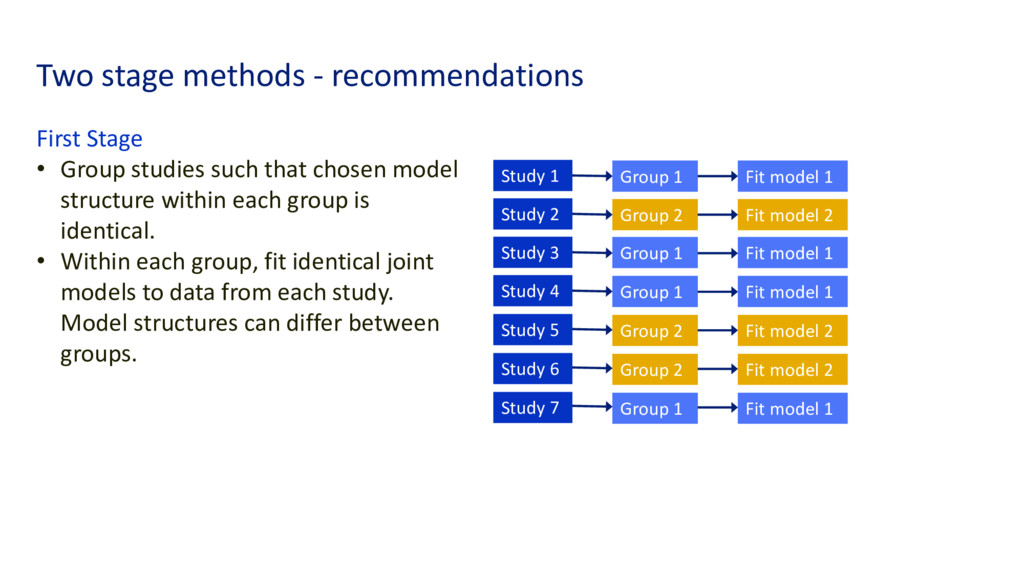
such that chosen model structure within each group is identical. • Within each group, fit identical joint models to data from each study. Model structures can differ between groups. Study 1 Study 2 Study 3 Study 6 Study 4 Study 5 Study 7 Group 1 Group 2 Group 1 Group 2 Group 2 Group 1 Group 1 Fit model 1 Fit model 2 Fit model 1 Fit model 2 Fit model 2 Fit model 1 Fit model 1
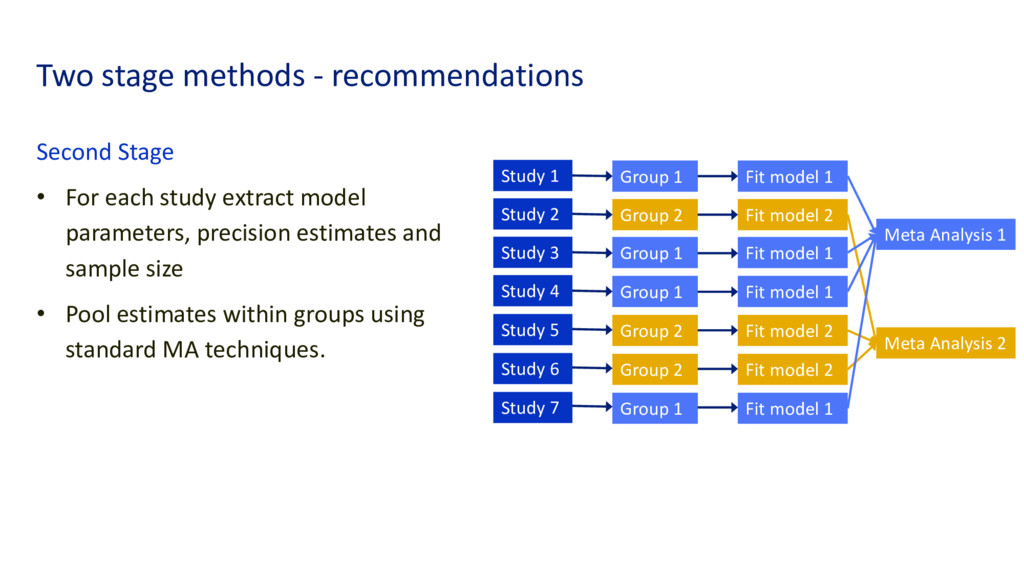
study extract model parameters, precision estimates and sample size • Pool estimates within groups using standard MA techniques. Study 1 Study 2 Study 3 Study 6 Study 4 Study 5 Study 7 Group 1 Group 2 Group 1 Group 2 Group 2 Group 1 Group 1 Fit model 1 Fit model 2 Fit model 1 Fit model 2 Fit model 2 Fit model 1 Fit model 1 Meta Analysis 1 Meta Analysis 2
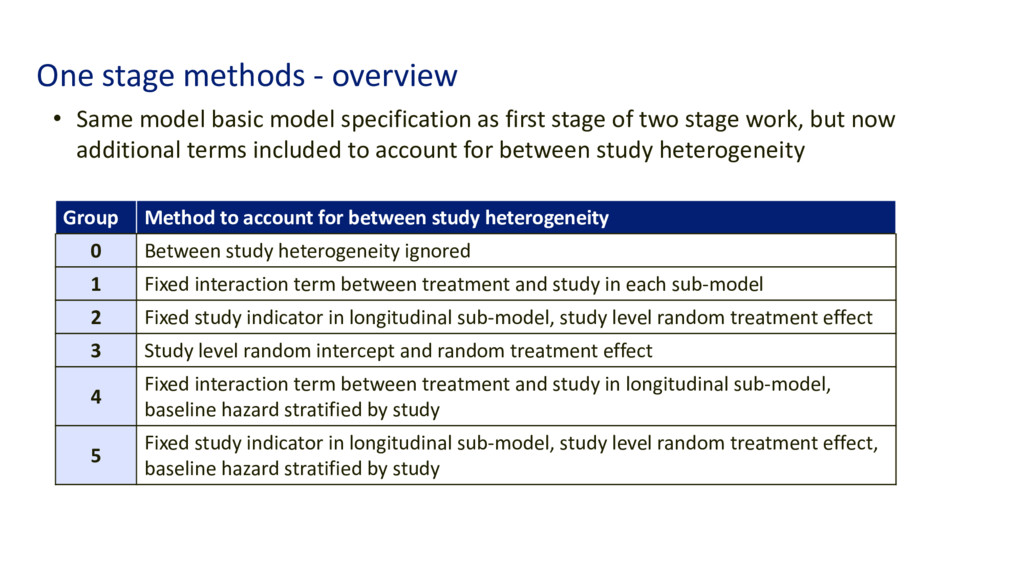
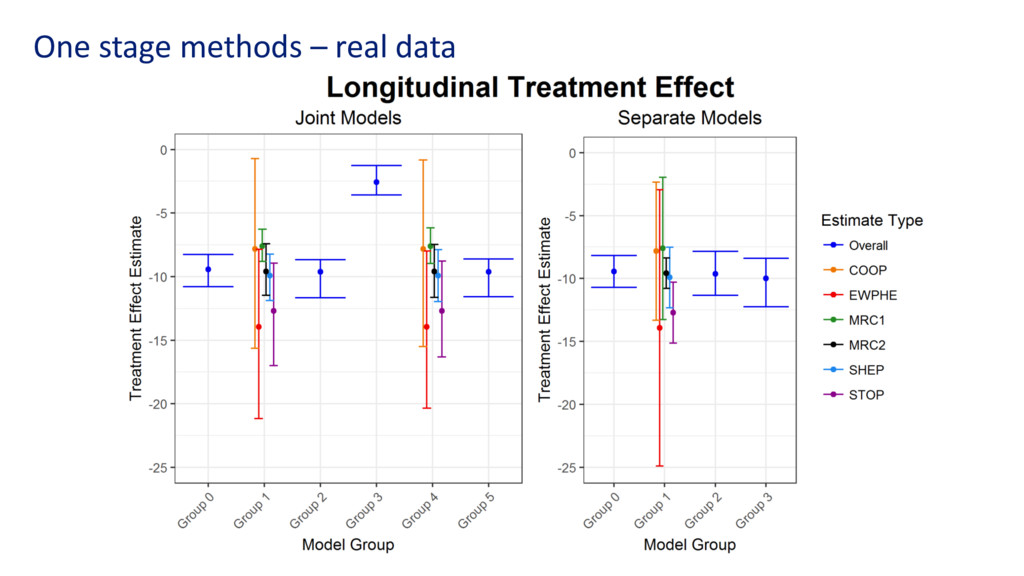
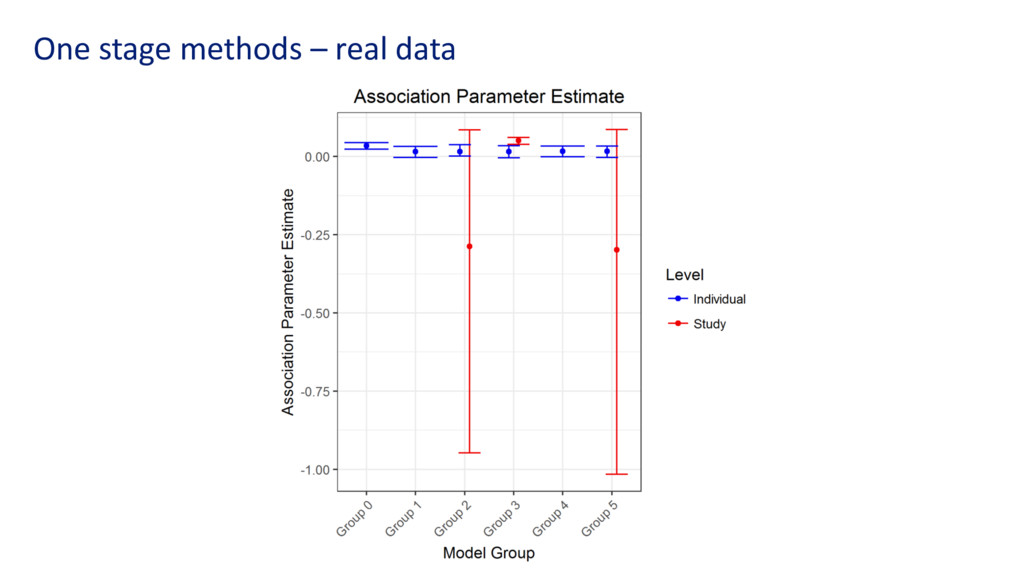
specification as first stage of two stage work, but now additional terms included to account for between study heterogeneity Group Method to account for between study heterogeneity 0 Between study heterogeneity ignored 1 Fixed interaction term between treatment and study in each sub-model 2 Fixed study indicator in longitudinal sub-model, study level random treatment effect 3 Study level random intercept and random treatment effect 4 Fixed interaction term between treatment and study in longitudinal sub-model, baseline hazard stratified by study 5 Fixed study indicator in longitudinal sub-model, study level random treatment effect, baseline hazard stratified by study
of joint data to pool only parameters with comparable interpretations • A variety of methods exist to model multi-study joint data in a one stage analyses, however some may not be appropriate unless the number of studies in the meta- analysis is over a given threshold • Functions for analysis of multi-study joint data available in R package joineRmeta