~1.5 years of experience with the language ▪ Interested in distributed systems, databases and performance ▪ I work on random experiments for curiosity and fun! ▪ Love watching sports, and playing video games
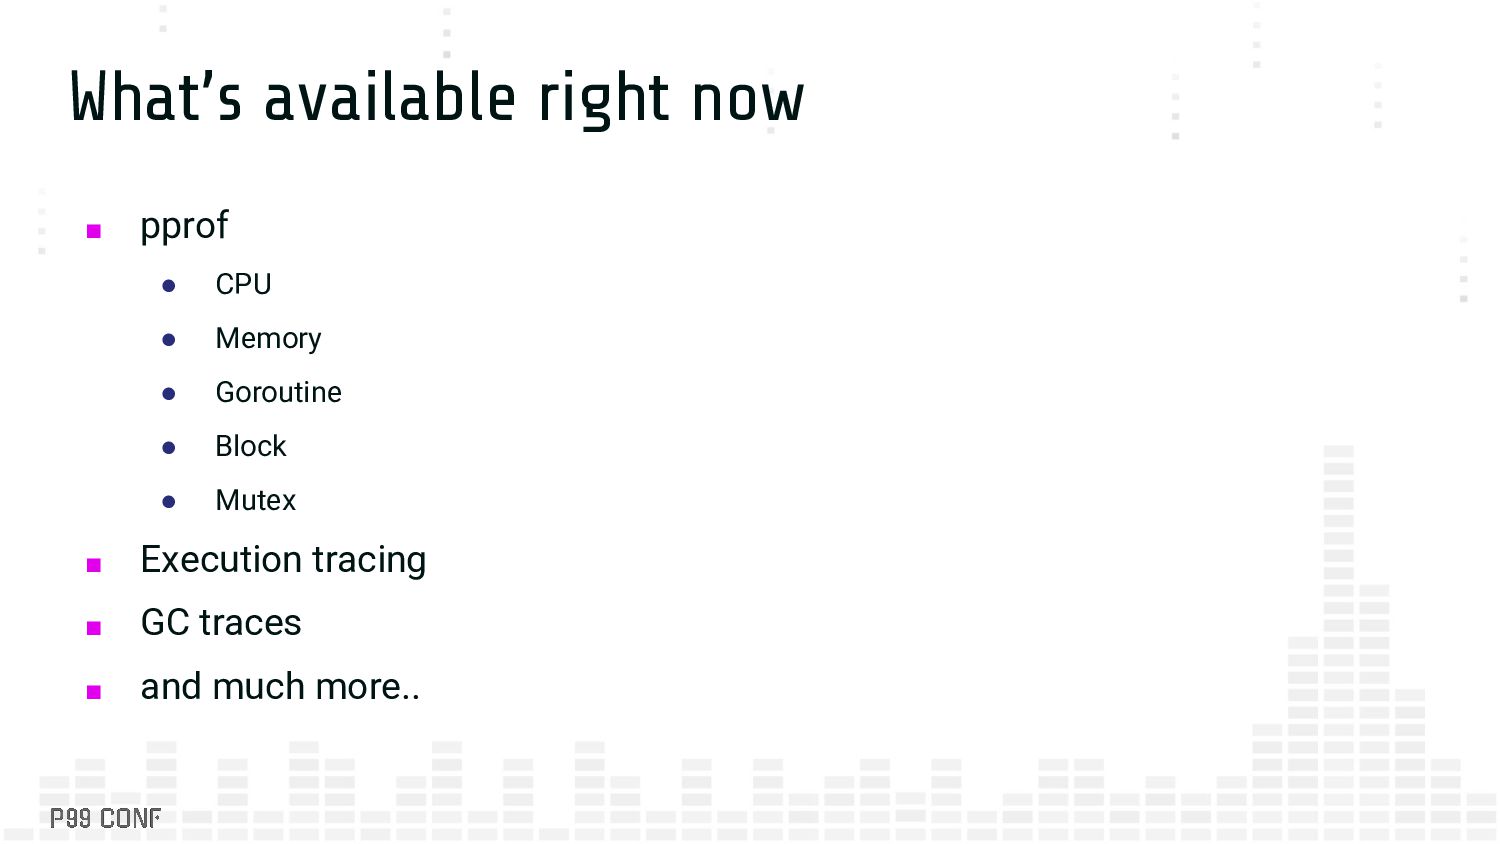
Go runtime ▪ What worked, what didn’t ▪ Ongoing work ▪ A bit about Go runtime observability ▪ Understanding the existing ecosystem (pprof, etc.) ▪ Going beyond pprof
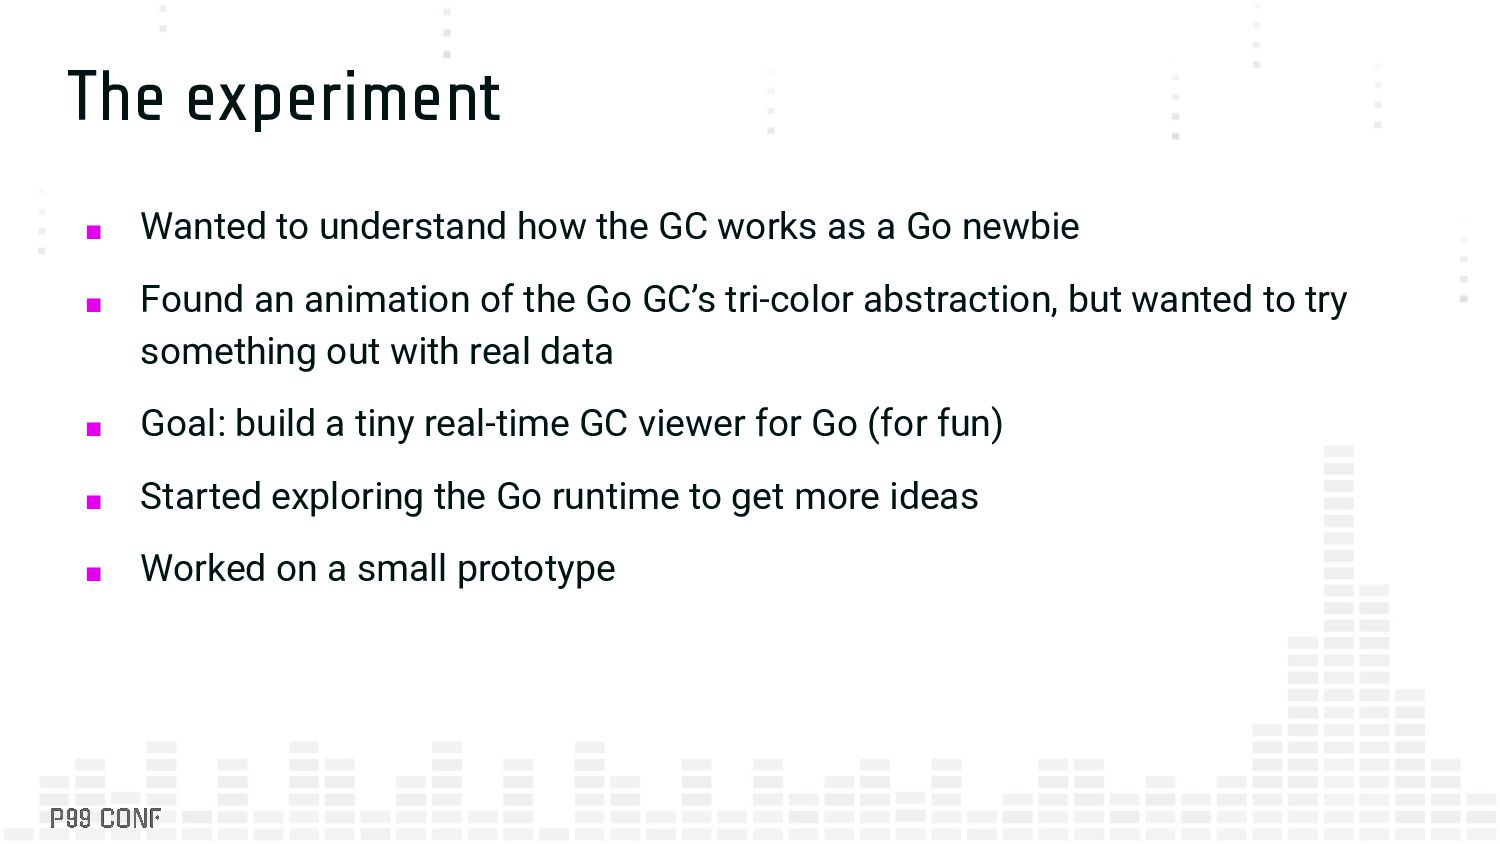
as a Go newbie ▪ Found an animation of the Go GC’s tri-color abstraction, but wanted to try something out with real data ▪ Goal: build a tiny real-time GC viewer for Go (for fun) ▪ Started exploring the Go runtime to get more ideas ▪ Worked on a small prototype
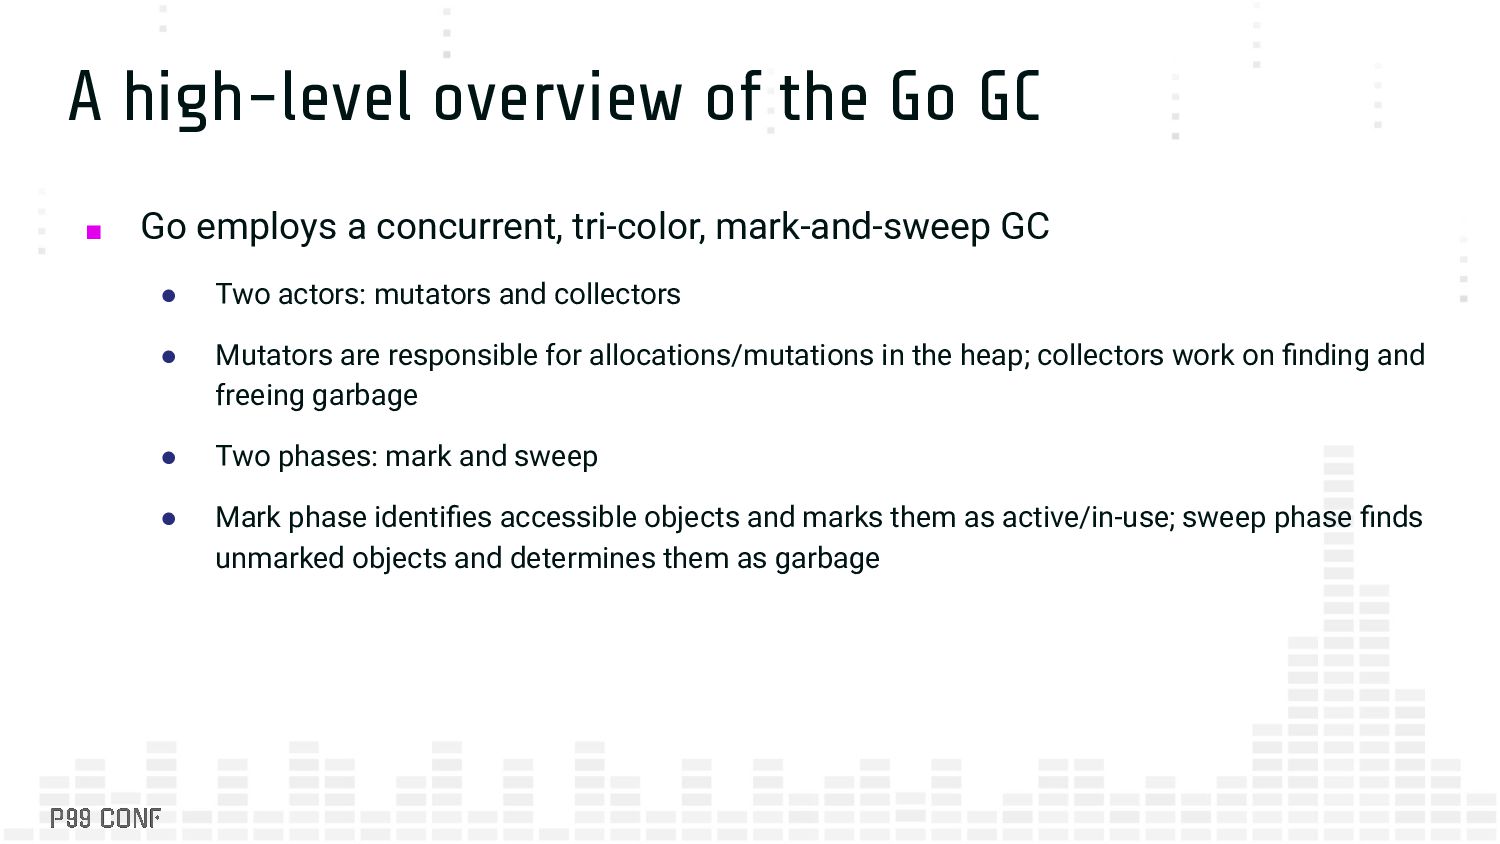
a concurrent, tri-color, mark-and-sweep GC • Two actors: mutators and collectors • Mutators are responsible for allocations/mutations in the heap; collectors work on finding and freeing garbage • Two phases: mark and sweep • Mark phase identifies accessible objects and marks them as active/in-use; sweep phase finds unmarked objects and determines them as garbage
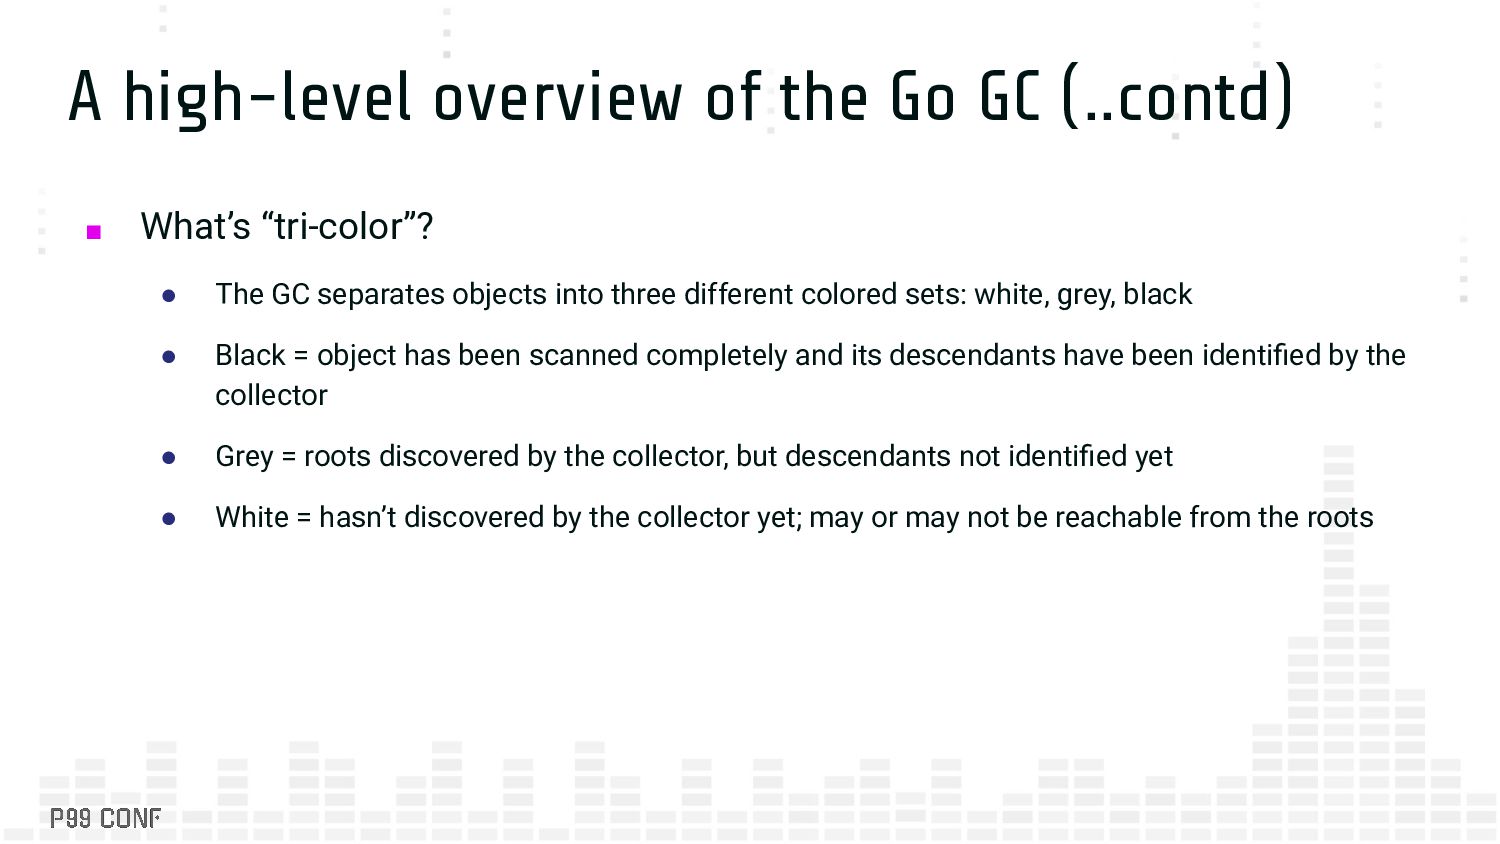
“tri-color”? • The GC separates objects into three different colored sets: white, grey, black • Black = object has been scanned completely and its descendants have been identified by the collector • Grey = roots discovered by the collector, but descendants not identified yet • White = hasn’t discovered by the collector yet; may or may not be reachable from the roots
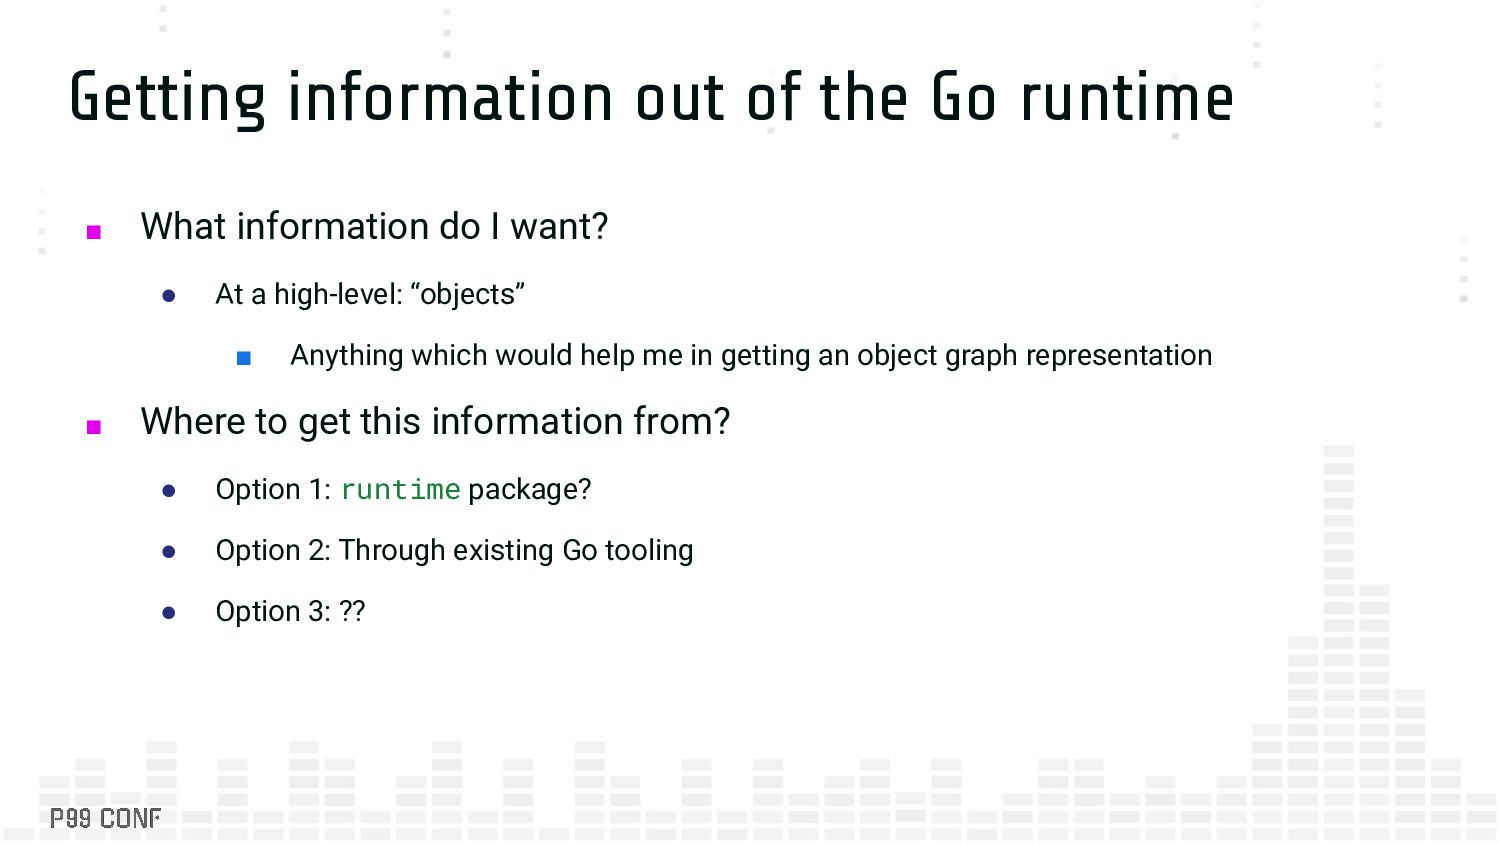
do I want? • At a high-level: “objects” ▪ Anything which would help me in getting an object graph representation ▪ Where to get this information from? • Option 1: runtime package? • Option 2: Through existing Go tooling • Option 3: ??
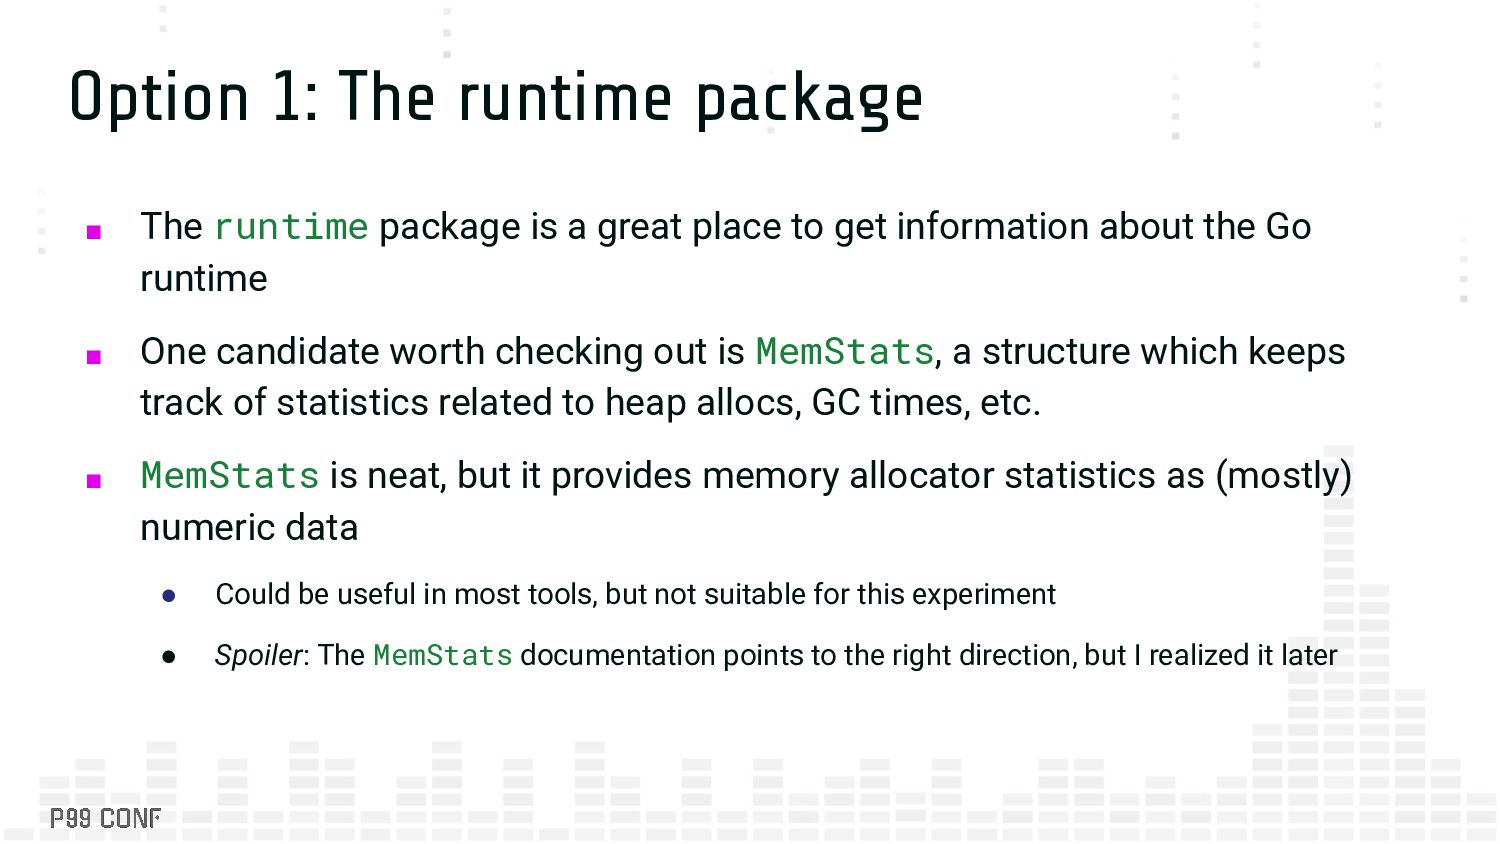
a great place to get information about the Go runtime ▪ One candidate worth checking out is MemStats, a structure which keeps track of statistics related to heap allocs, GC times, etc. ▪ MemStats is neat, but it provides memory allocator statistics as (mostly) numeric data • Could be useful in most tools, but not suitable for this experiment • Spoiler: The MemStats documentation points to the right direction, but I realized it later
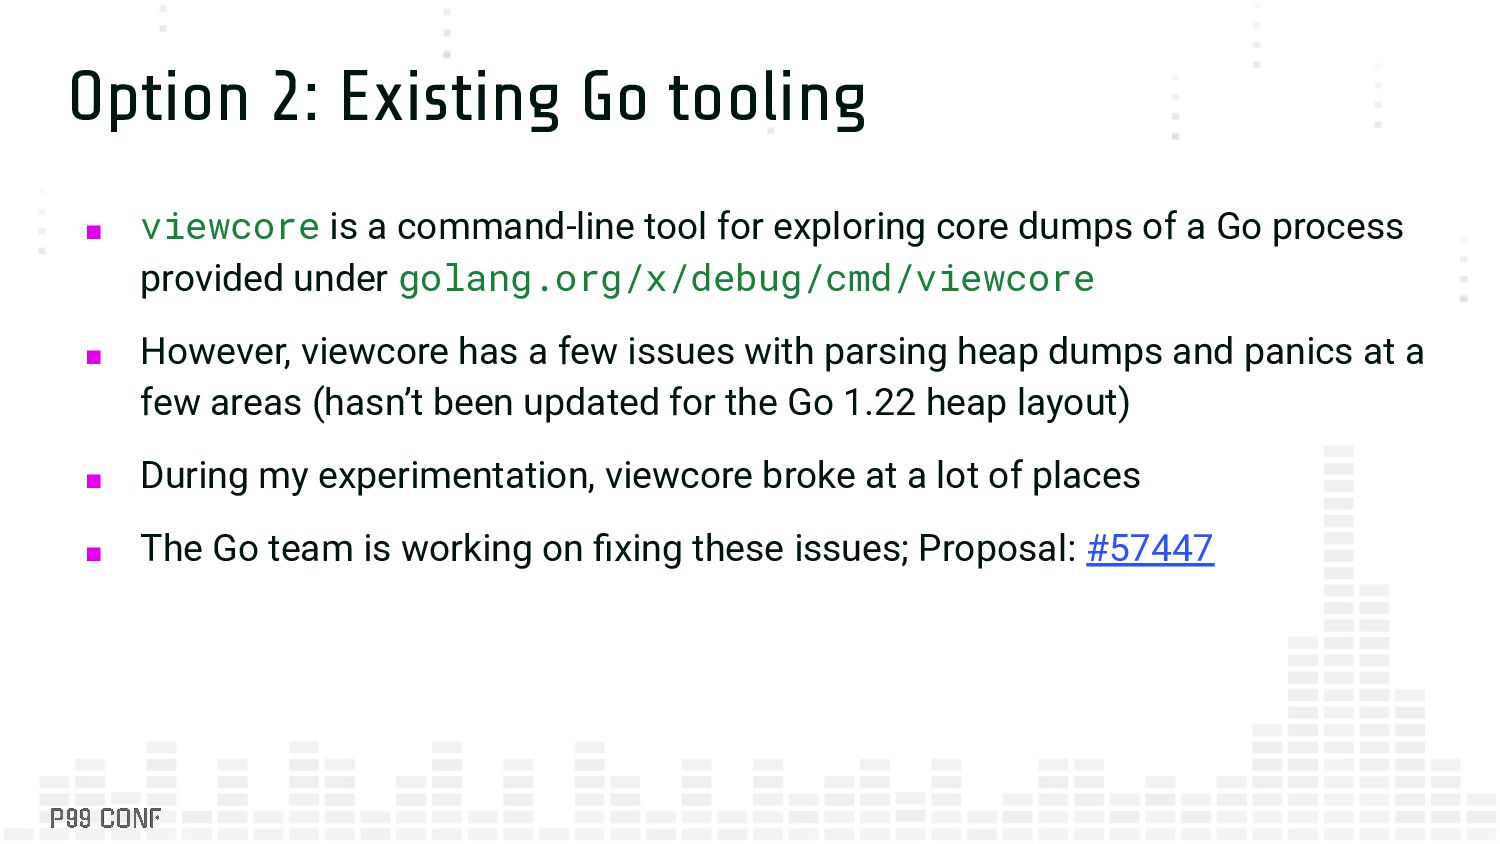
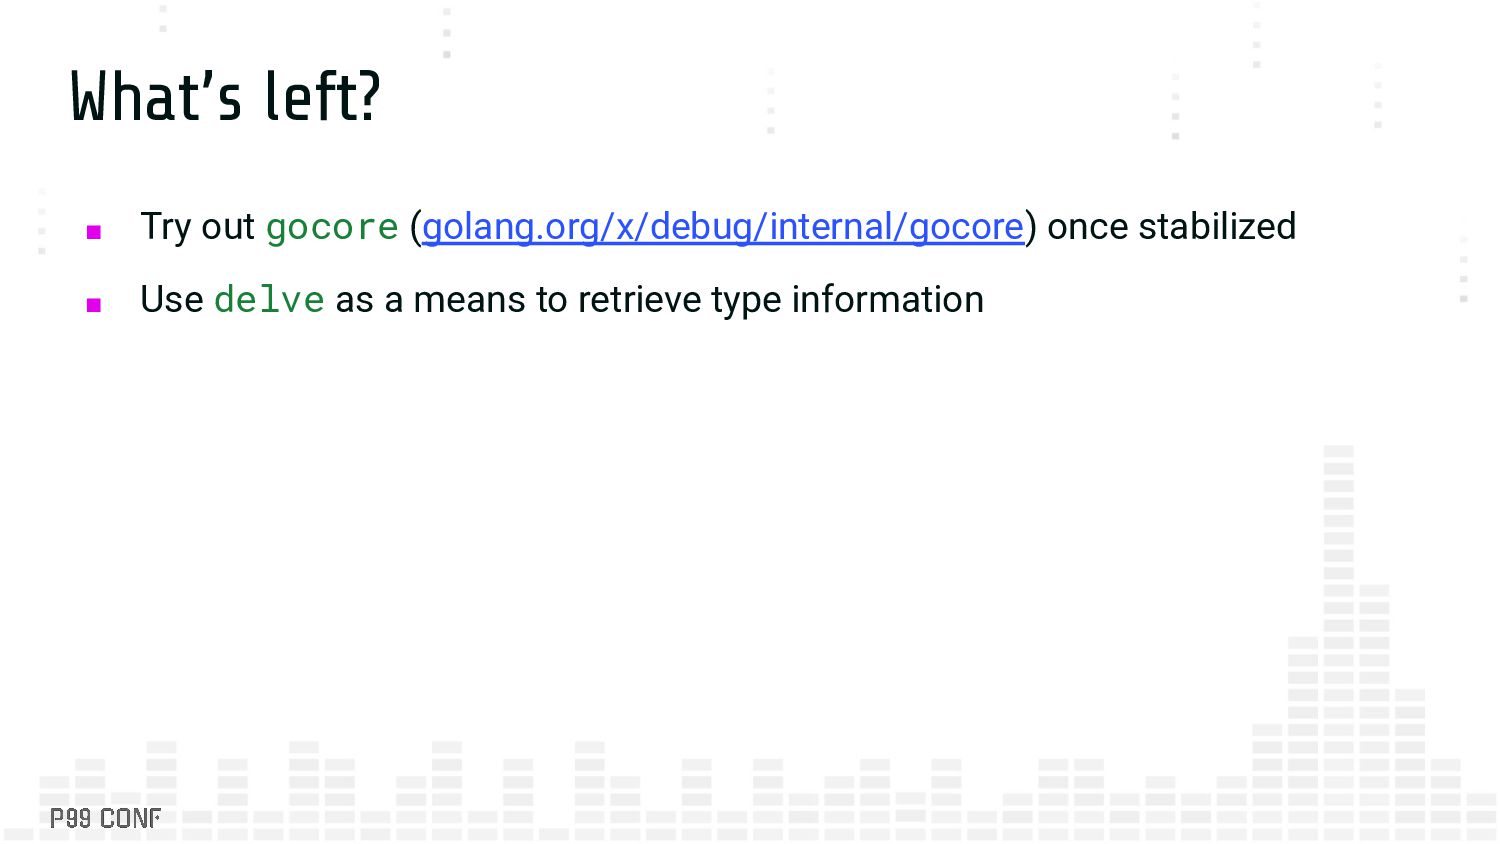
tool for exploring core dumps of a Go process provided under golang.org/x/debug/cmd/viewcore ▪ However, viewcore has a few issues with parsing heap dumps and panics at a few areas (hasn’t been updated for the Go 1.22 heap layout) ▪ During my experimentation, viewcore broke at a lot of places ▪ The Go team is working on fixing these issues; Proposal: #57447
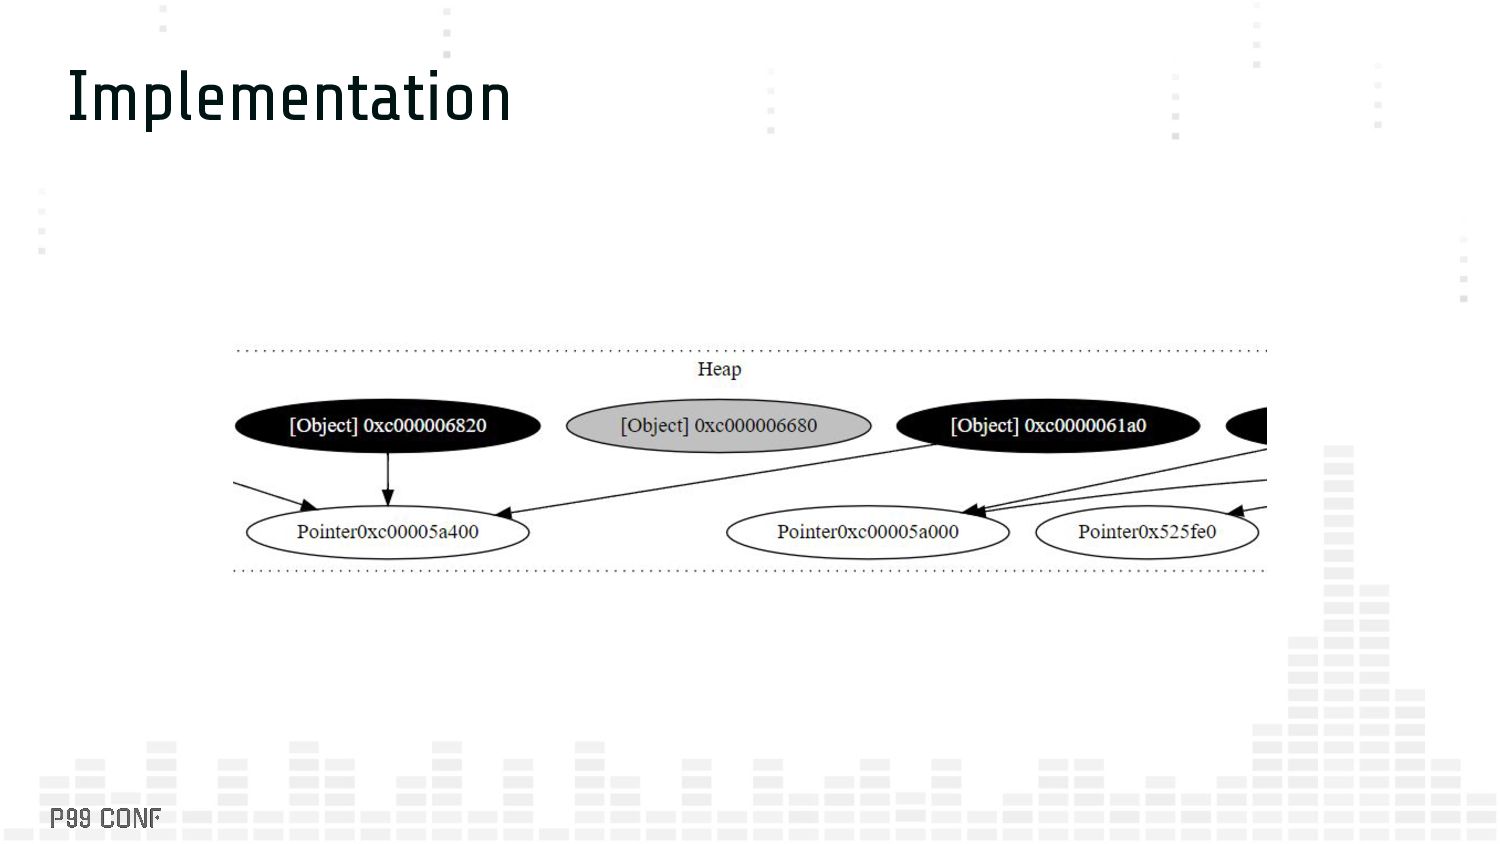
get a heap dump using debug.WriteHeapDump ▪ The heap dump is a sequence of records; Go writes 17 types of records (object, itab, etc.) to the heap dump ▪ A heap dump is useful for extracting “objects” ▪ Possibly the only correct option for this project; a heap dump provides a view into the program’s memory at a point in time
moves a high velocity • Lots of tweaks need to be made to extract information out neatly • I wanted to have the visualization happen on normal Go installations too
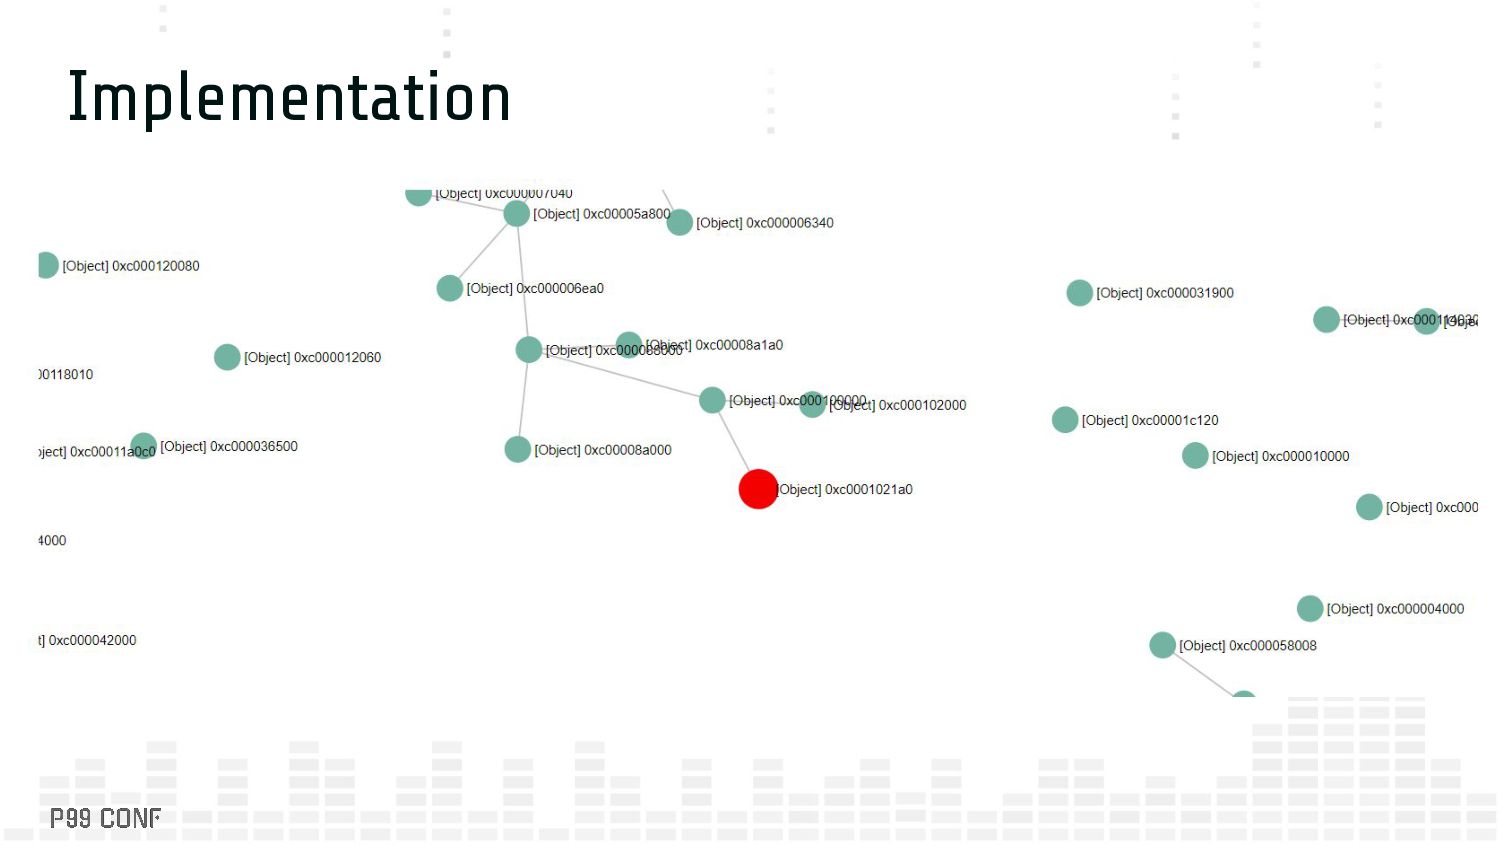
the heap dump based on the documented format • Wrote a small library for reading Go heap dumps: https://github.com/burntcarrot/heaputil ▪ Generate an object graph by utilizing records parsed from the heap dump ▪ In-progress: Color nodes in the object graph and animate using multiple heap dumps captured at intervals
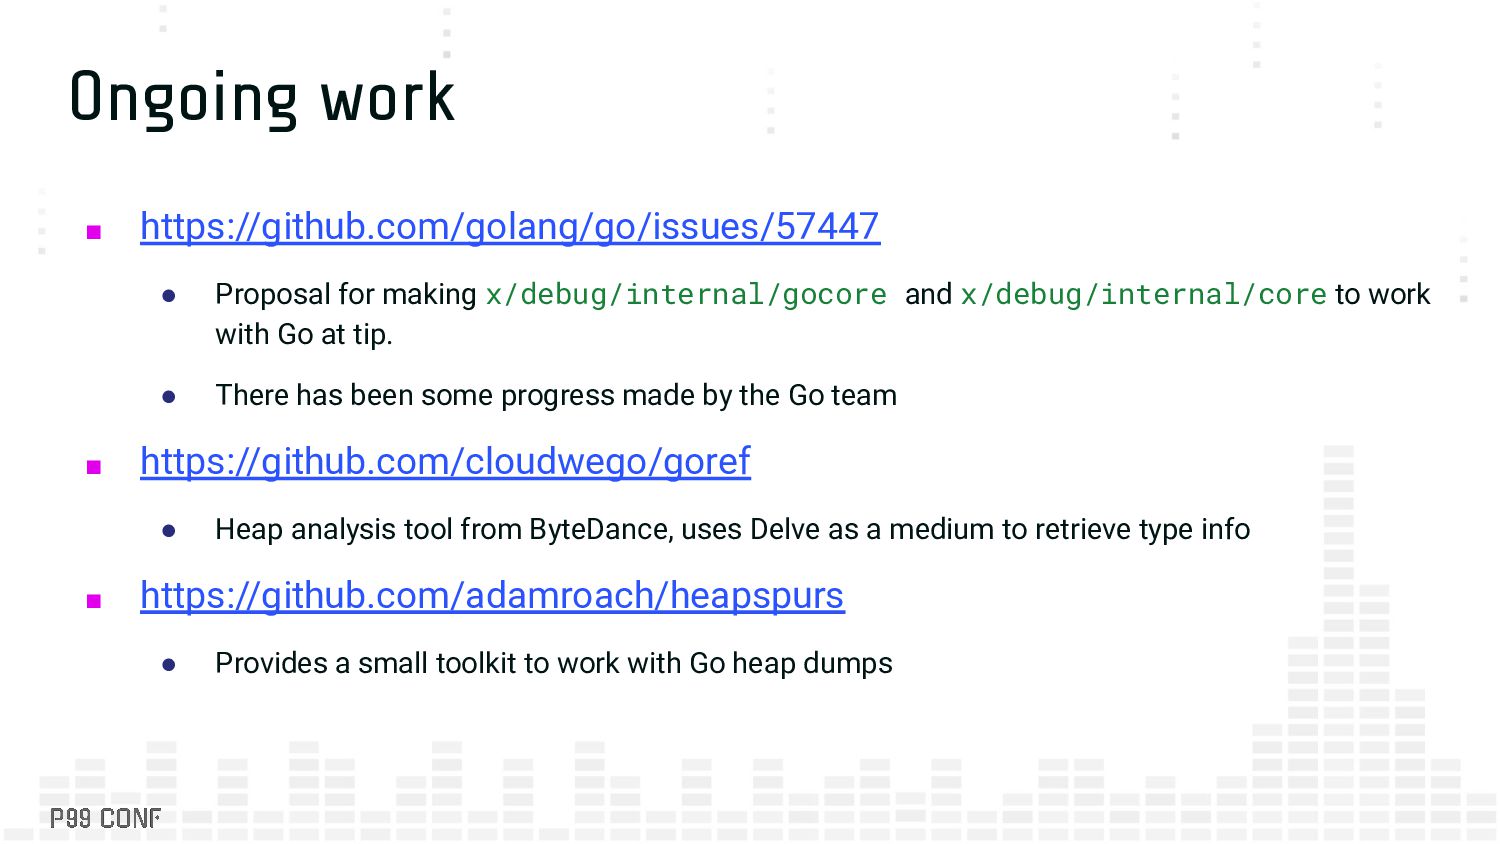
x/debug/internal/core to work with Go at tip. • There has been some progress made by the Go team ▪ https://github.com/cloudwego/goref • Heap analysis tool from ByteDance, uses Delve as a medium to retrieve type info ▪ https://github.com/adamroach/heapspurs • Provides a small toolkit to work with Go heap dumps
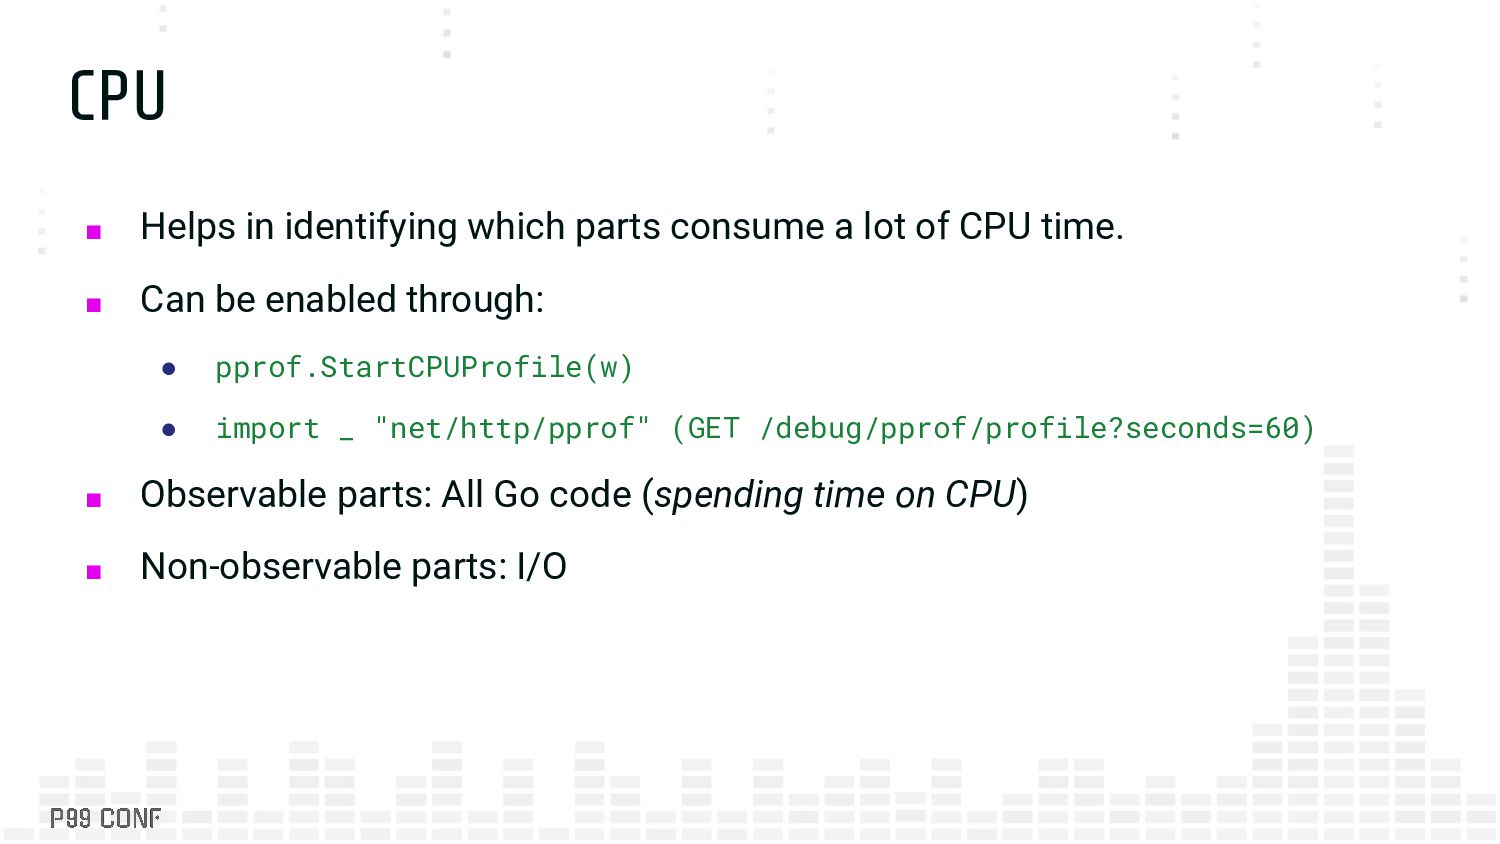
of CPU time. ▪ Can be enabled through: • pprof.StartCPUProfile(w) • import _ "net/http/pprof" (GET /debug/pprof/profile?seconds=60) ▪ Observable parts: All Go code (spending time on CPU) ▪ Non-observable parts: I/O
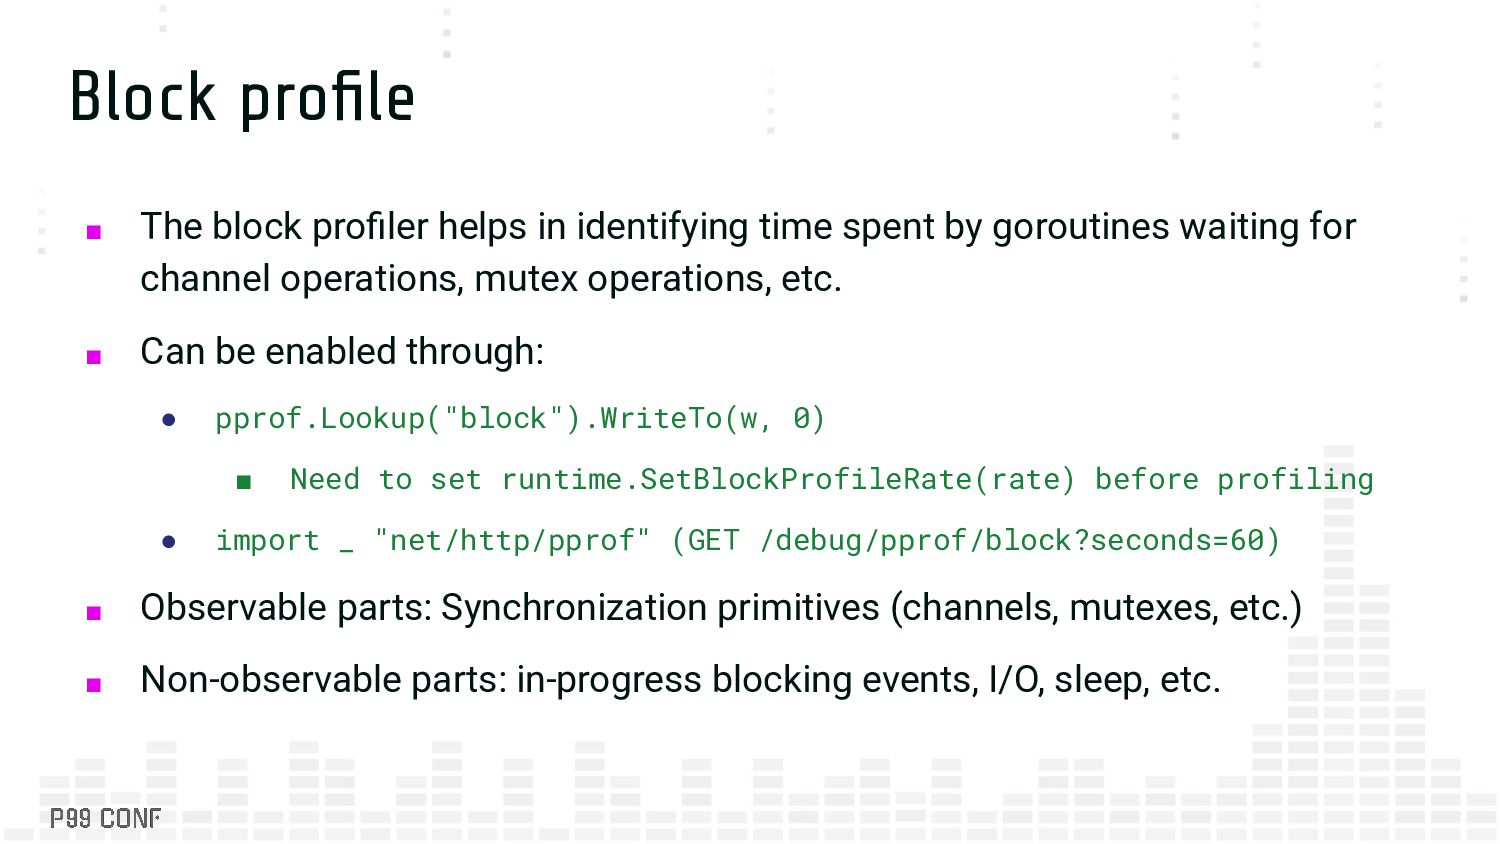
spent by goroutines waiting for channel operations, mutex operations, etc. ▪ Can be enabled through: • pprof.Lookup("block").WriteTo(w, 0) ▪ Need to set runtime.SetBlockProfileRate(rate) before profiling • import _ "net/http/pprof" (GET /debug/pprof/block?seconds=60) ▪ Observable parts: Synchronization primitives (channels, mutexes, etc.) ▪ Non-observable parts: in-progress blocking events, I/O, sleep, etc.
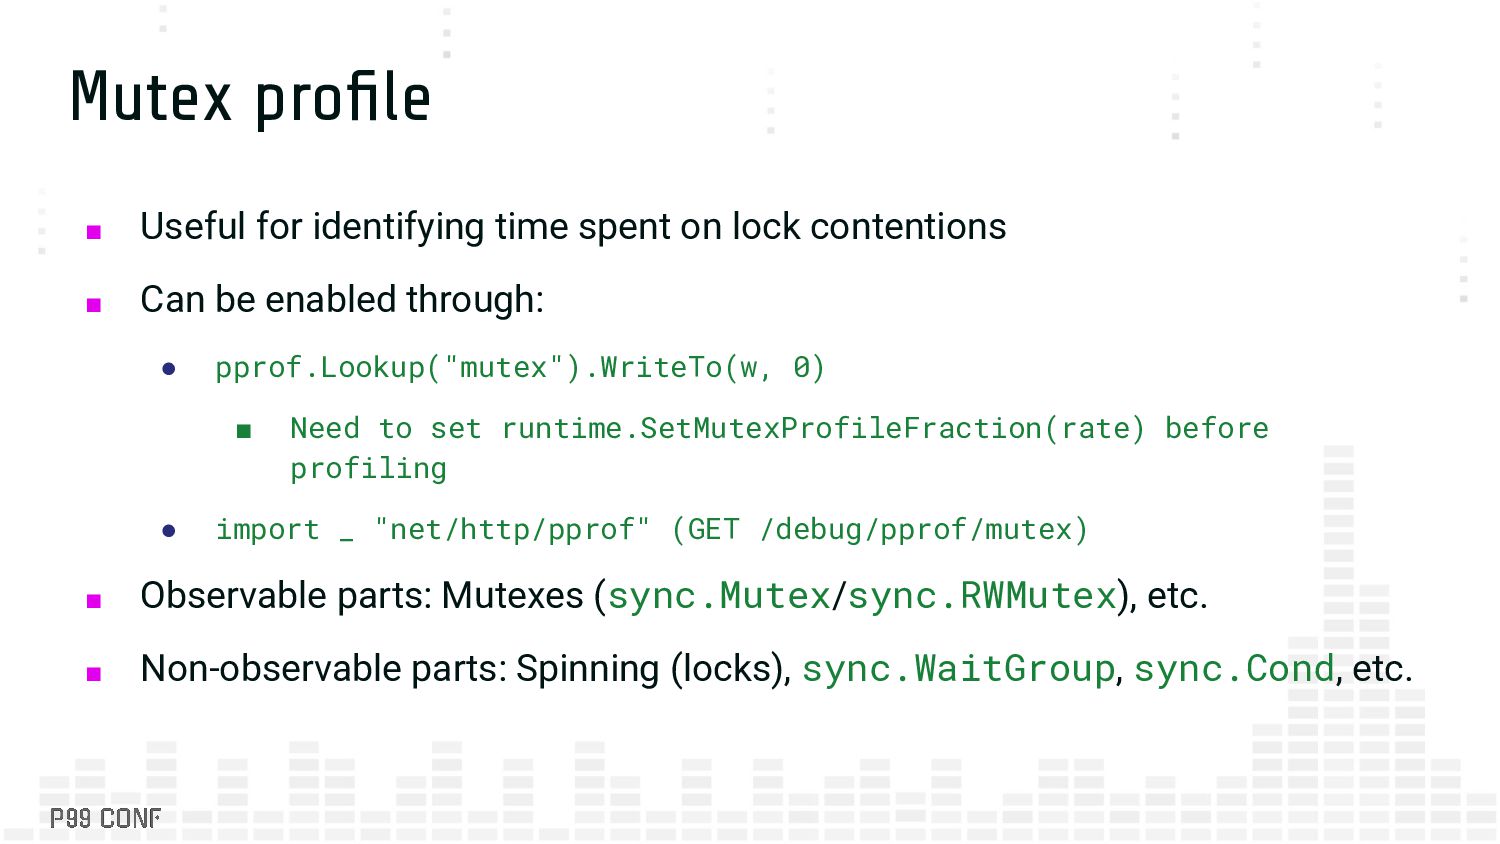
contentions ▪ Can be enabled through: • pprof.Lookup("mutex").WriteTo(w, 0) ▪ Need to set runtime.SetMutexProfileFraction(rate) before profiling • import _ "net/http/pprof" (GET /debug/pprof/mutex) ▪ Observable parts: Mutexes (sync.Mutex/sync.RWMutex), etc. ▪ Non-observable parts: Spinning (locks), sync.WaitGroup, sync.Cond, etc.
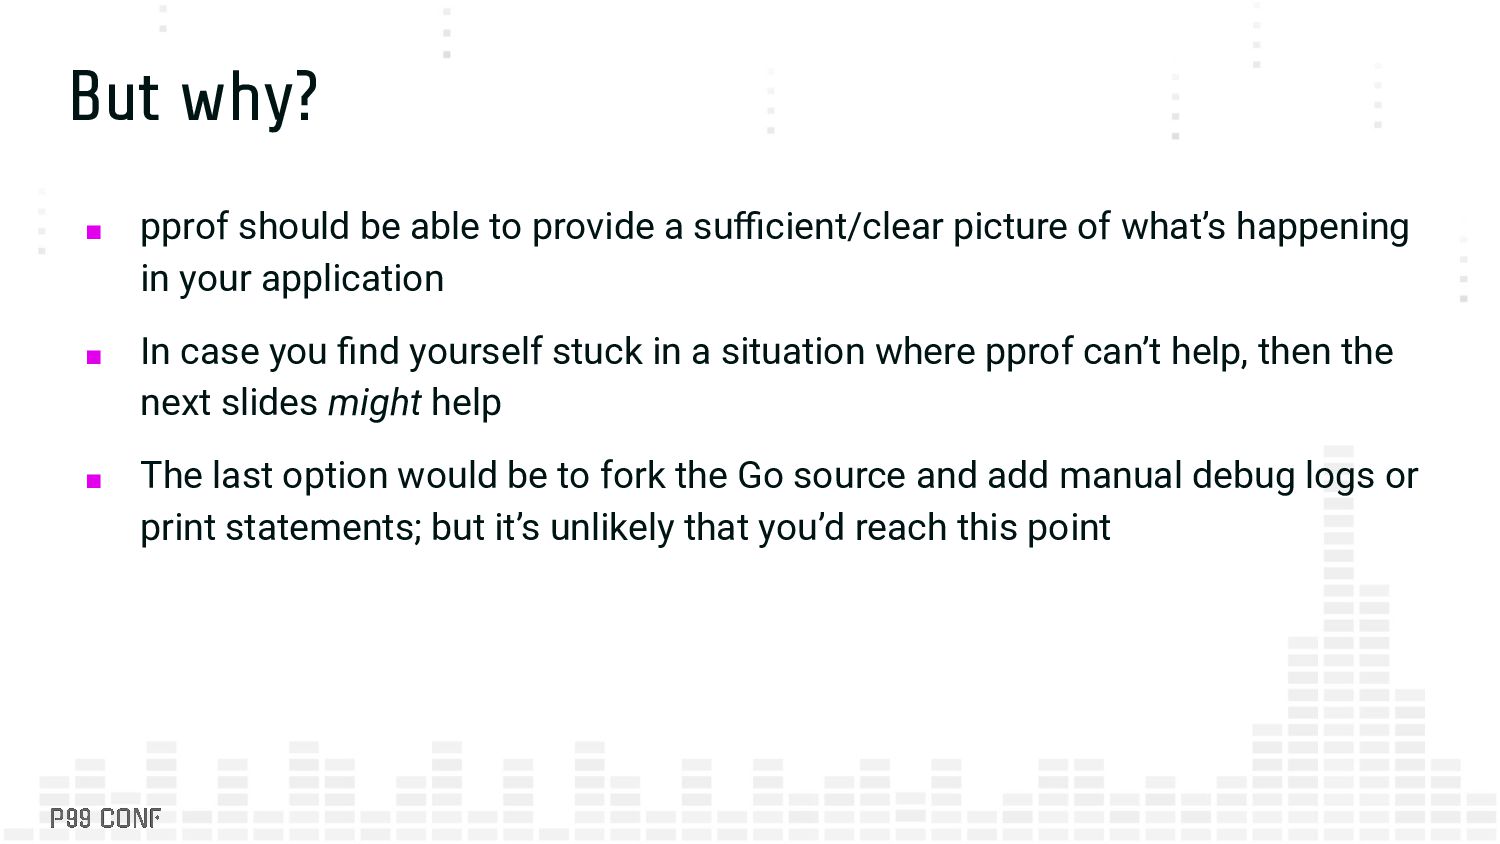
sufficient/clear picture of what’s happening in your application ▪ In case you find yourself stuck in a situation where pprof can’t help, then the next slides might help ▪ The last option would be to fork the Go source and add manual debug logs or print statements; but it’s unlikely that you’d reach this point
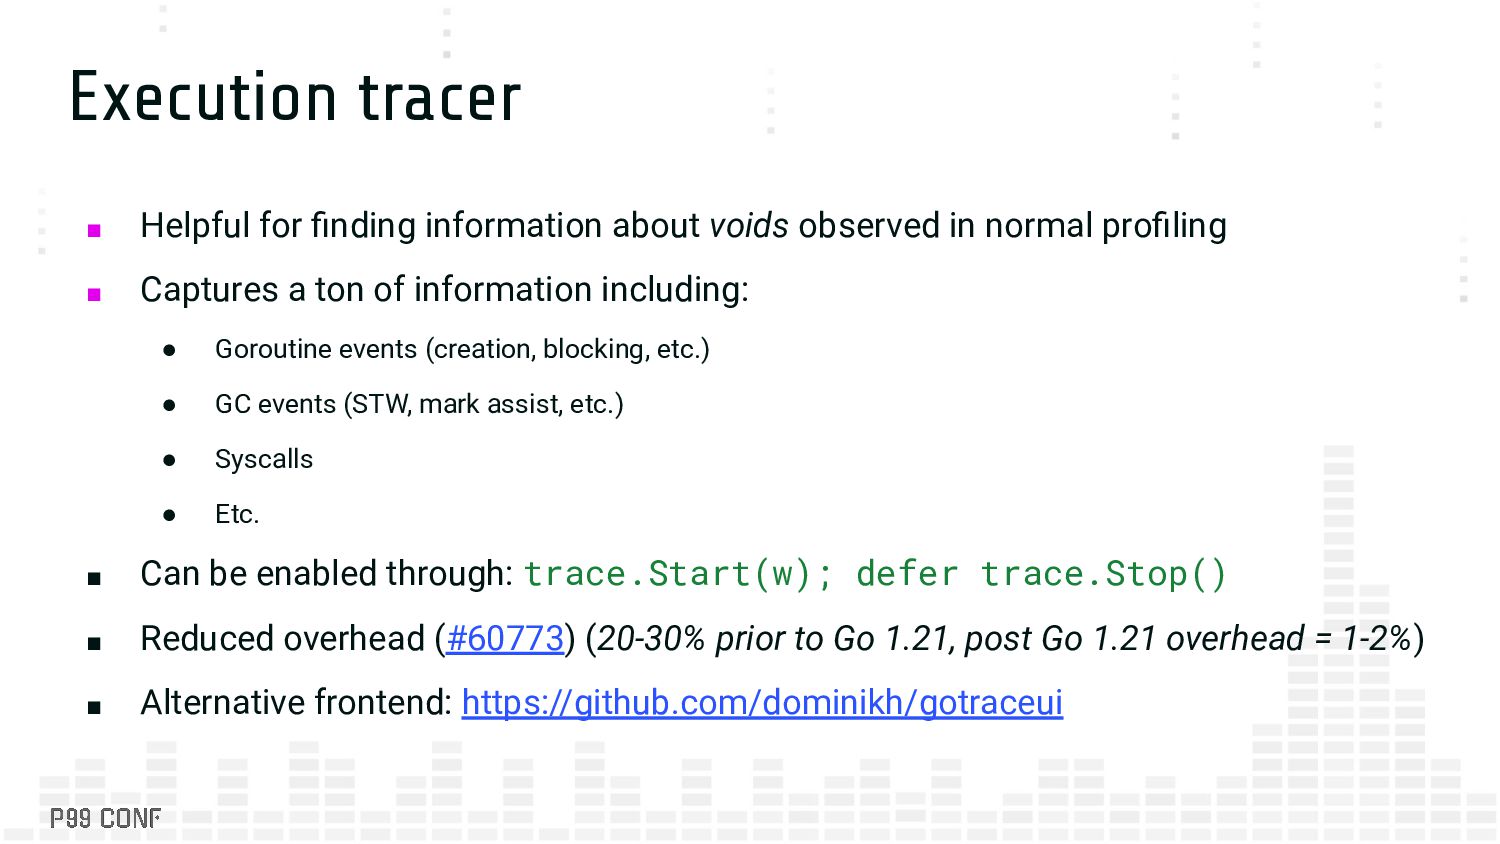
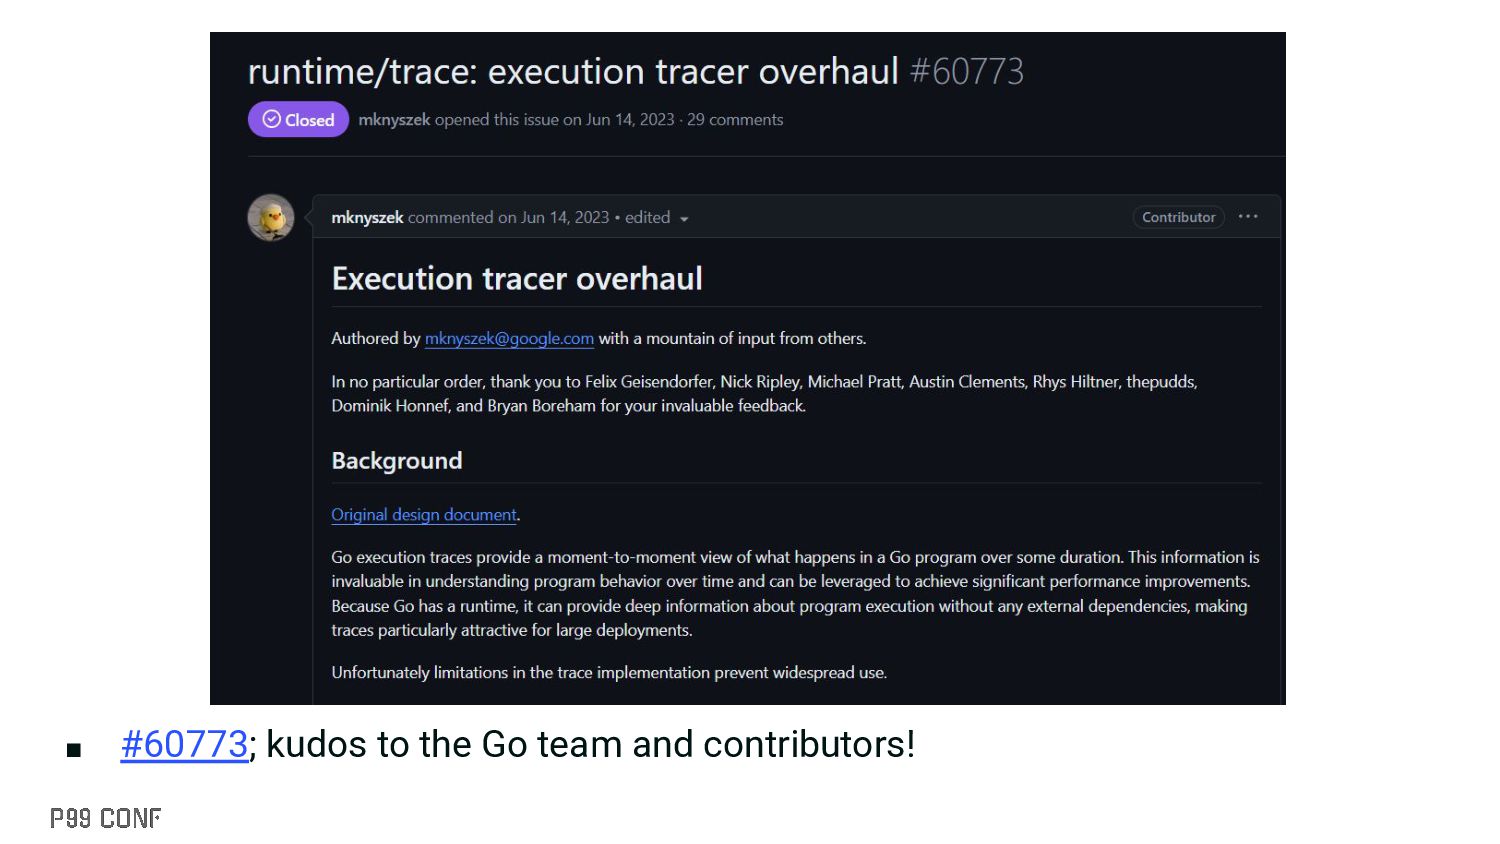
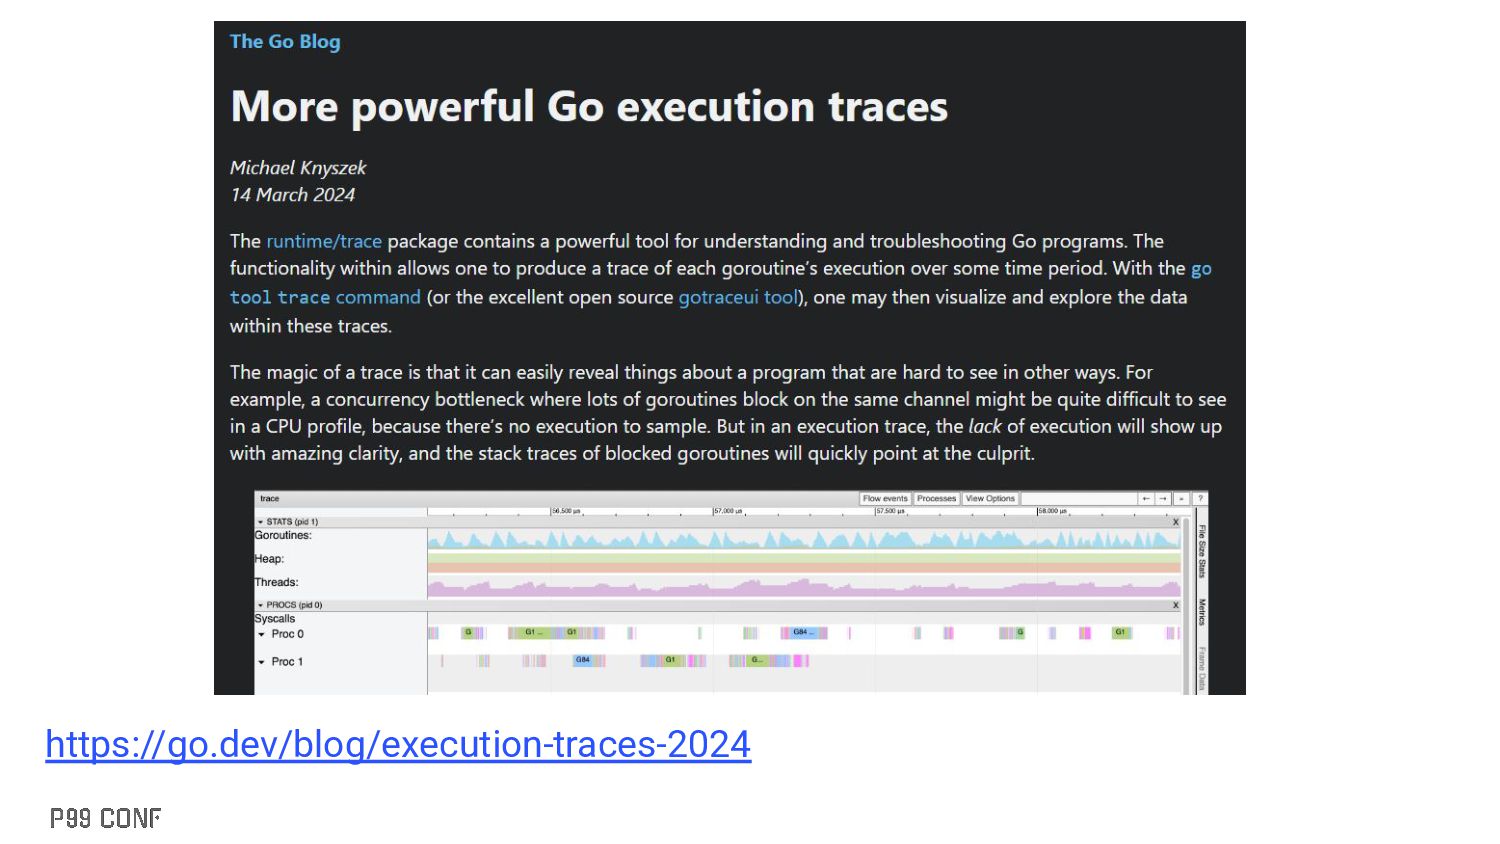
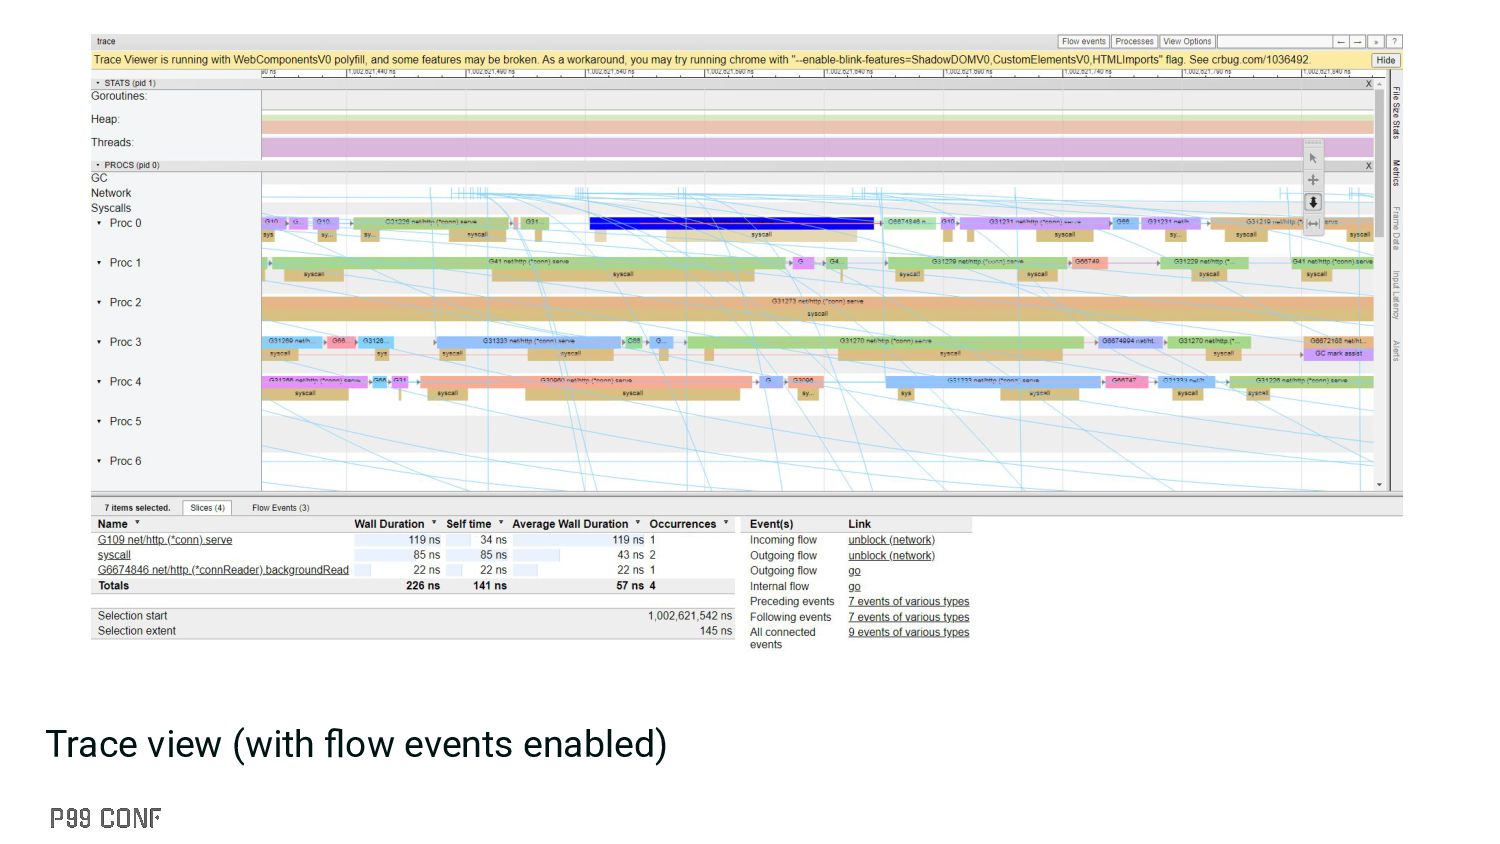
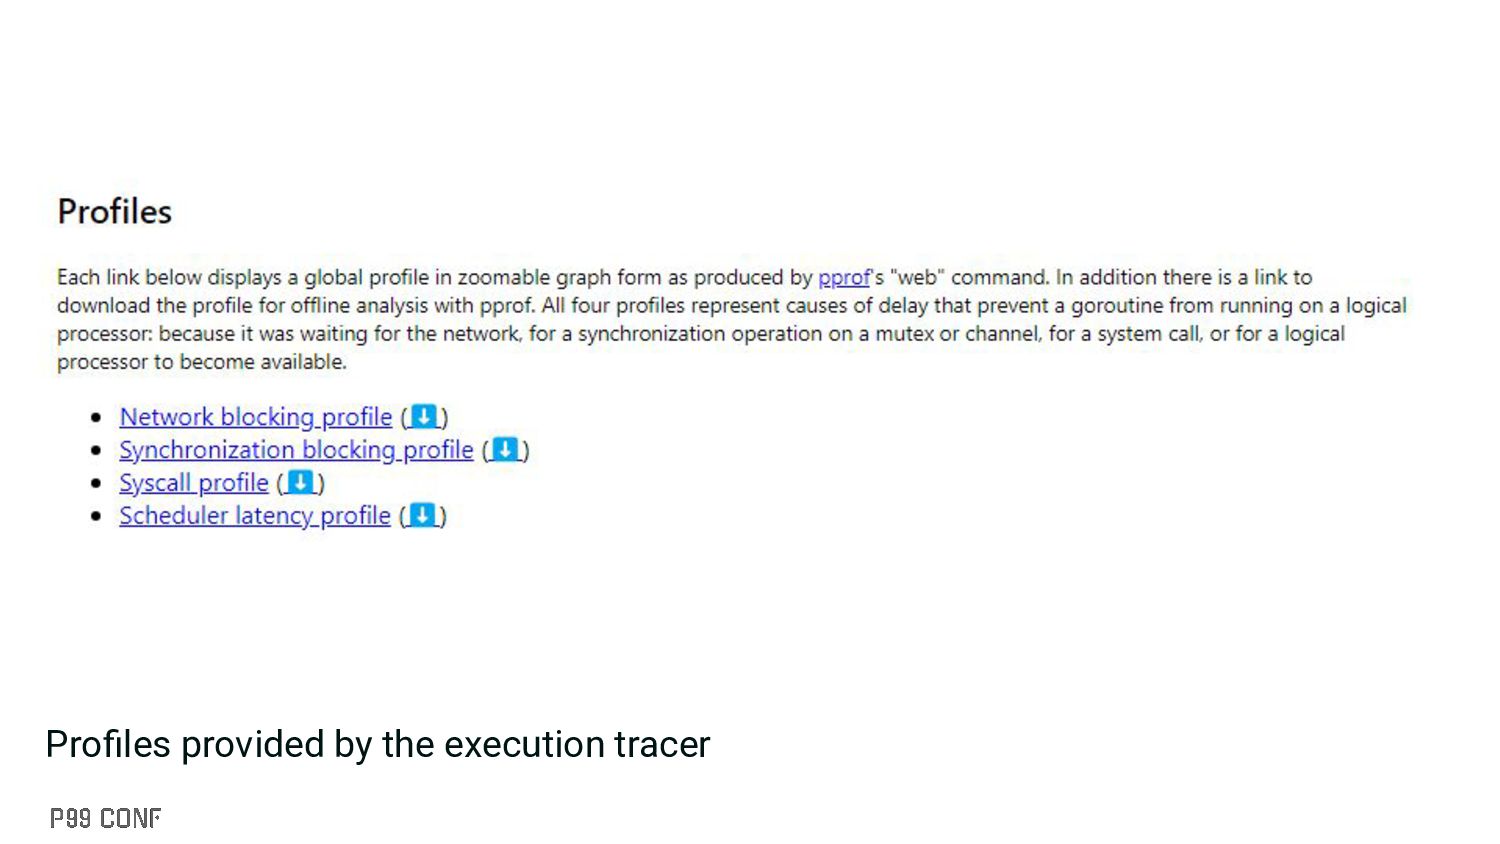
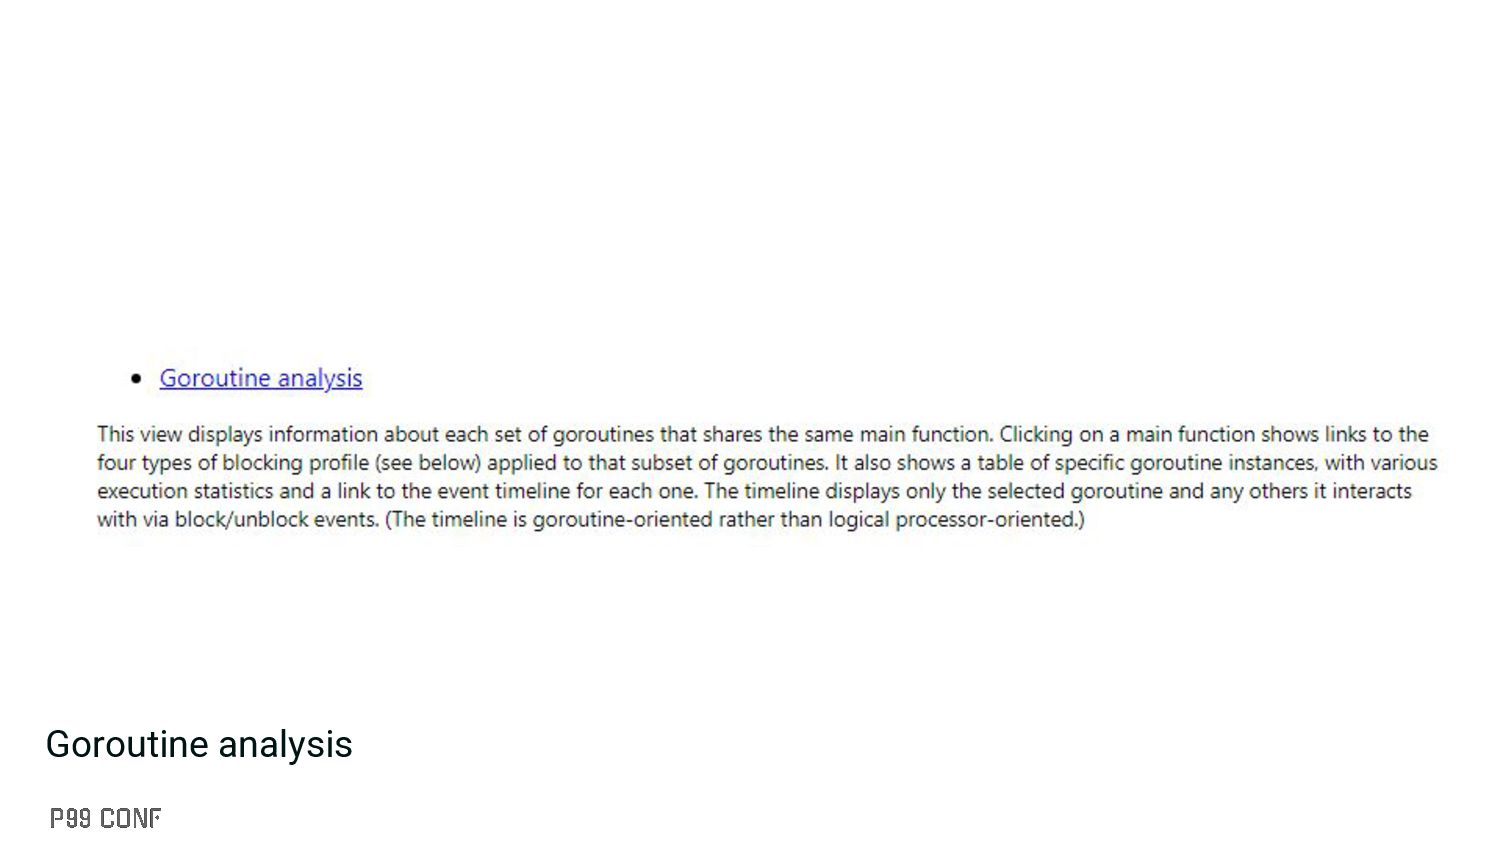
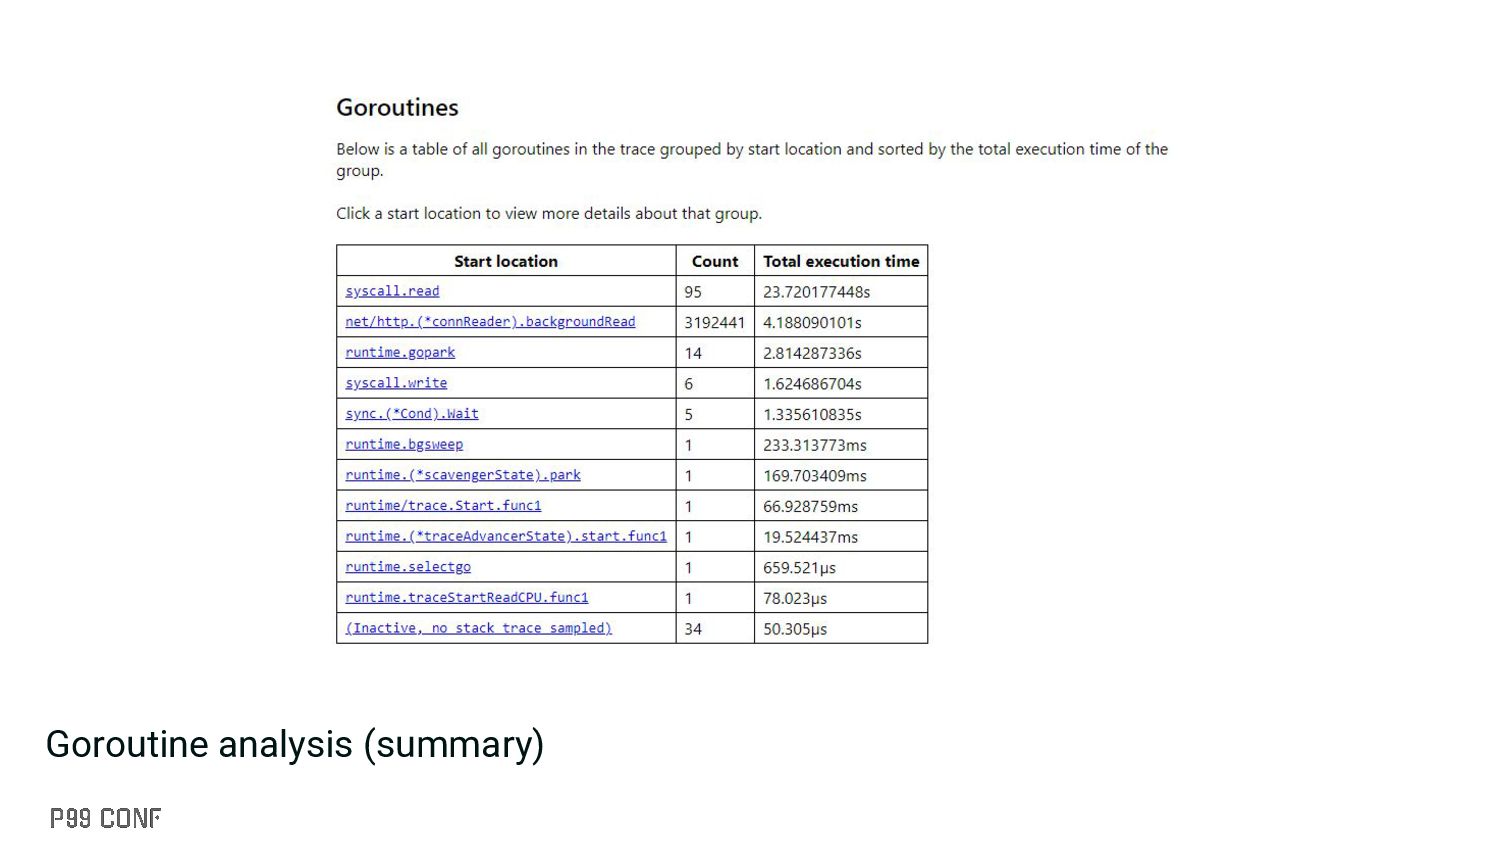
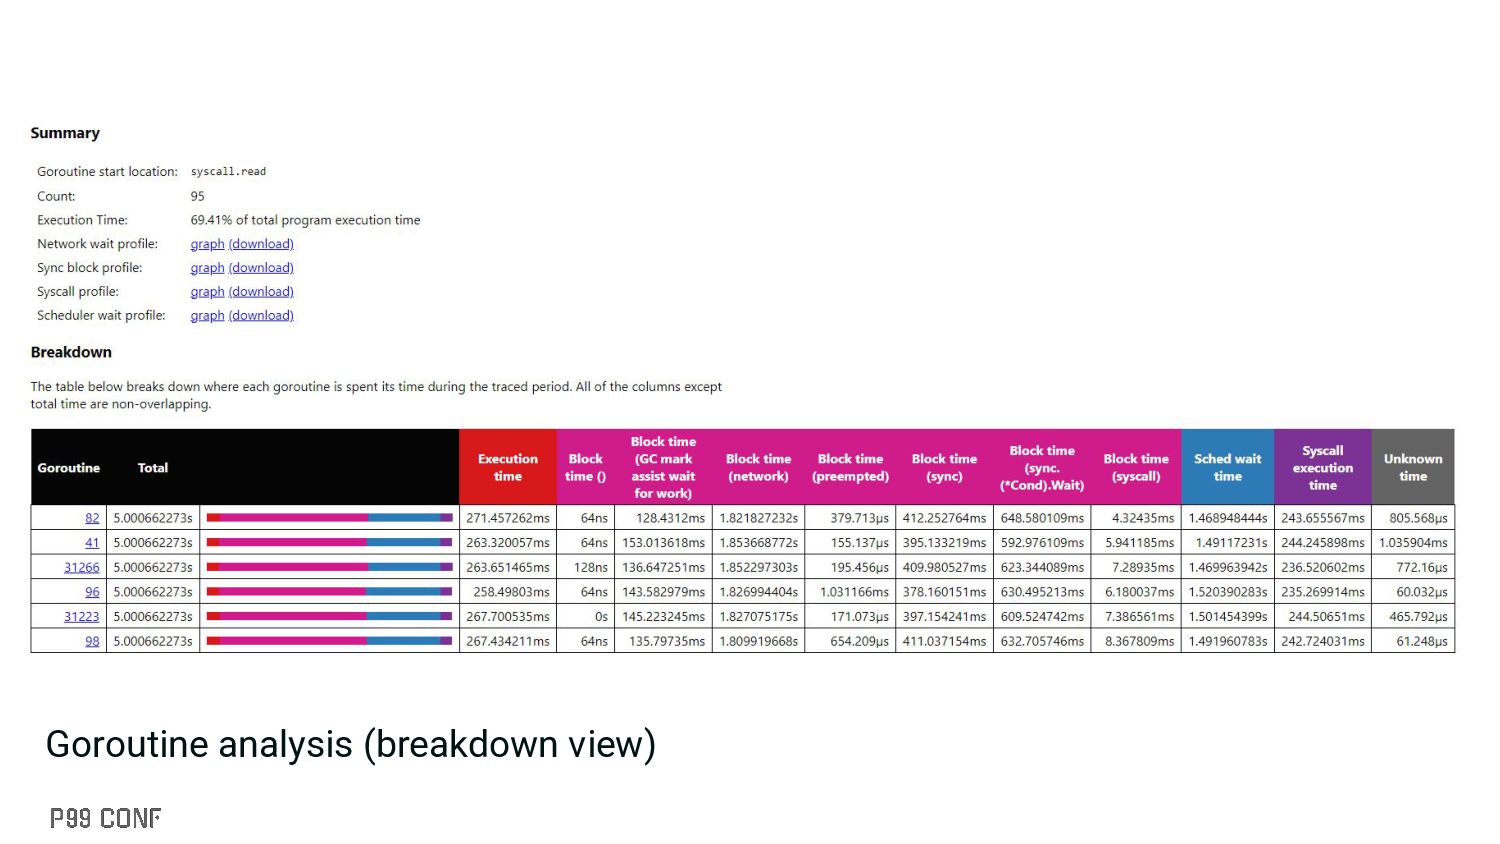
in normal profiling ▪ Captures a ton of information including: • Goroutine events (creation, blocking, etc.) • GC events (STW, mark assist, etc.) • Syscalls • Etc. ▪ Can be enabled through: trace.Start(w); defer trace.Stop() ▪ Reduced overhead (#60773) (20-30% prior to Go 1.21, post Go 1.21 overhead = 1-2%) ▪ Alternative frontend: https://github.com/dominikh/gotraceui
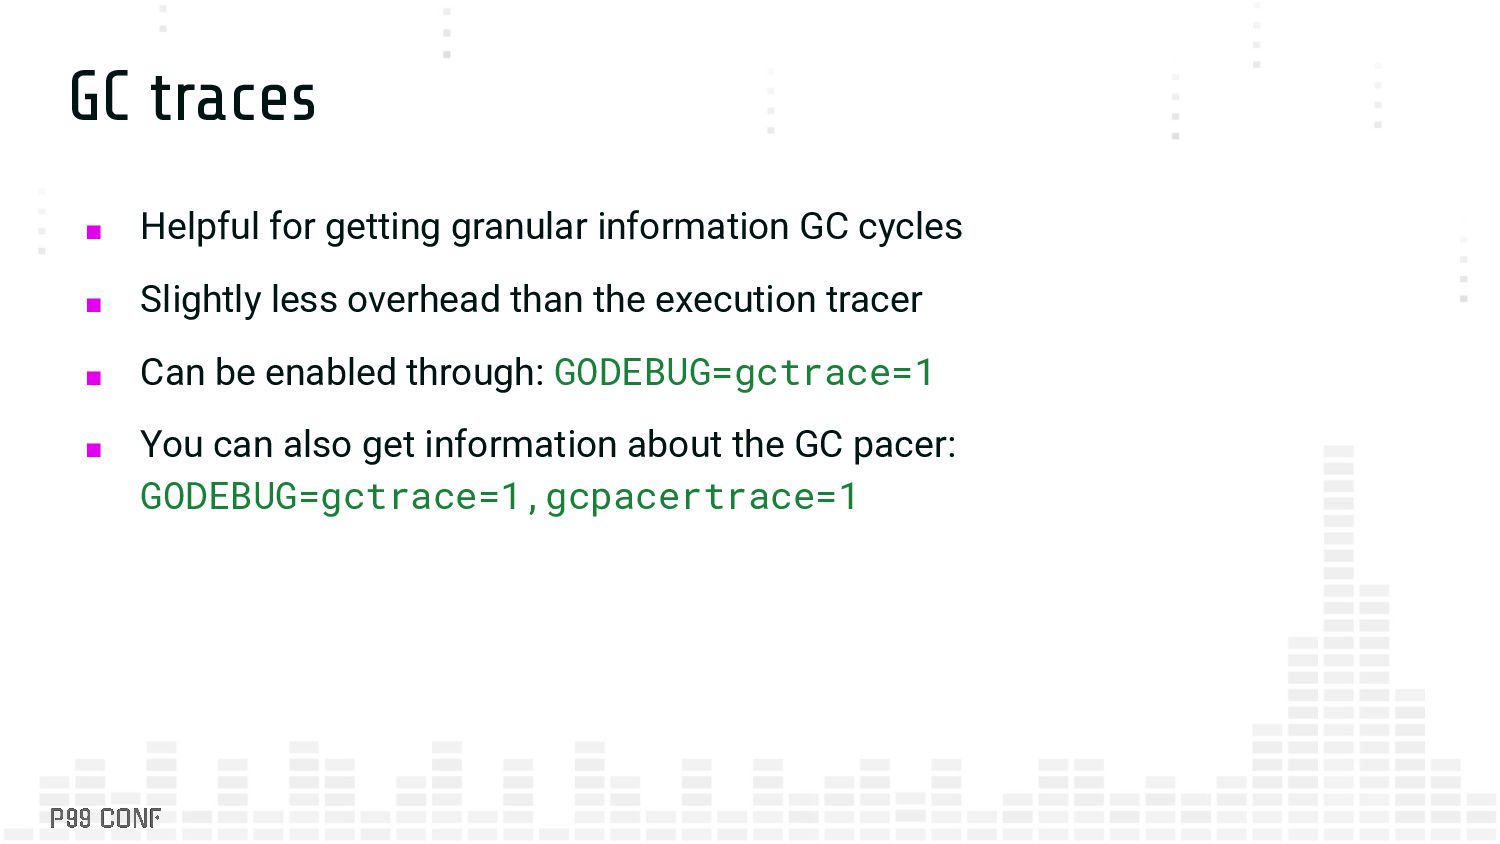
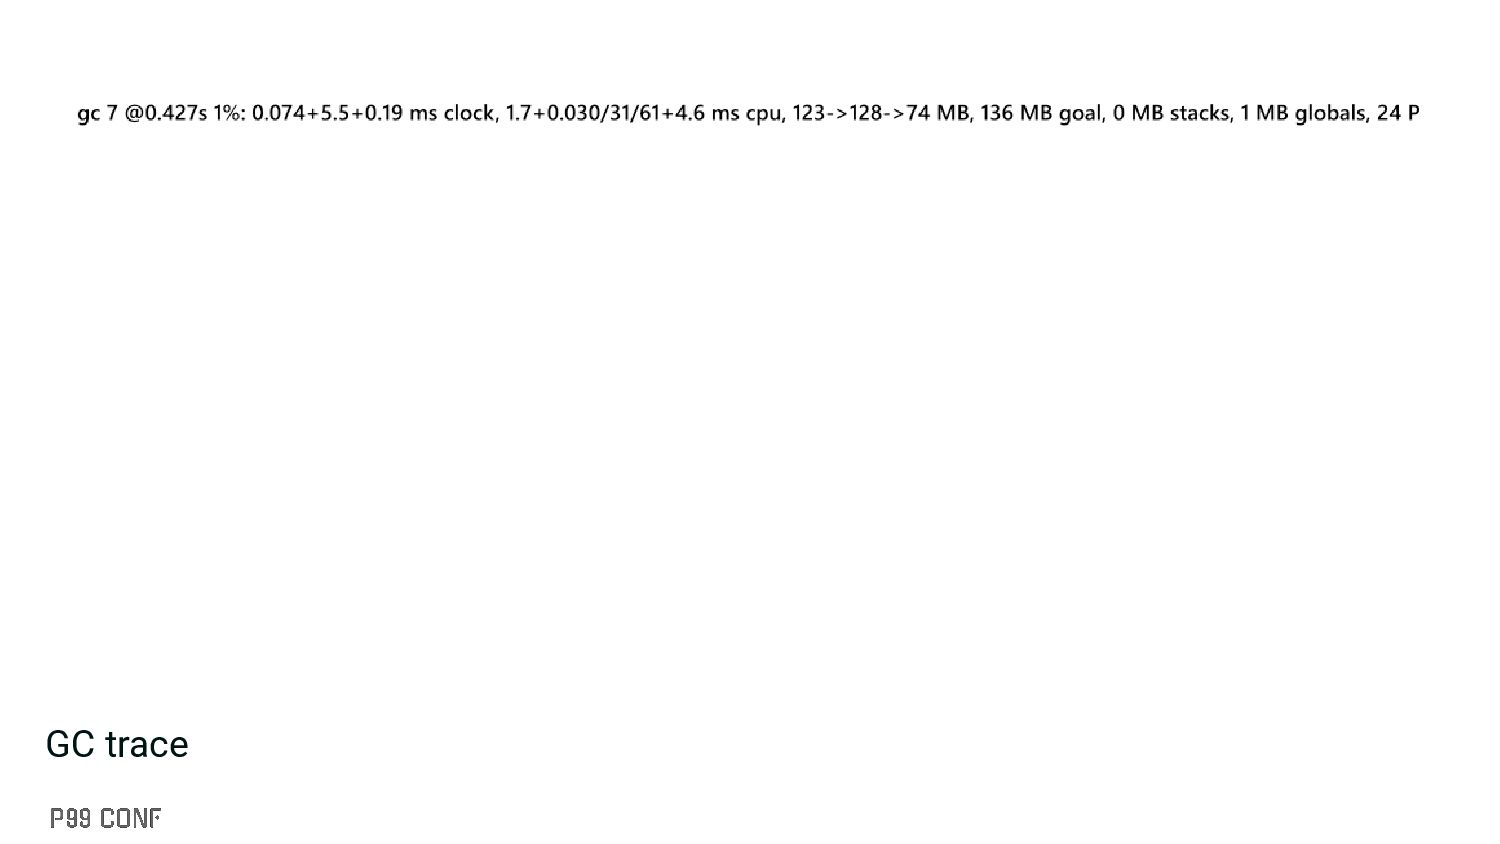
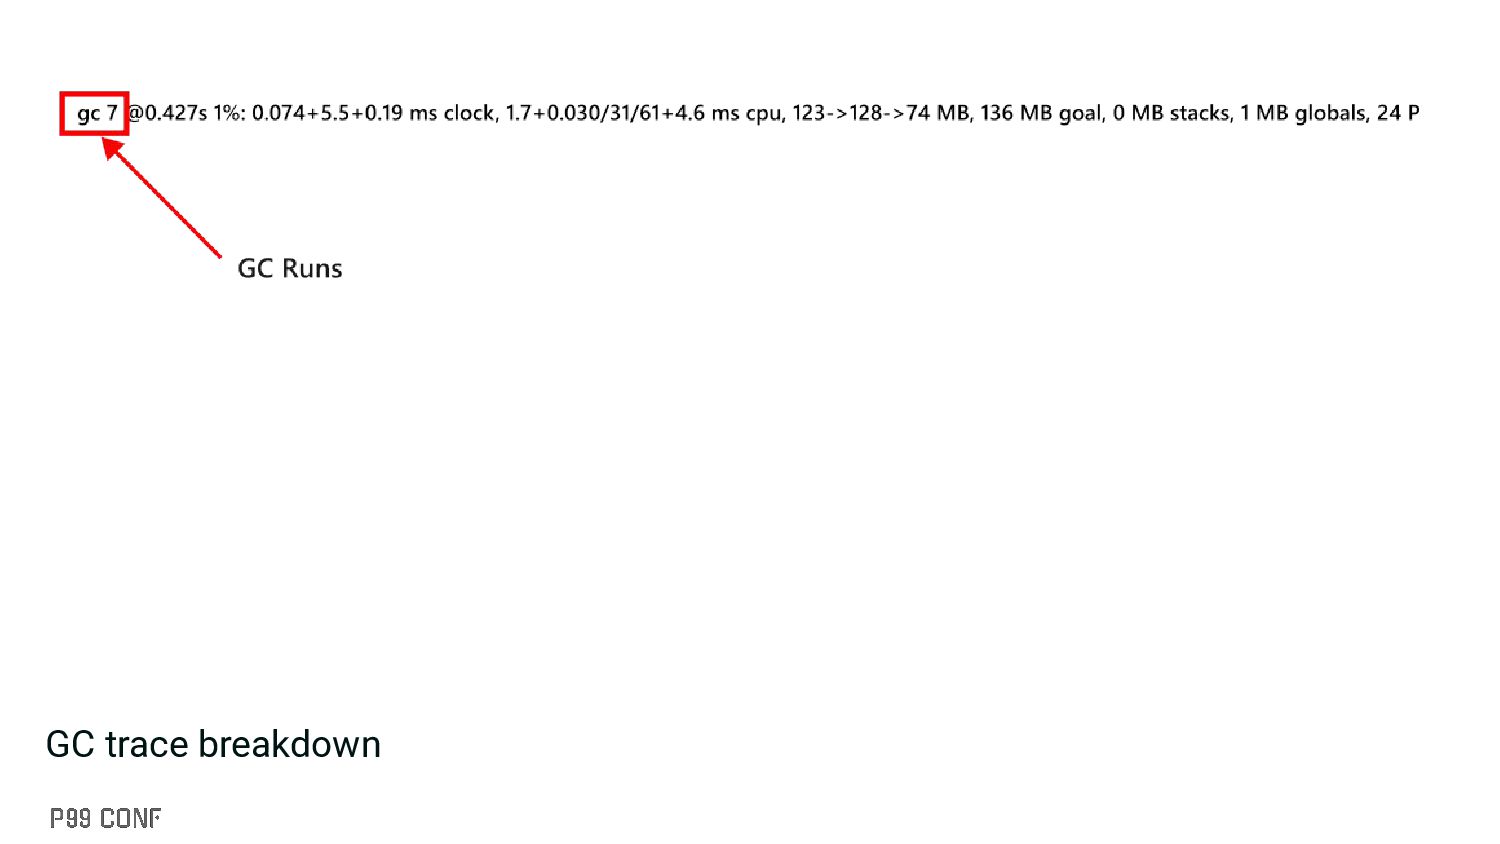
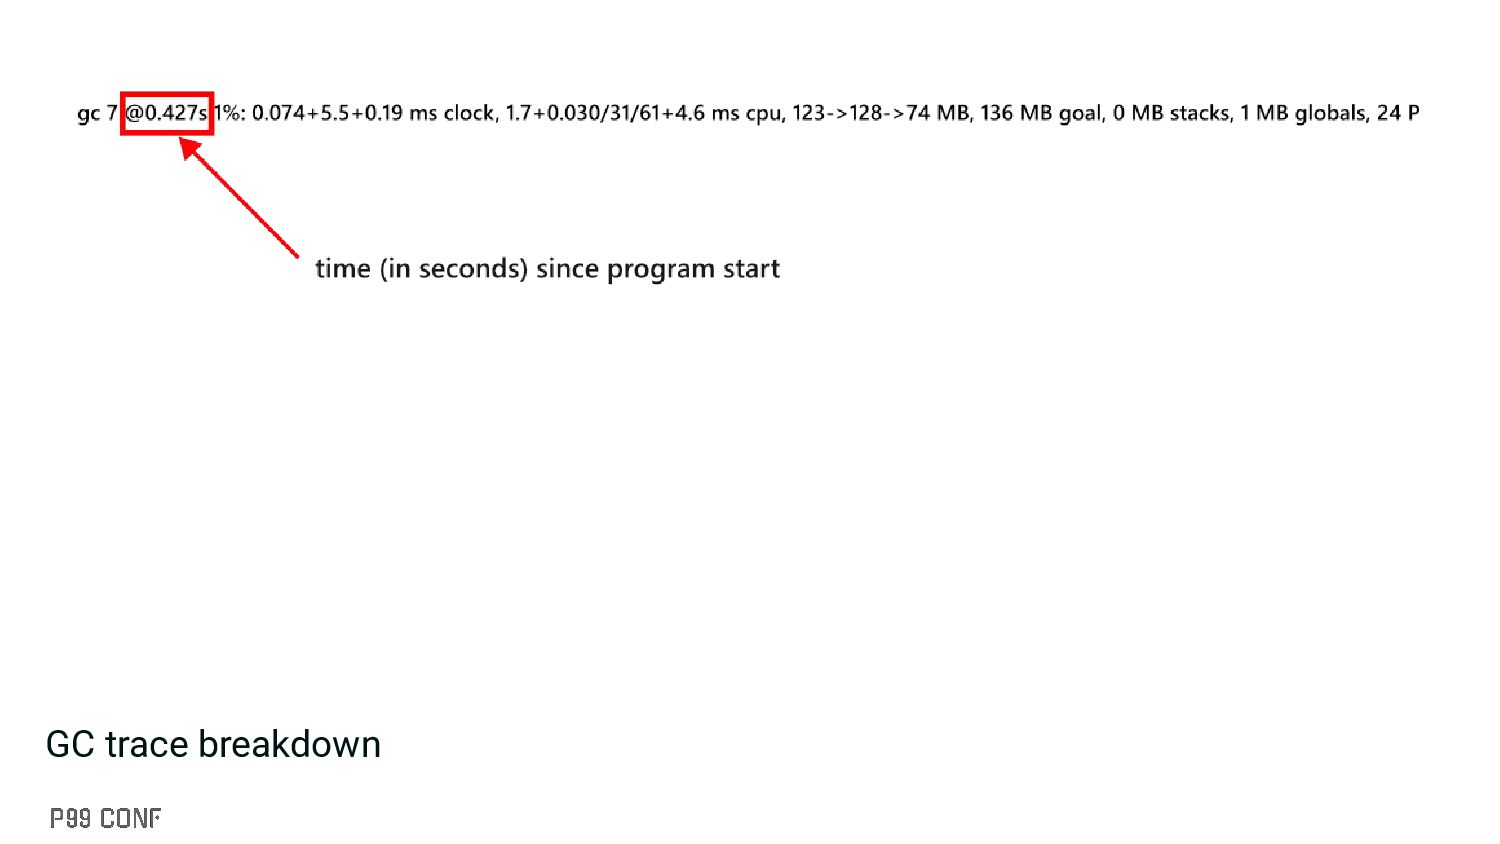
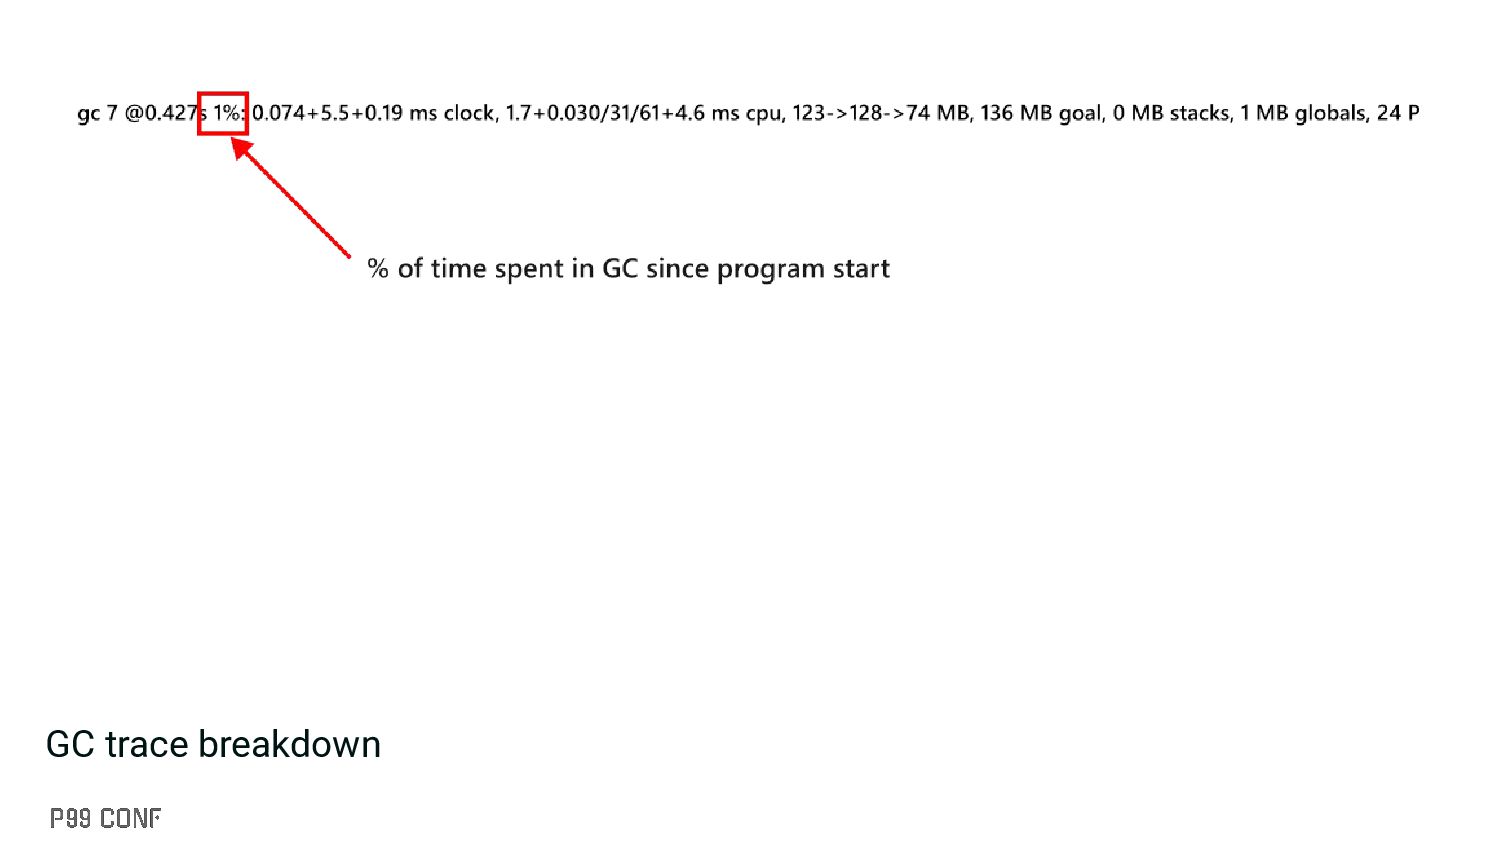
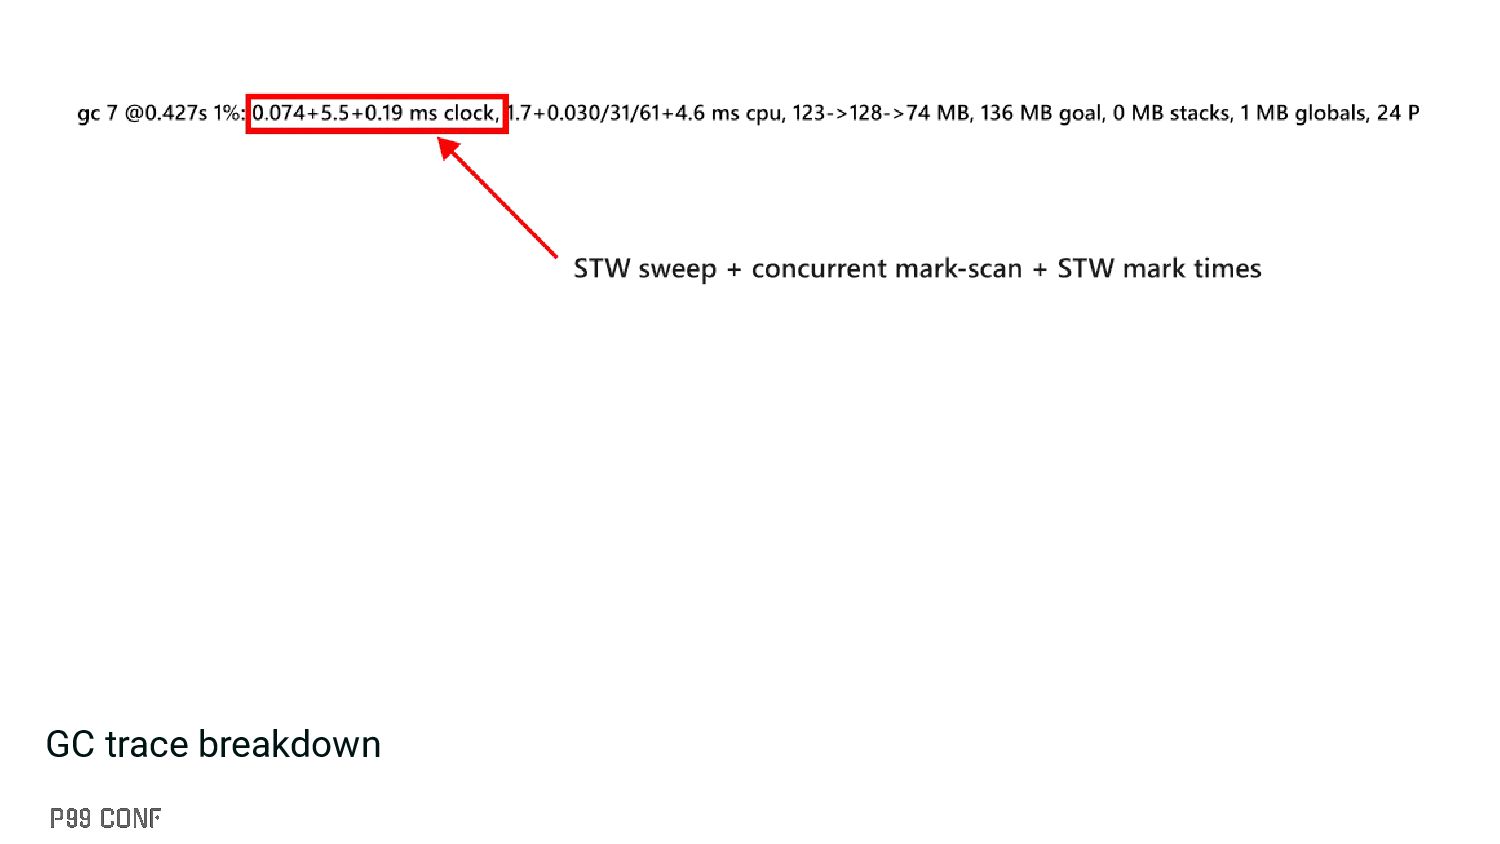
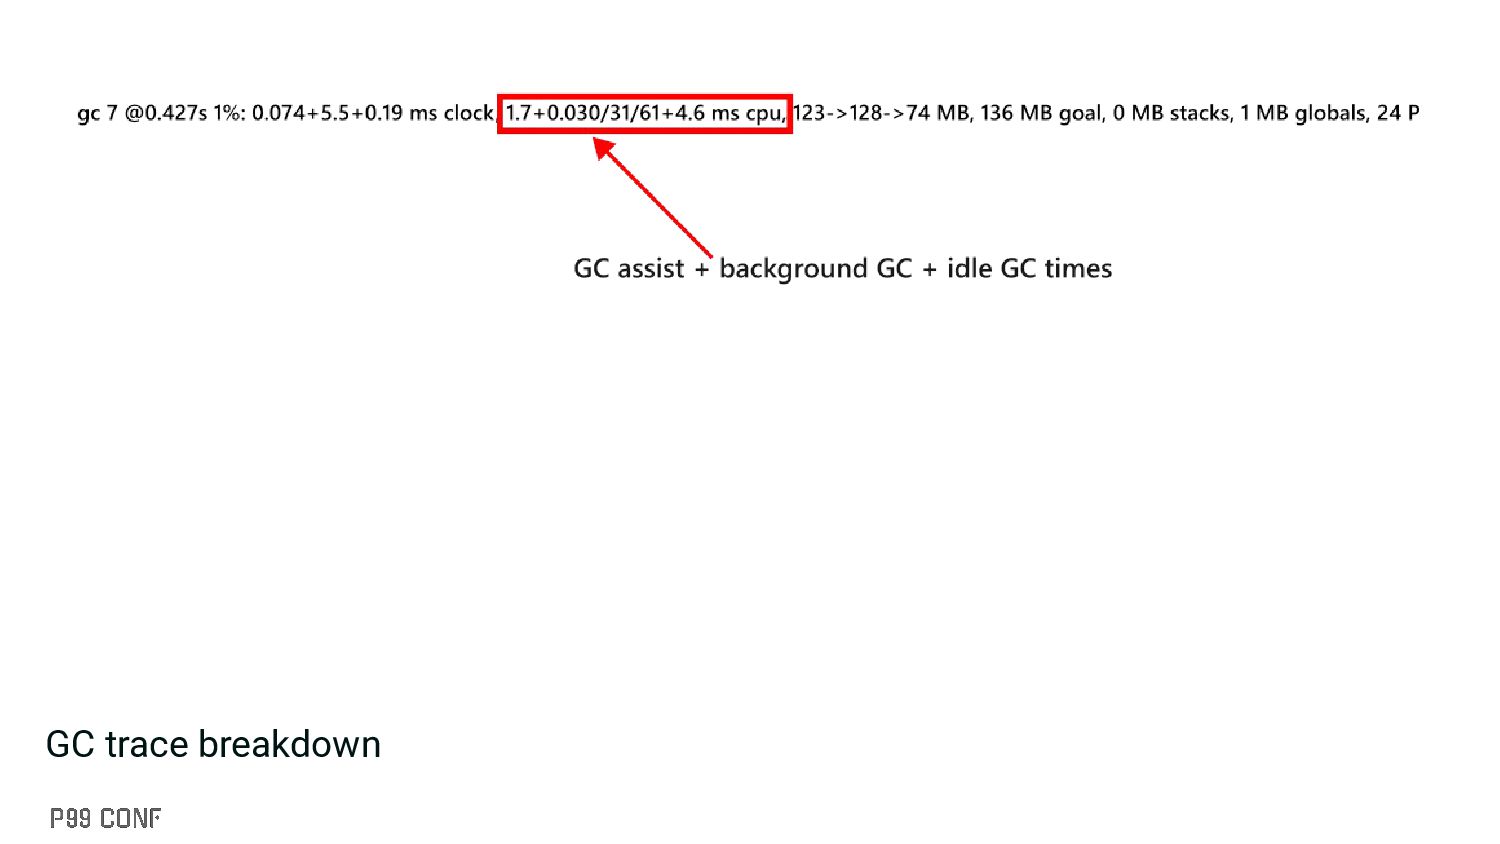
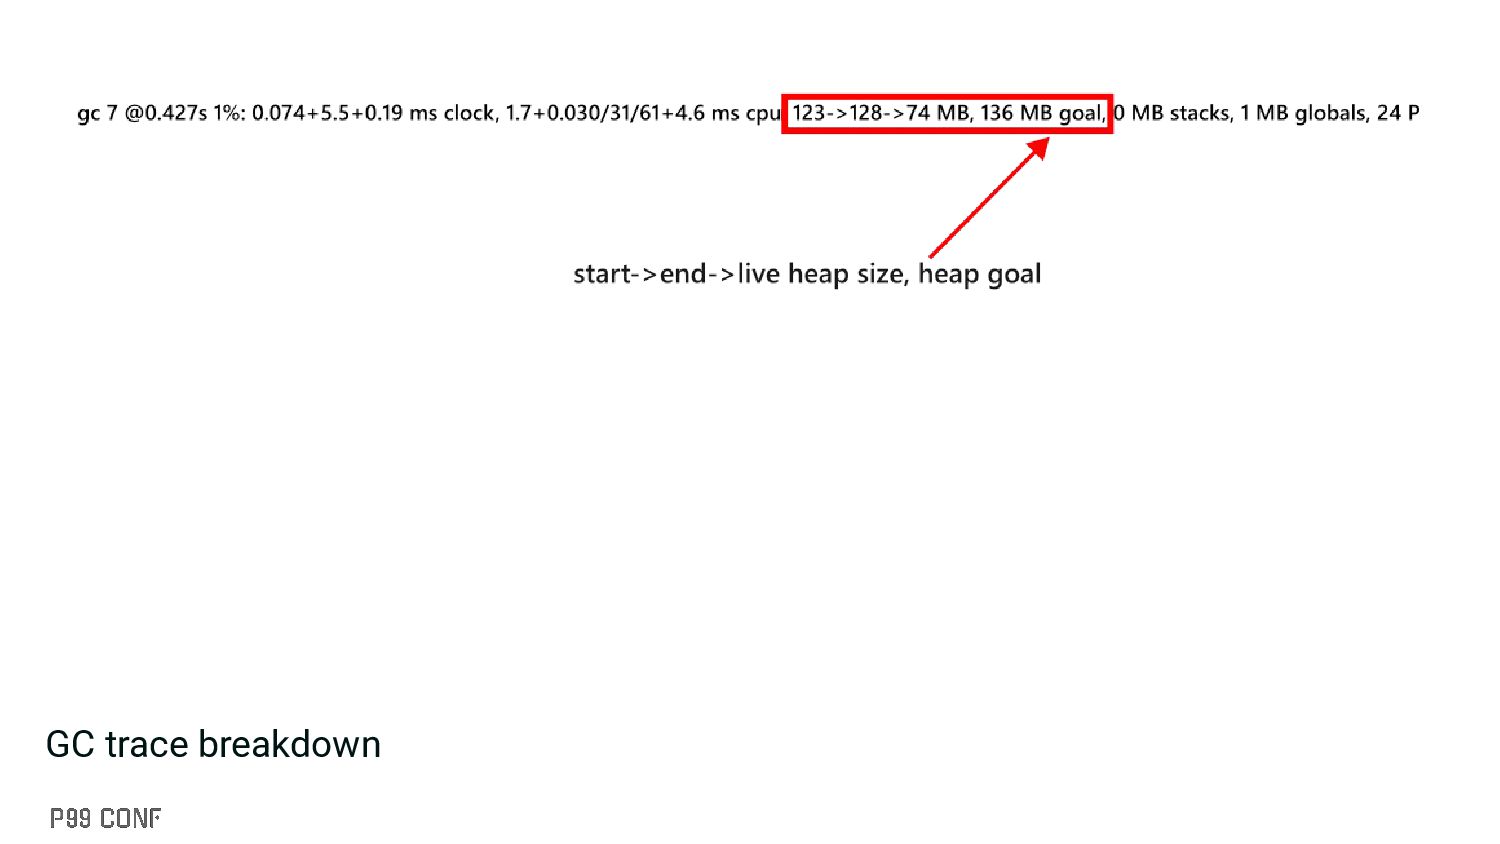
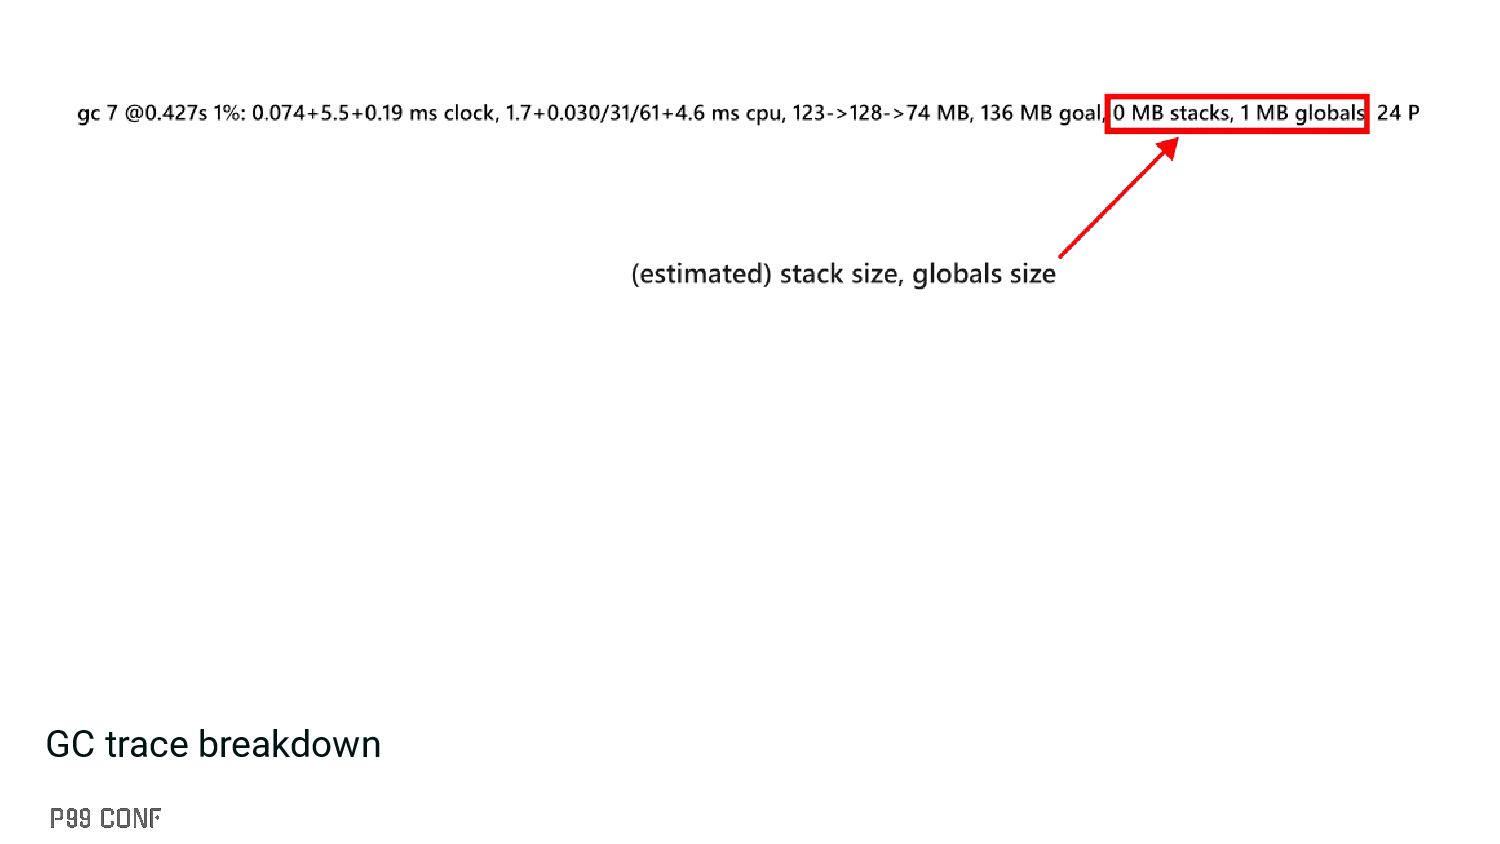
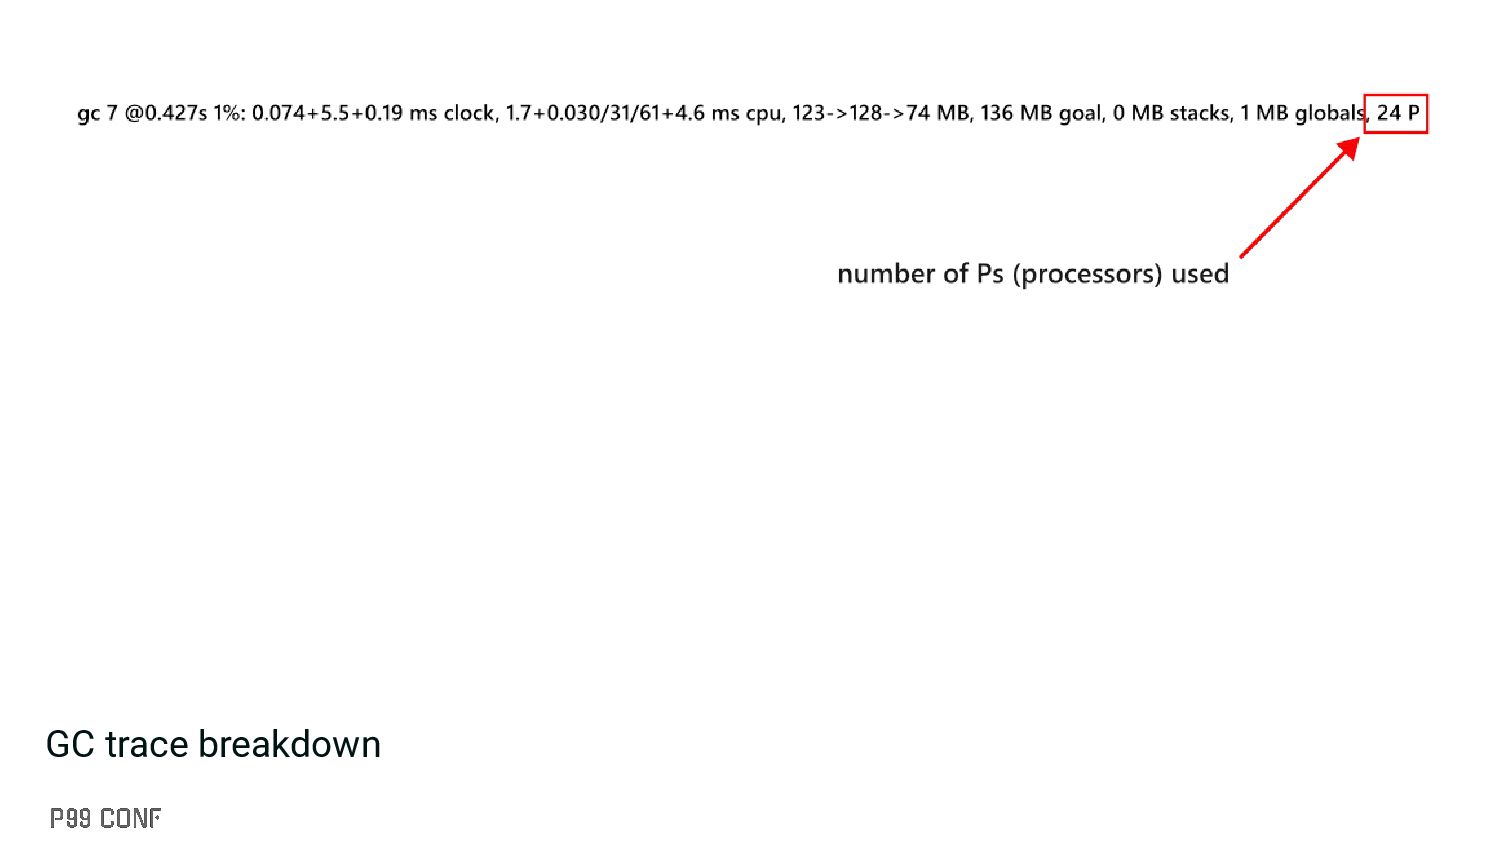
▪ Slightly less overhead than the execution tracer ▪ Can be enabled through: GODEBUG=gctrace=1 ▪ You can also get information about the GC pacer: GODEBUG=gctrace=1,gcpacertrace=1
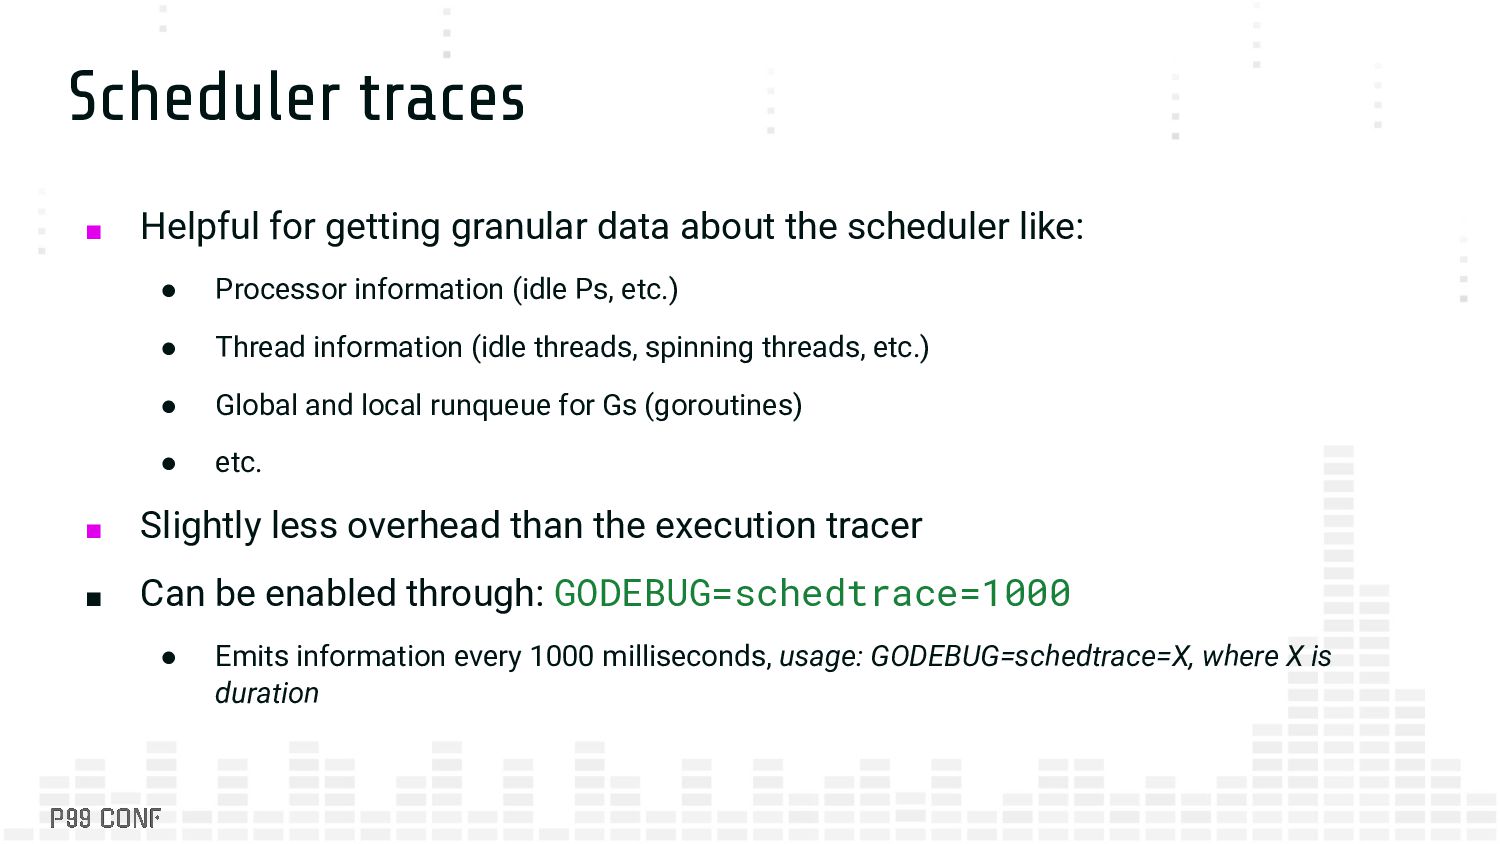
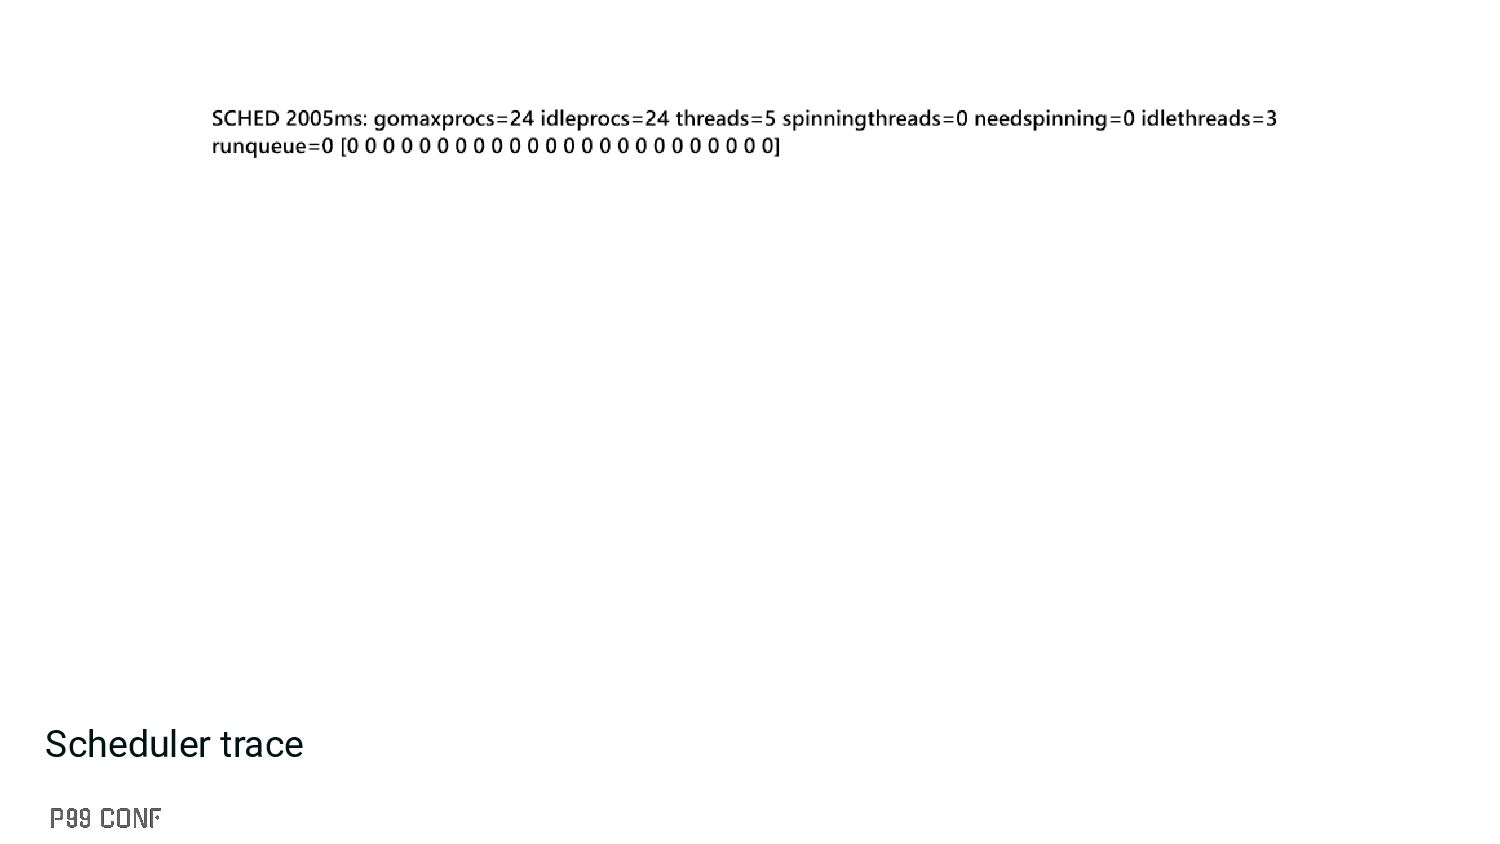
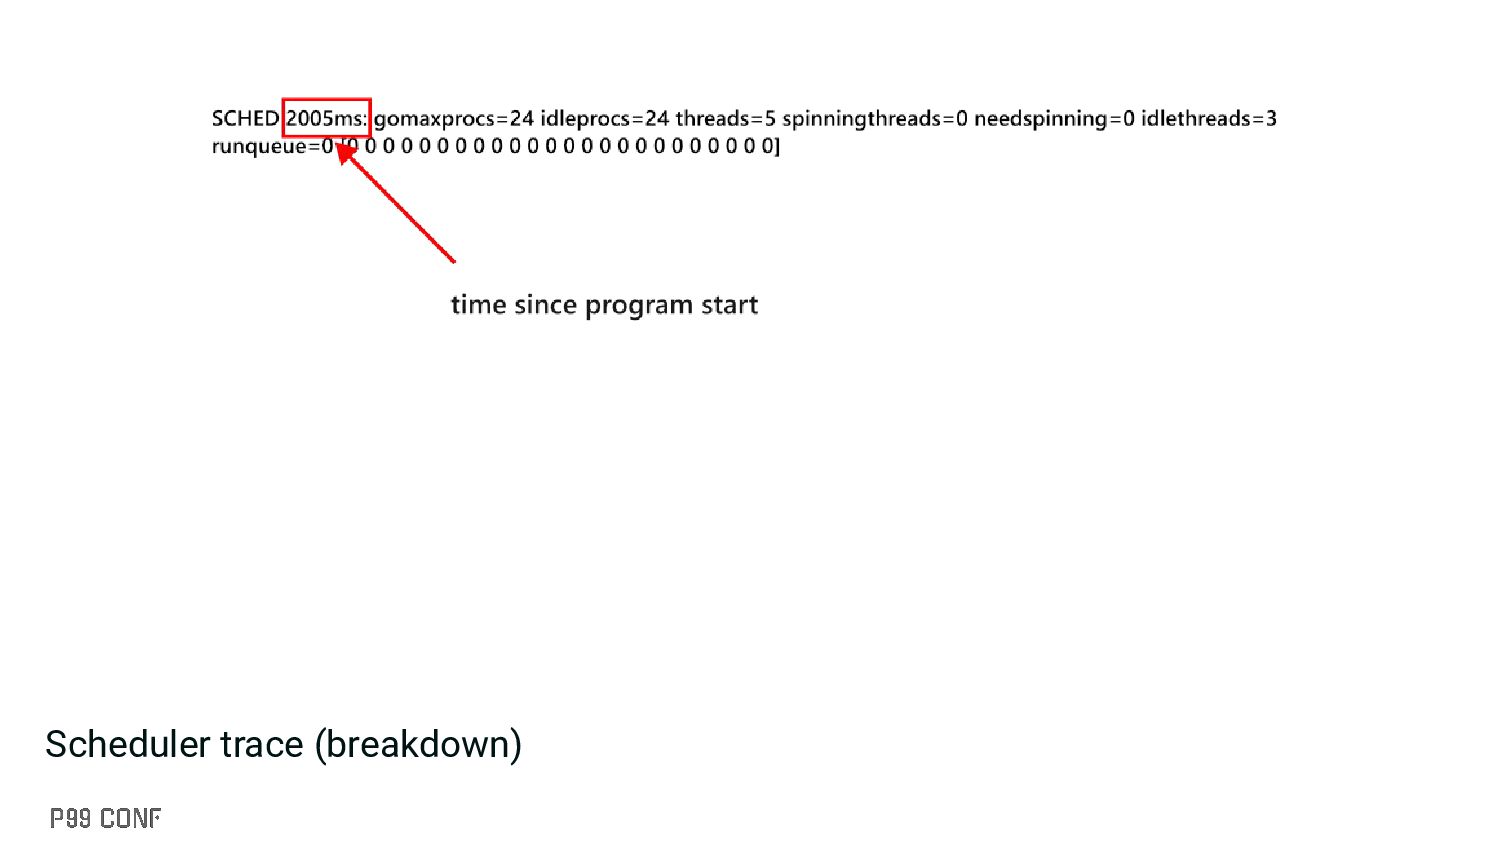
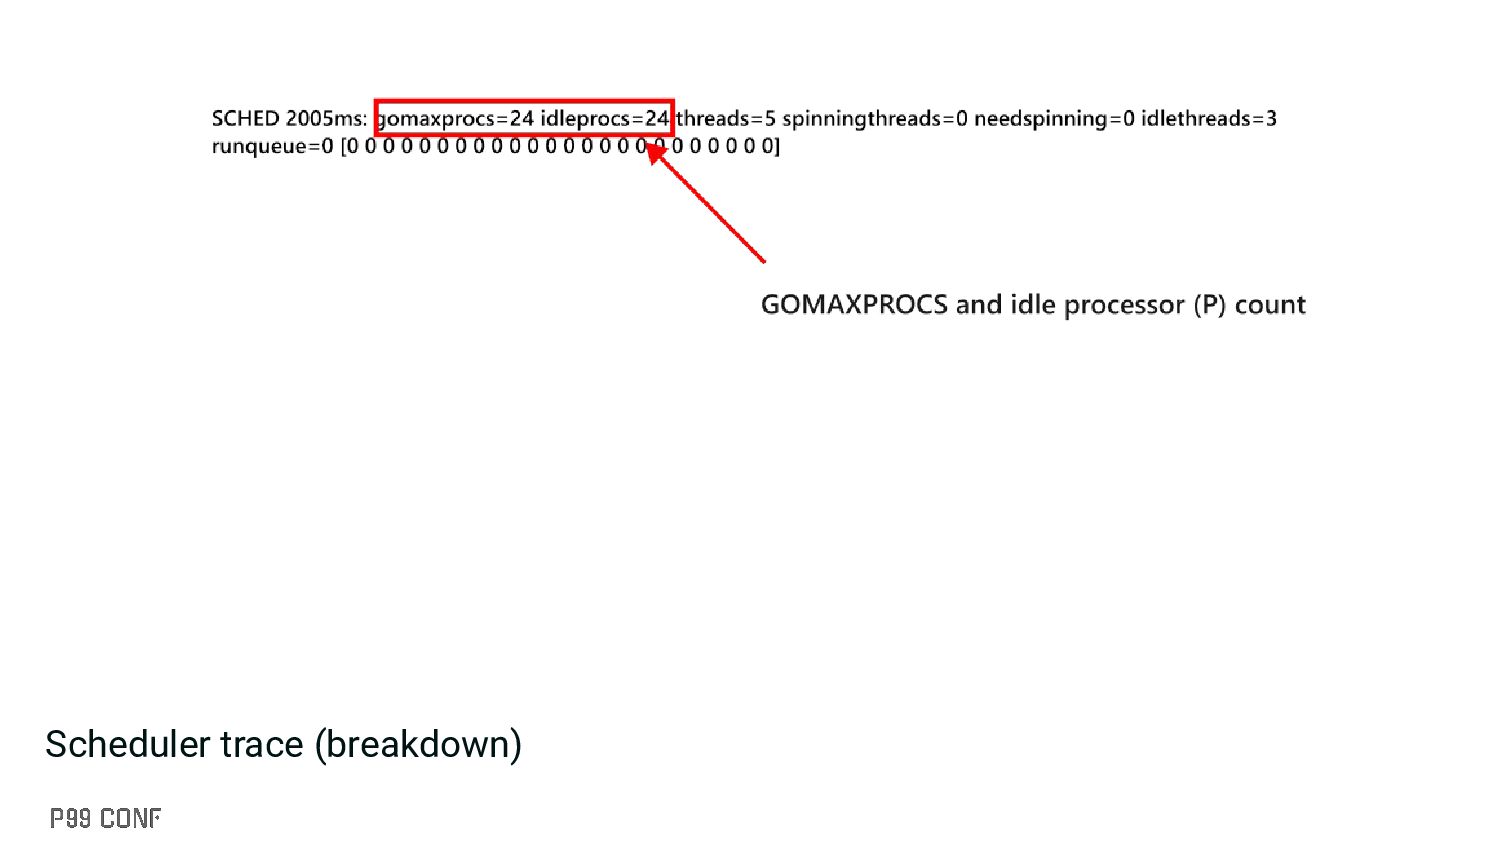
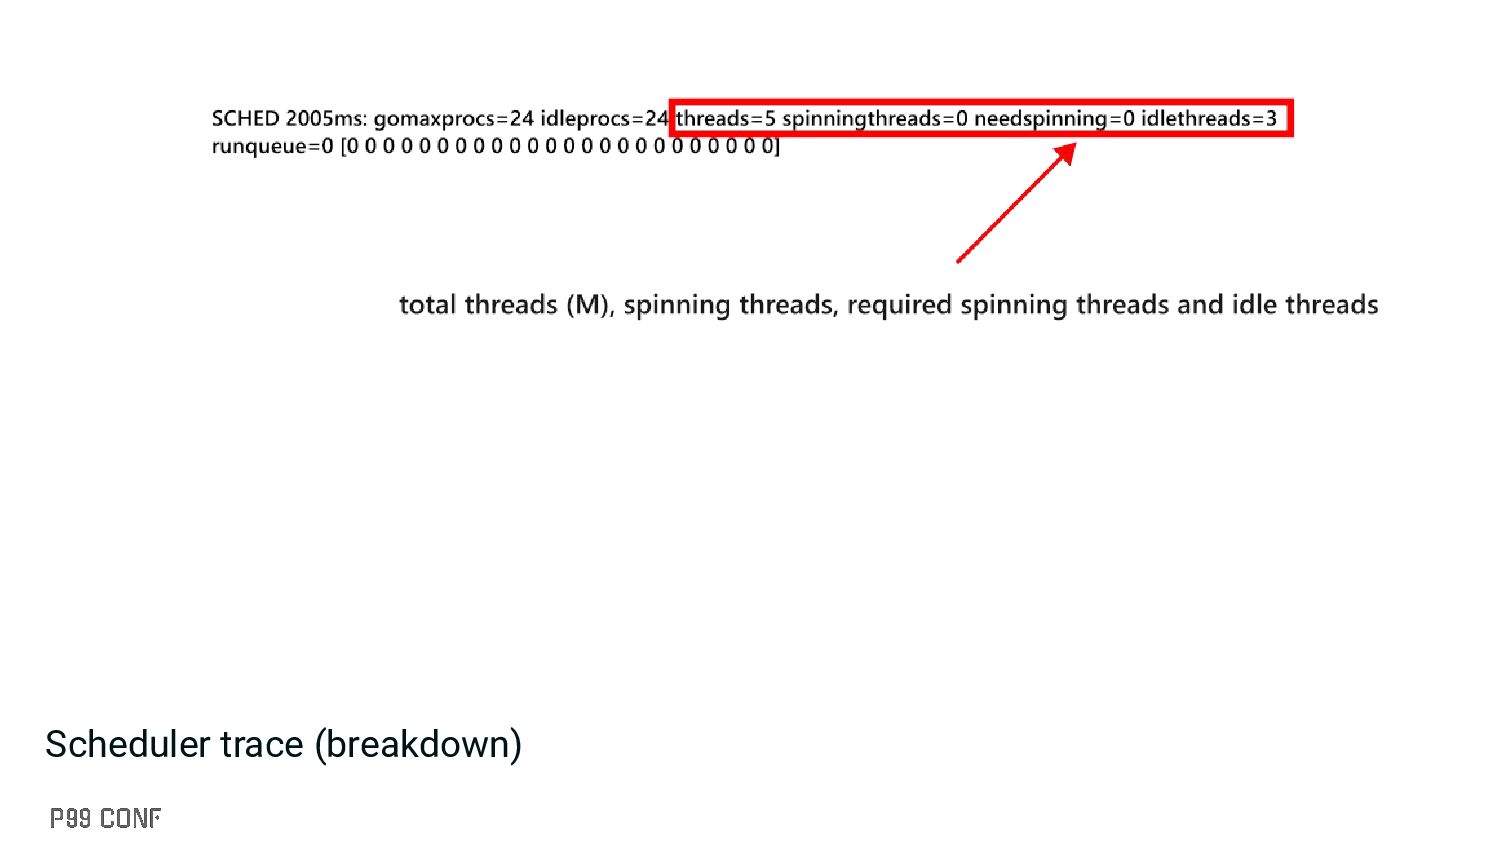
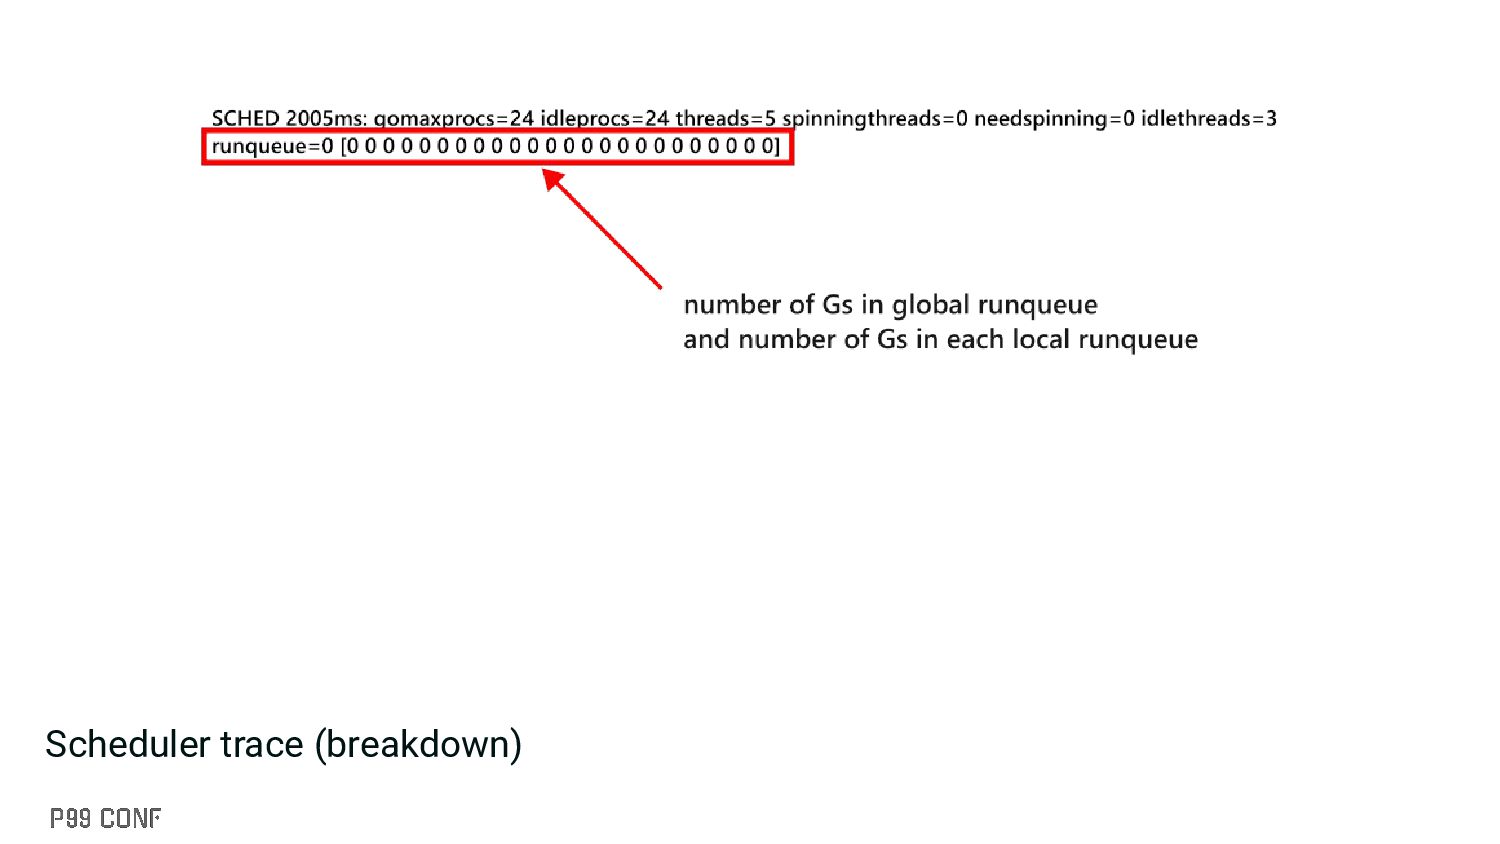
scheduler like: • Processor information (idle Ps, etc.) • Thread information (idle threads, spinning threads, etc.) • Global and local runqueue for Gs (goroutines) • etc. ▪ Slightly less overhead than the execution tracer ▪ Can be enabled through: GODEBUG=schedtrace=1000 • Emits information every 1000 milliseconds, usage: GODEBUG=schedtrace=X, where X is duration
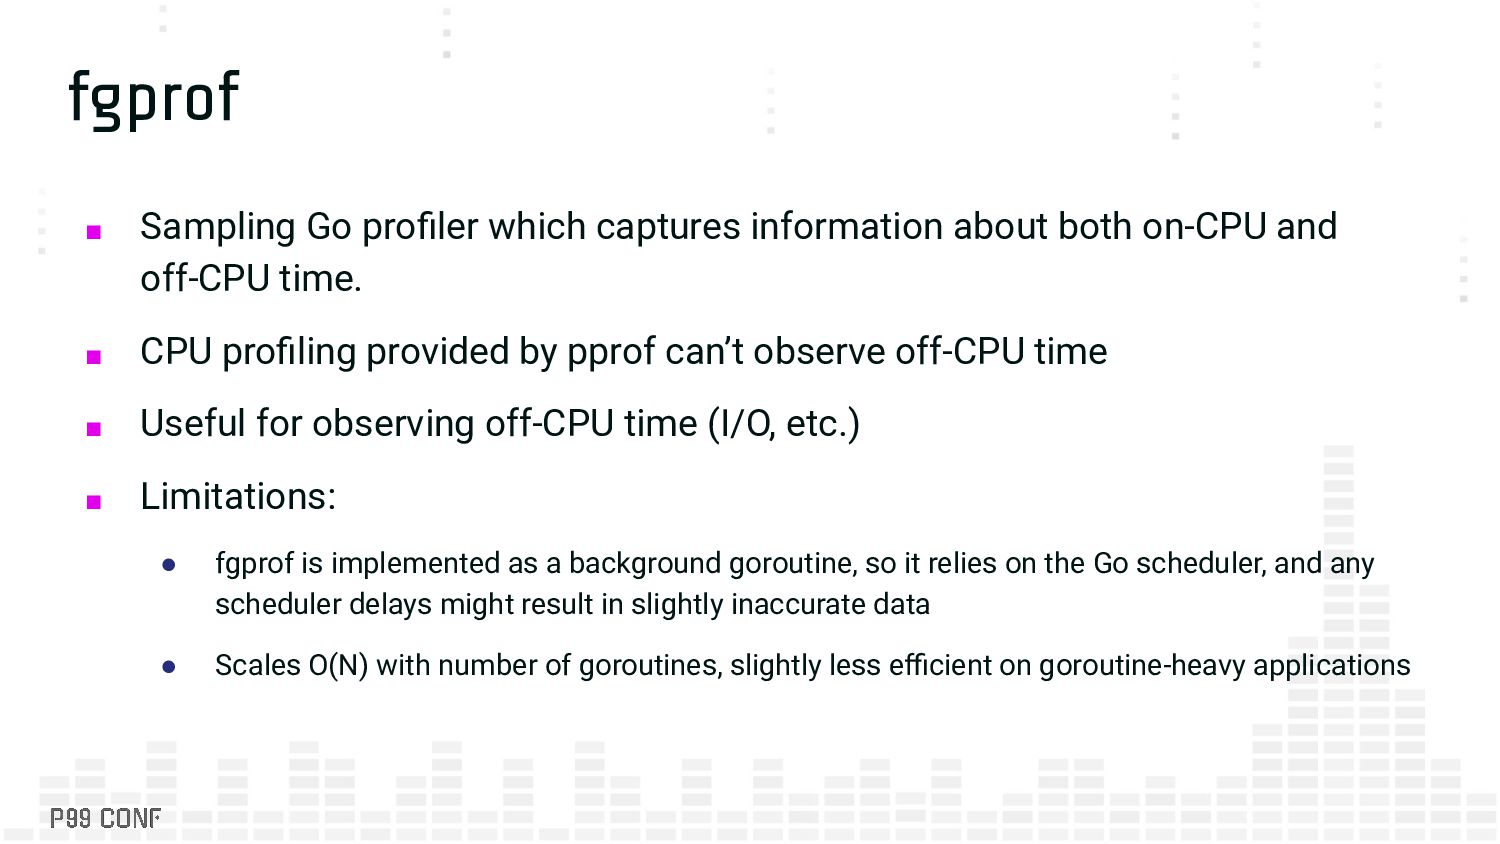
on-CPU and off-CPU time. ▪ CPU profiling provided by pprof can’t observe off-CPU time ▪ Useful for observing off-CPU time (I/O, etc.) ▪ Limitations: • fgprof is implemented as a background goroutine, so it relies on the Go scheduler, and any scheduler delays might result in slightly inaccurate data • Scales O(N) with number of goroutines, slightly less efficient on goroutine-heavy applications
great way to learn a lot of things! ▪ Go has a great set of tooling, and provides some really nice ways to understand more about the Go runtime ▪ The contributors and the Go team deserve a huge kudos for supporting these tools!
consectetur adipiscing elit. Integer auctor eros eu faucibus sodales. Nunc dictum, urna id blandit pretium, mauris velit pulvinar ligula, interdum blandit sem tortor eget dolor. ▪ Bullet 1 • Bullet 2 ▪ Bullet 3
consectetur adipiscing elit. Integer auctor eros eu faucibus sodales. Nunc dictum, urna id blandit pretium, mauris velit pulvinar ligula, interdum blandit sem tortor eget dolor. ▪ Bullet 1 • Bullet 2 ▪ Bullet 3
consectetur adipiscing elit. Integer auctor eros eu faucibus sodales. Nunc dictum, urna id blandit pretium, mauris velit pulvinar ligula, interdum blandit sem tortor eget dolor. ▪ Bullet 1 • Bullet 2 ▪ Bullet 3
consectetur adipiscing elit. Integer auctor eros eu faucibus sodales. Nunc dictum, urna id blandit pretium, mauris velit pulvinar ligula, interdum blandit sem tortor eget dolor. ▪ Bullet 1 • Bullet 2 ▪ Bullet 3
![Thank you! Email: [email protected] Twitter: @carrotburnt Bluesky: [email protected] Website: https://databases.systems](https://files.speakerdeck.com/presentations/0b05744cff954be0987a8112ddaf212b/slide_72.jpg)