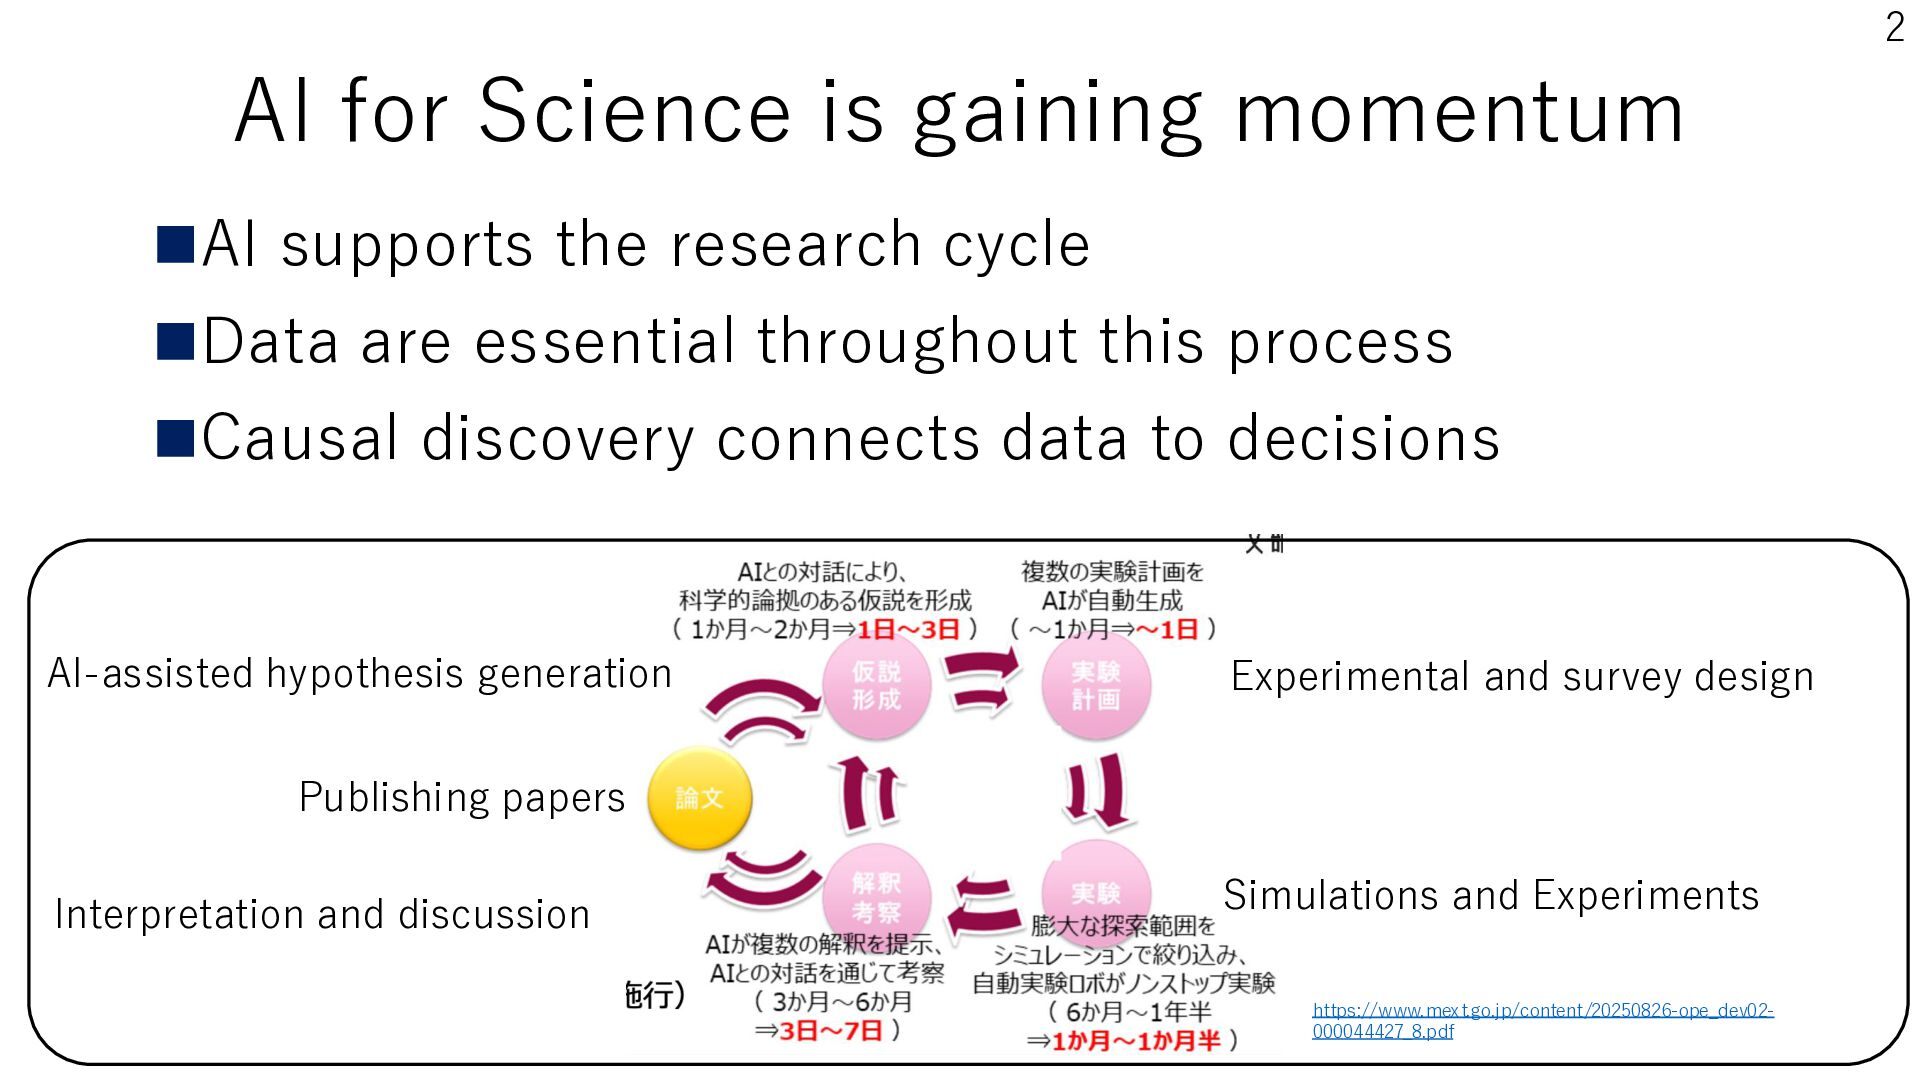
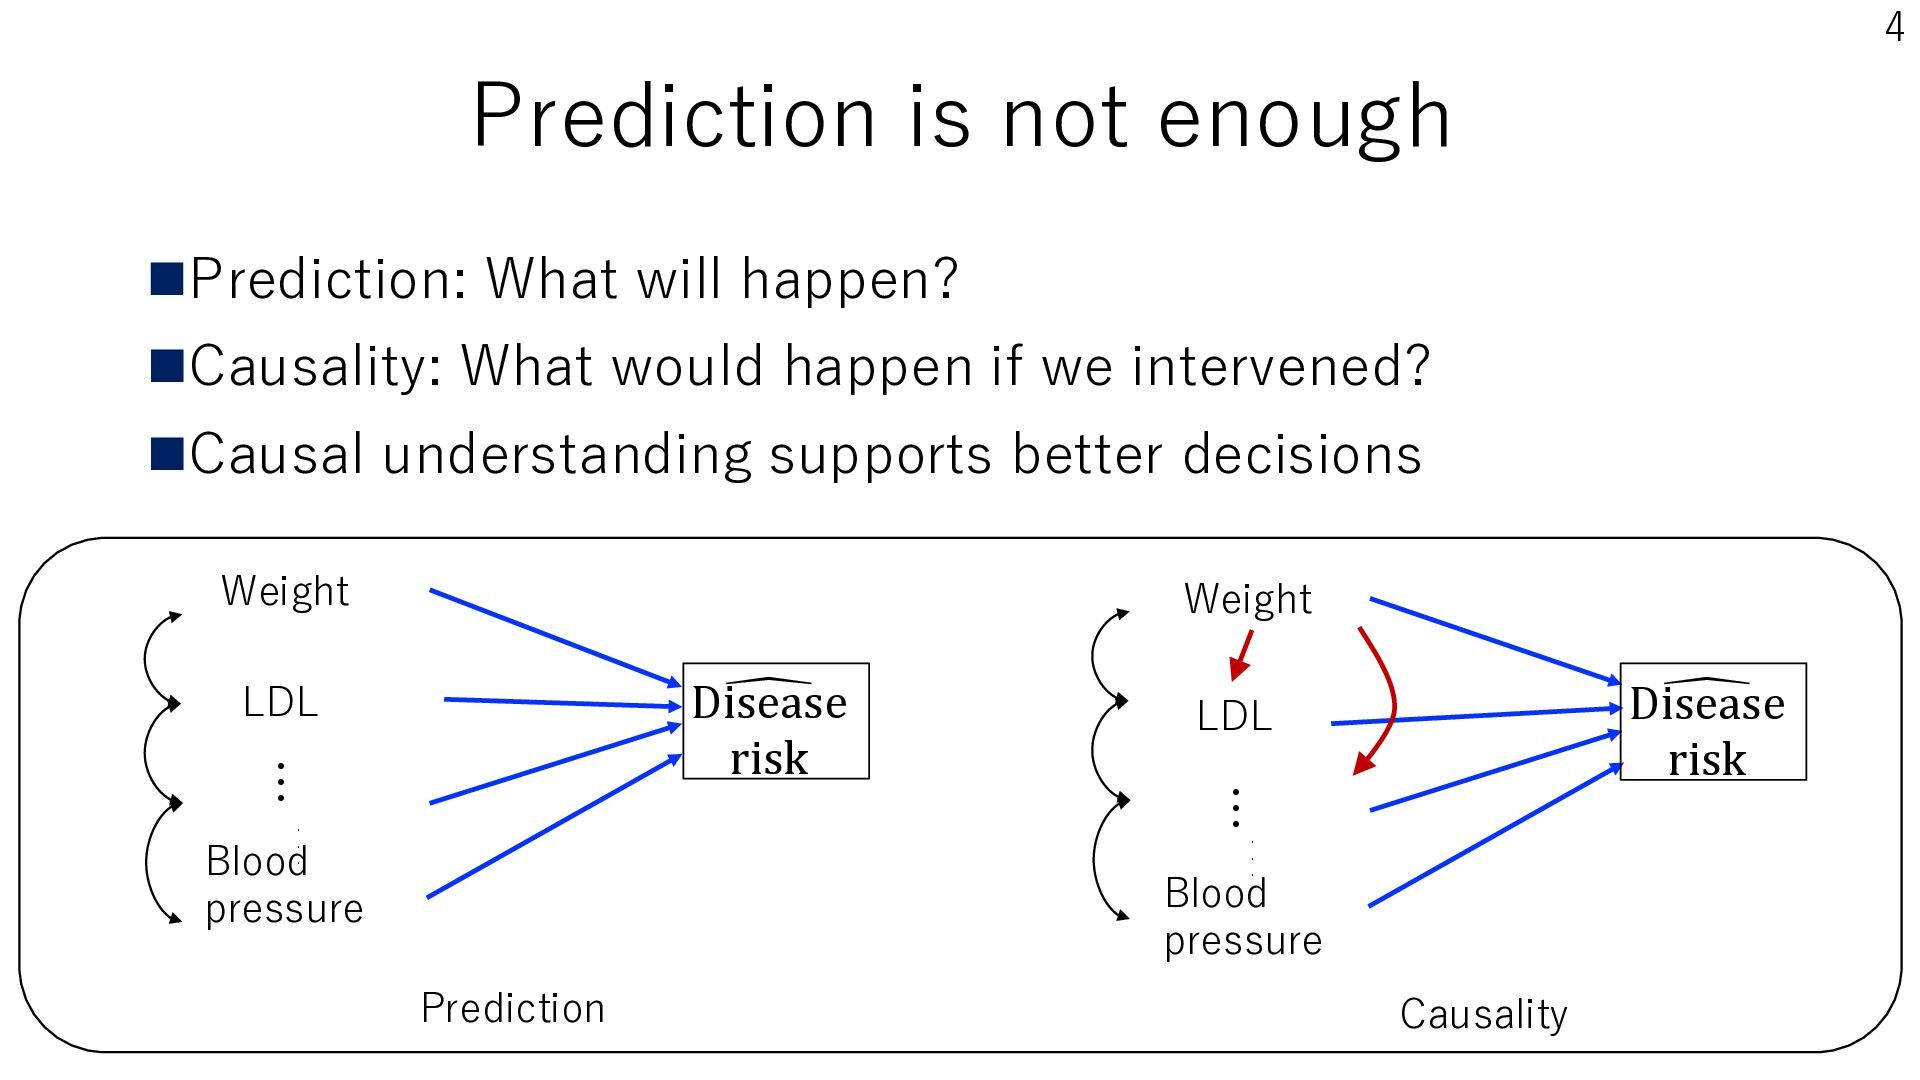
research cycle ◼Data are essential throughout this process ◼Causal discovery connects data to decisions AI-assisted hypothesis generation Experimental and survey design Publishing papers Interpretation and discussion Simulations and Experiments https://www.mext.go.jp/content/20250826-ope_dev02000044427_8.pdf
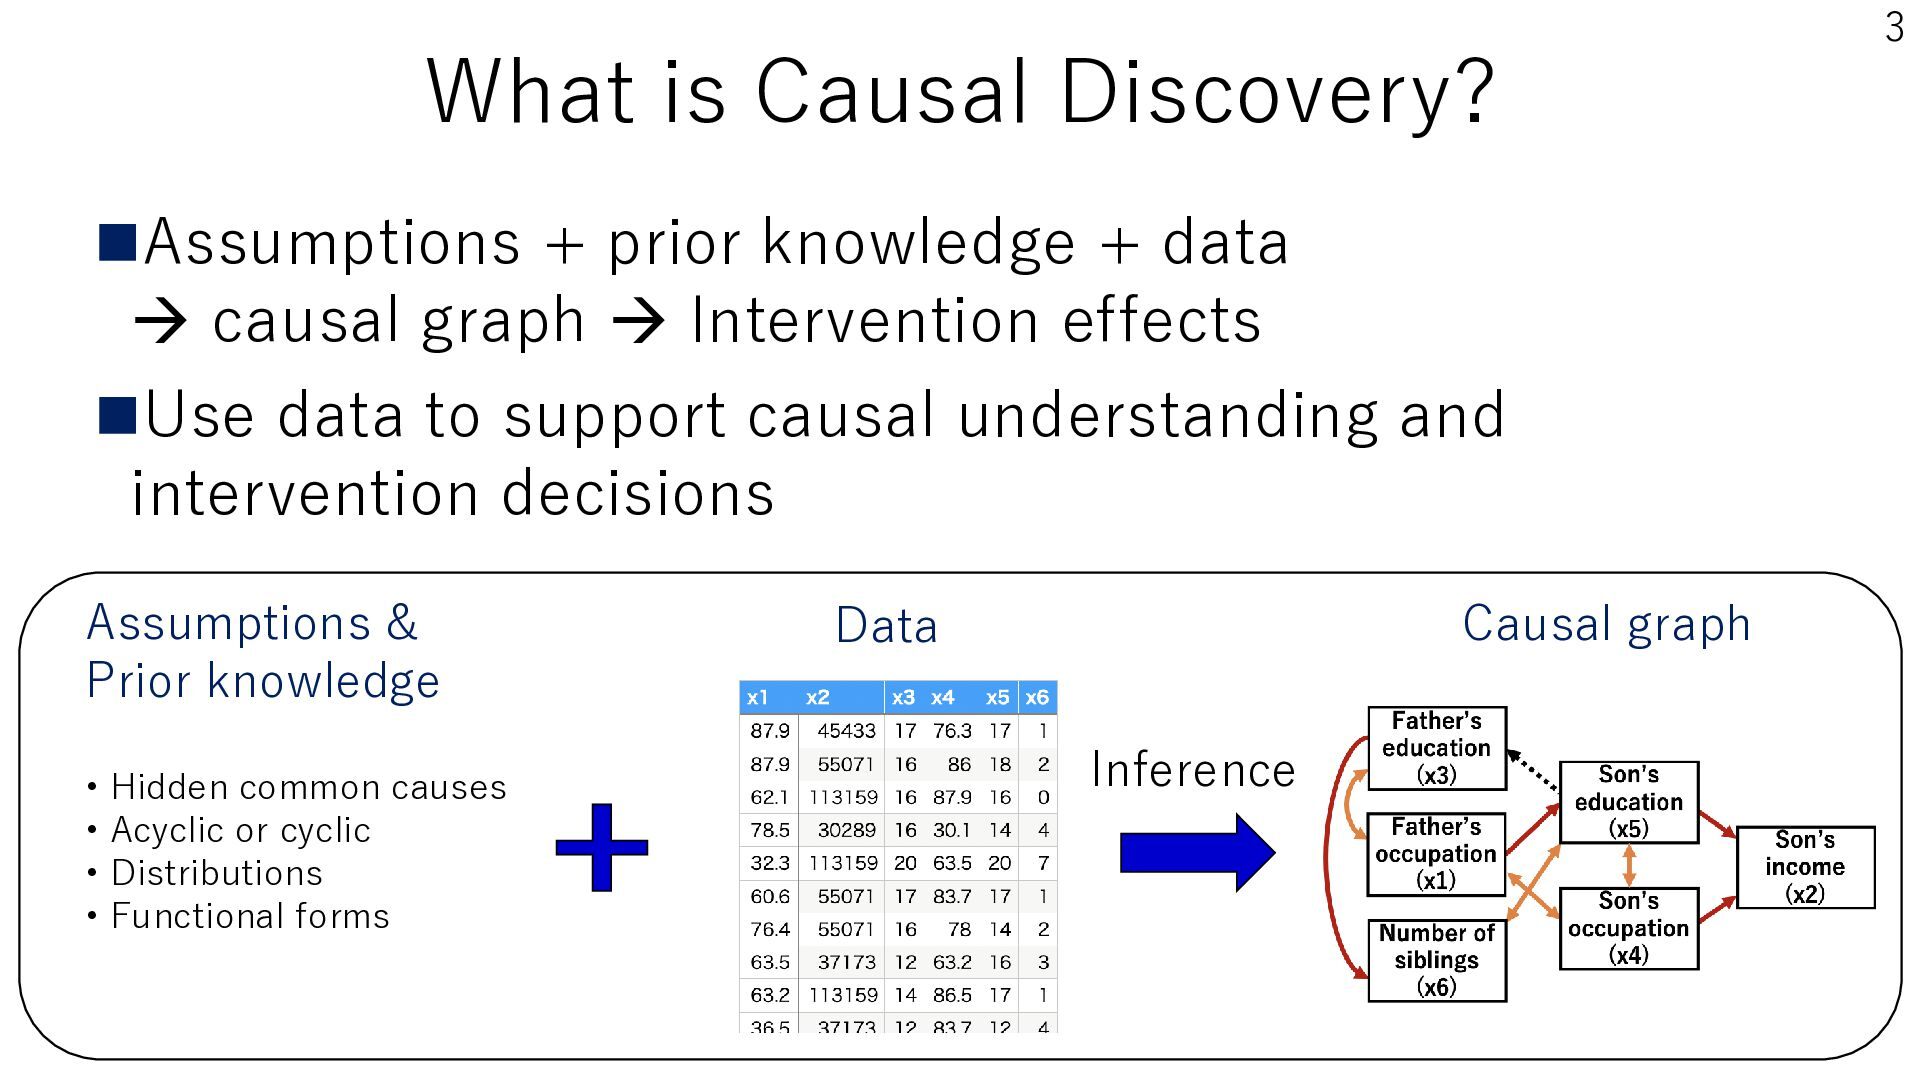
→ causal graph → Intervention effects ◼Use data to support causal understanding and intervention decisions Assumptions & Prior knowledge • Hidden common causes • Acyclic or cyclic • Distributions • Functional forms Causal graph Data Inference 3
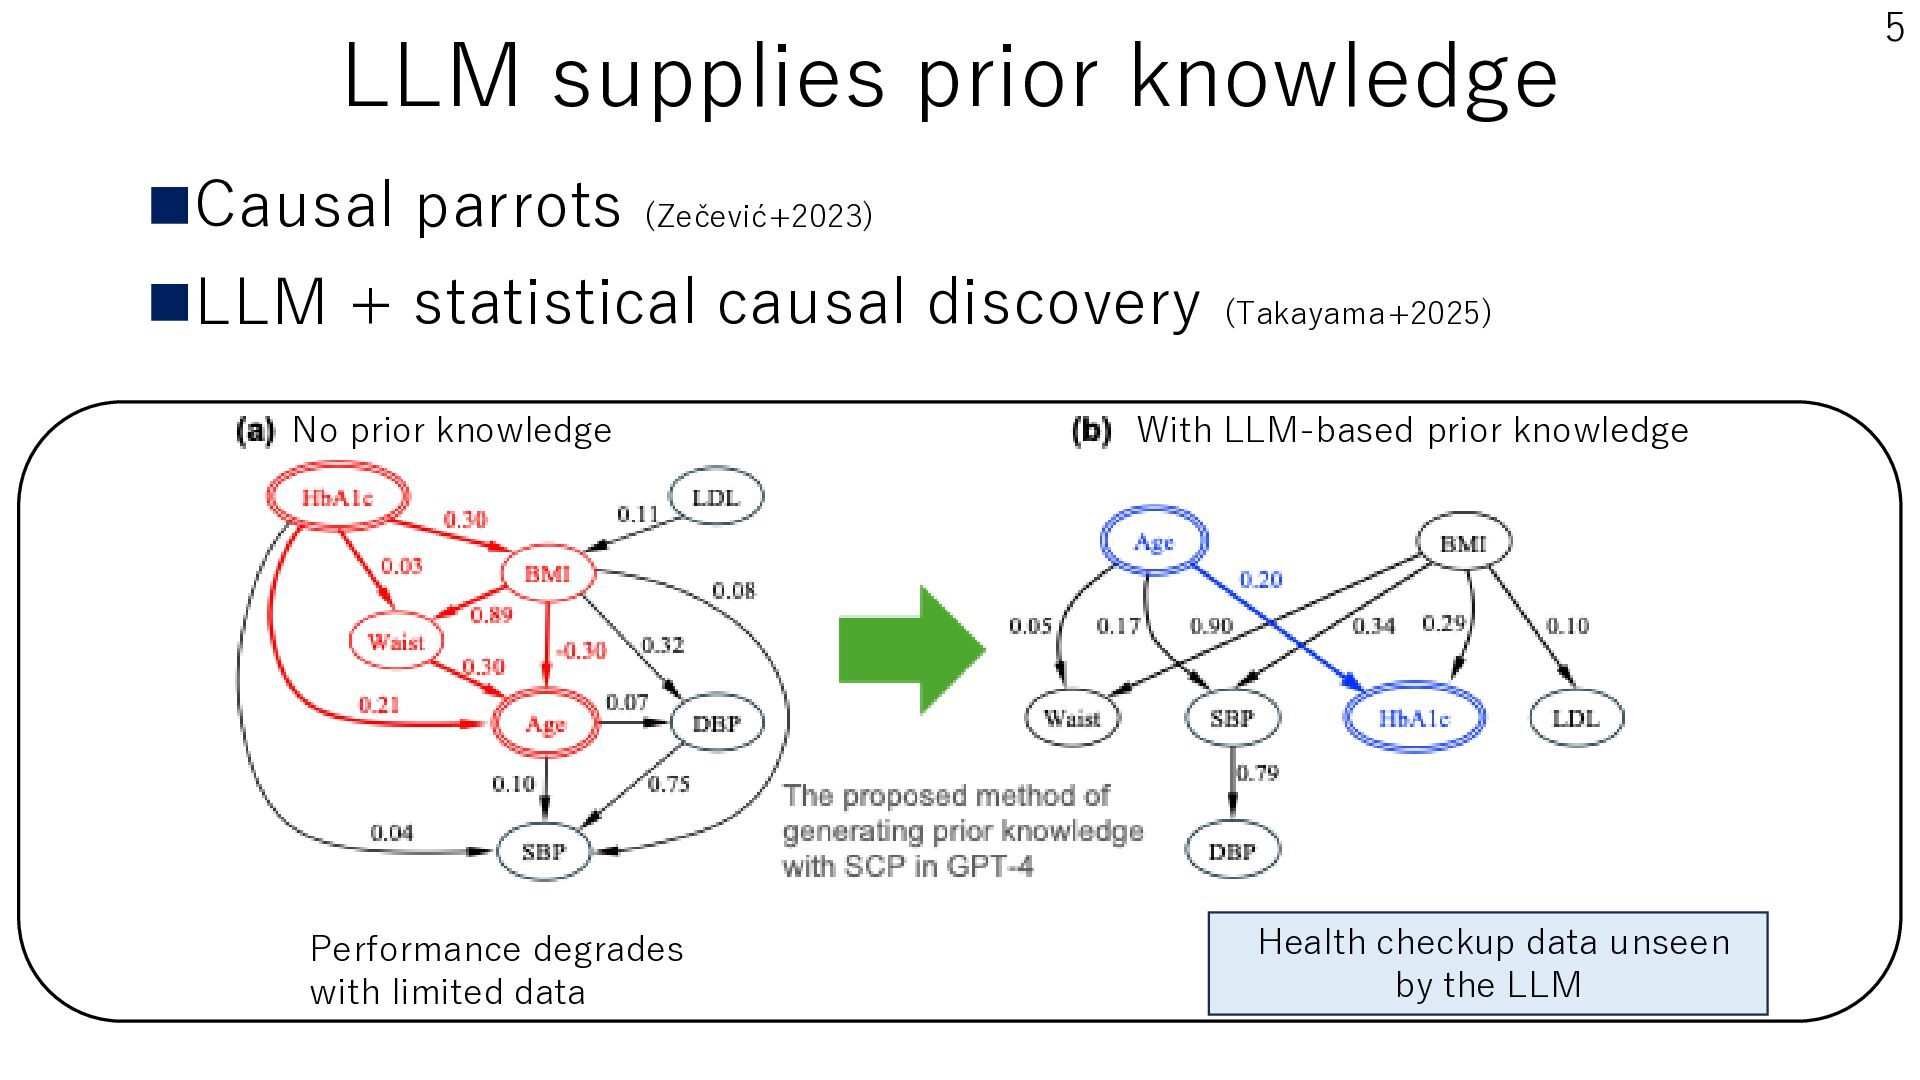
causal discovery (Takayama+2025) No prior knowledge Performance degrades with limited data With LLM-based prior knowledge Health checkup data unseen by the LLM 5
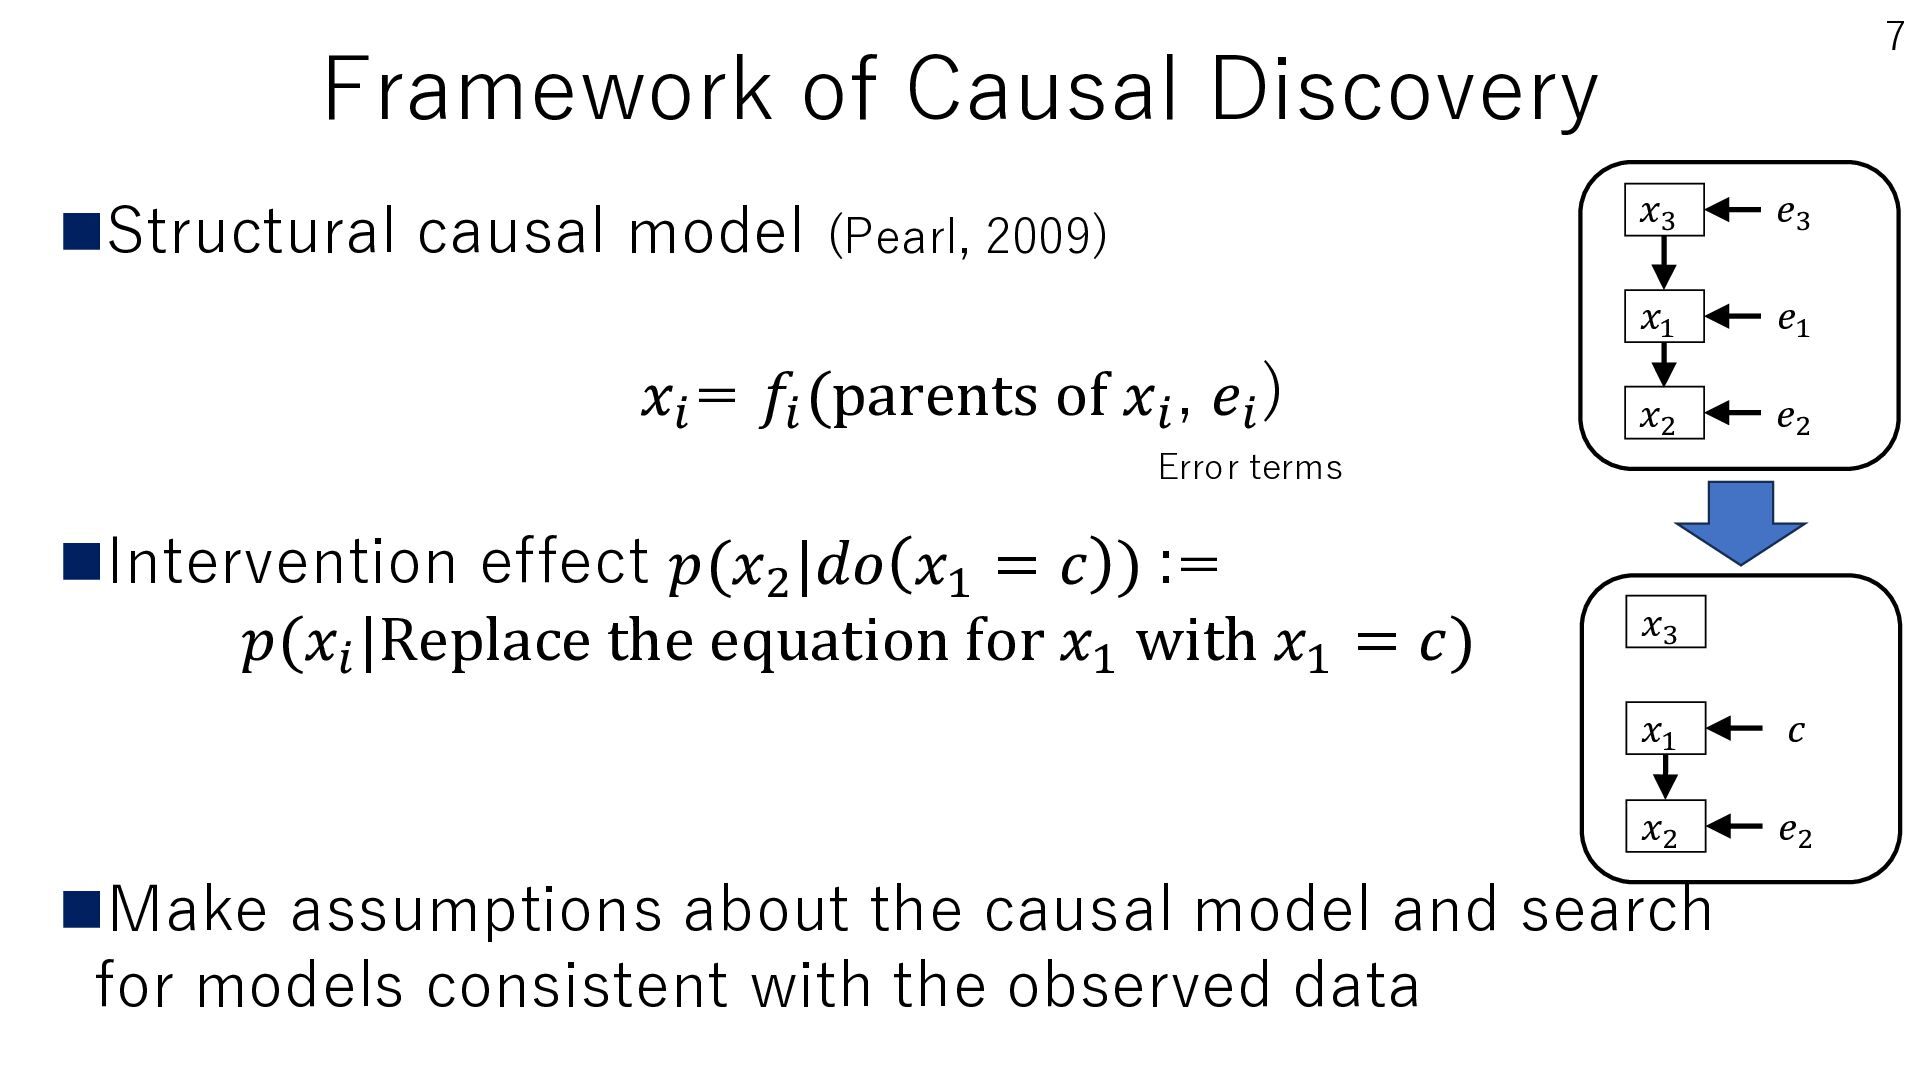
𝑥𝑖 = 𝑓𝑖 (parents of 𝑥𝑖 , 𝑒𝑖 ) 𝑥3 𝑒3 𝑥1 𝑒1 𝑥2 𝑒2 Error terms ◼Intervention effect 𝑝(𝑥2 |𝑑𝑜 𝑥1 = 𝑐 ) := 𝑝(𝑥𝑖 |Replace the equation for 𝑥1 with 𝑥1 = 𝑐) 𝑥3 𝑥1 𝑐 𝑥2 𝑒2 ◼Make assumptions about the causal model and search for models consistent with the observed data
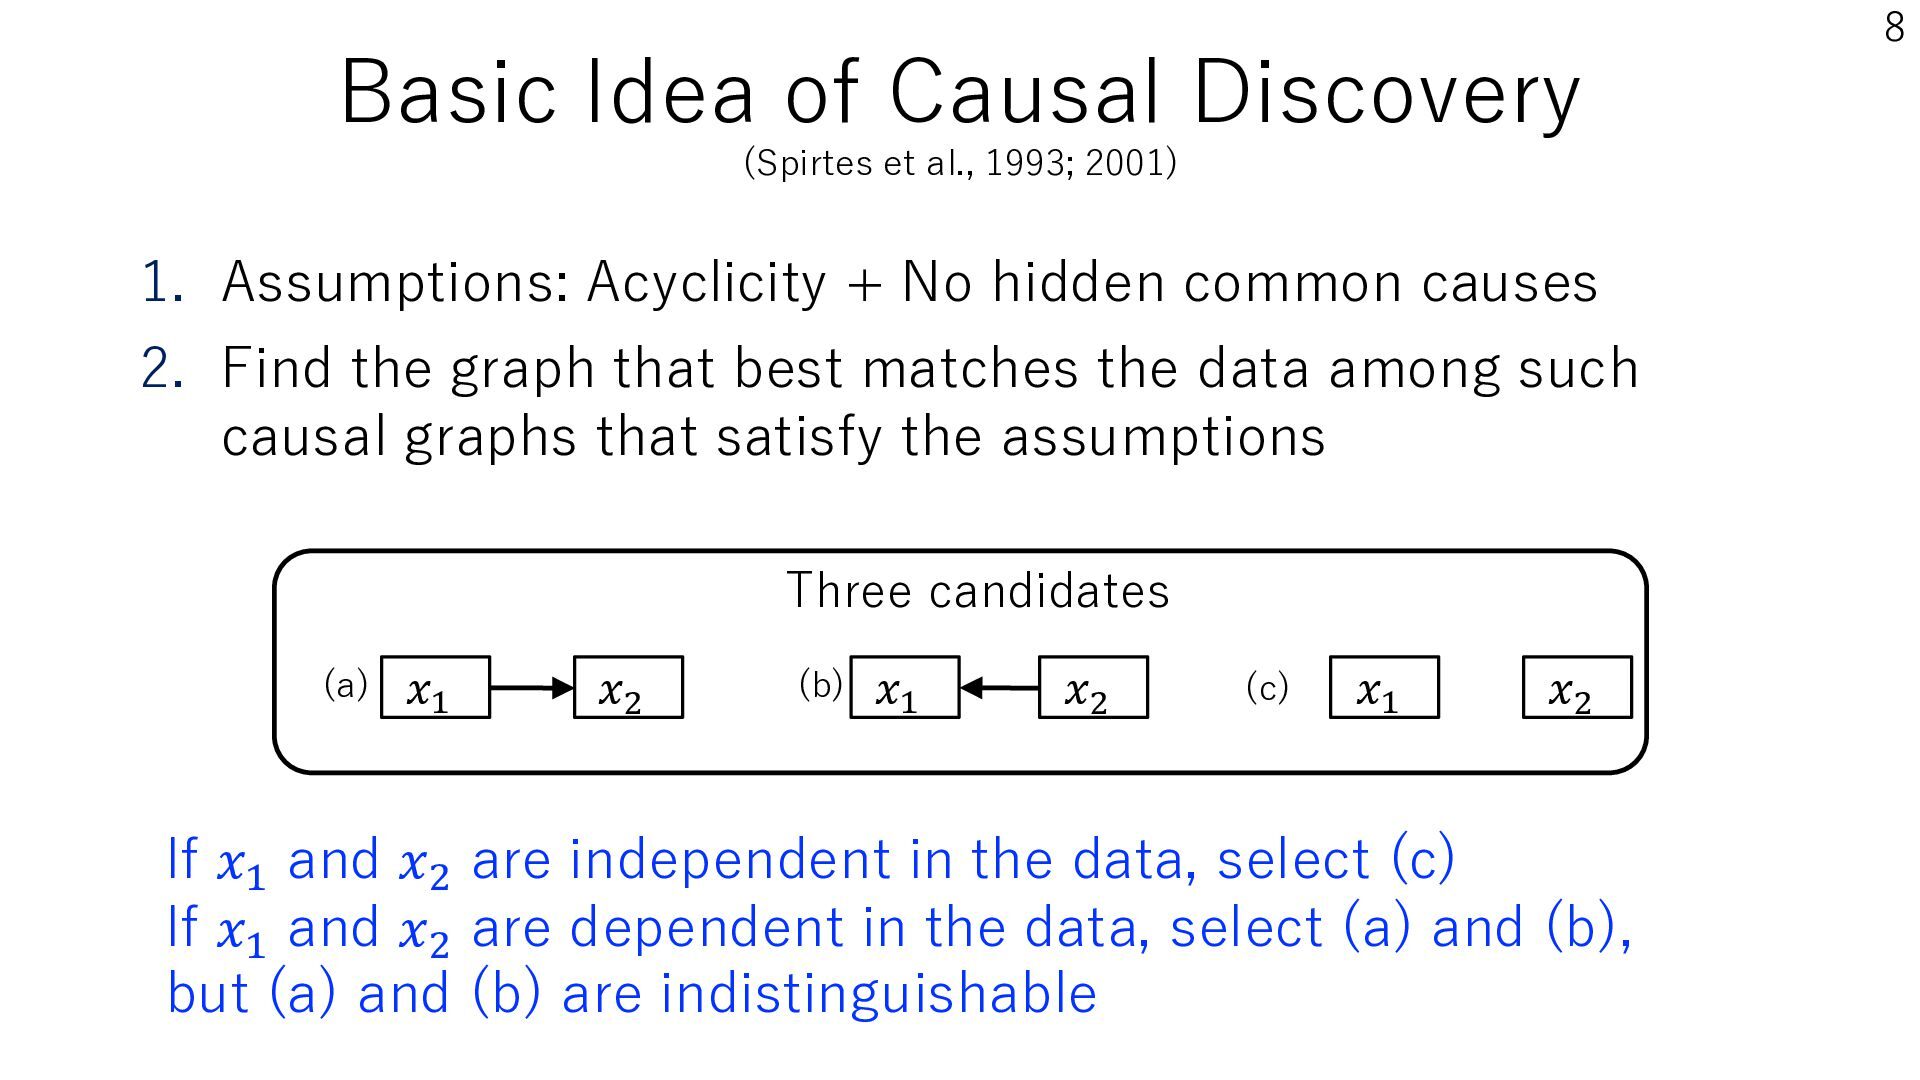
1. Assumptions: Acyclicity + No hidden common causes 2. Find the graph that best matches the data among such causal graphs that satisfy the assumptions Three candidates (a) 𝑥1 𝑥2 (b) 𝑥1 𝑥2 (c) 𝑥1 𝑥2 If 𝑥1 and 𝑥2 are independent in the data, select (c) If 𝑥1 and 𝑥2 are dependent in the data, select (a) and (b), but (a) and (b) are indistinguishable 8
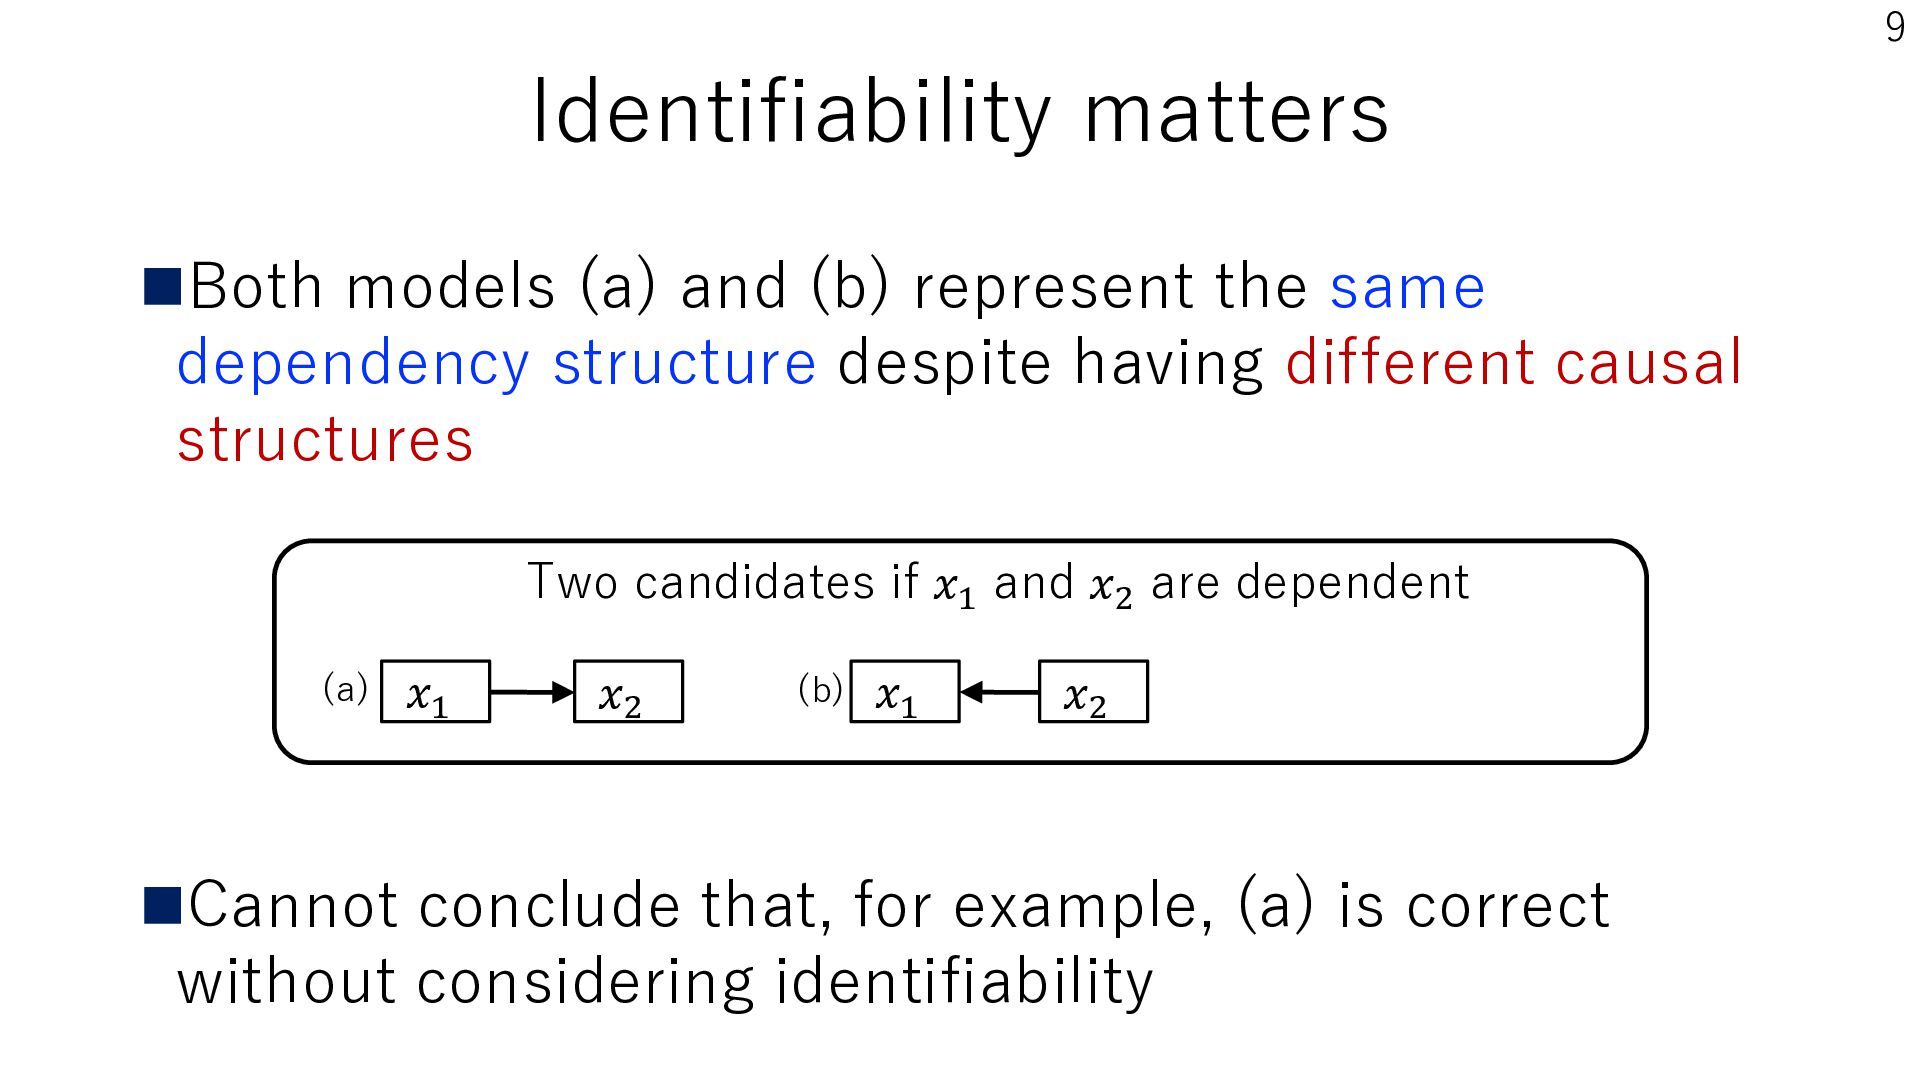
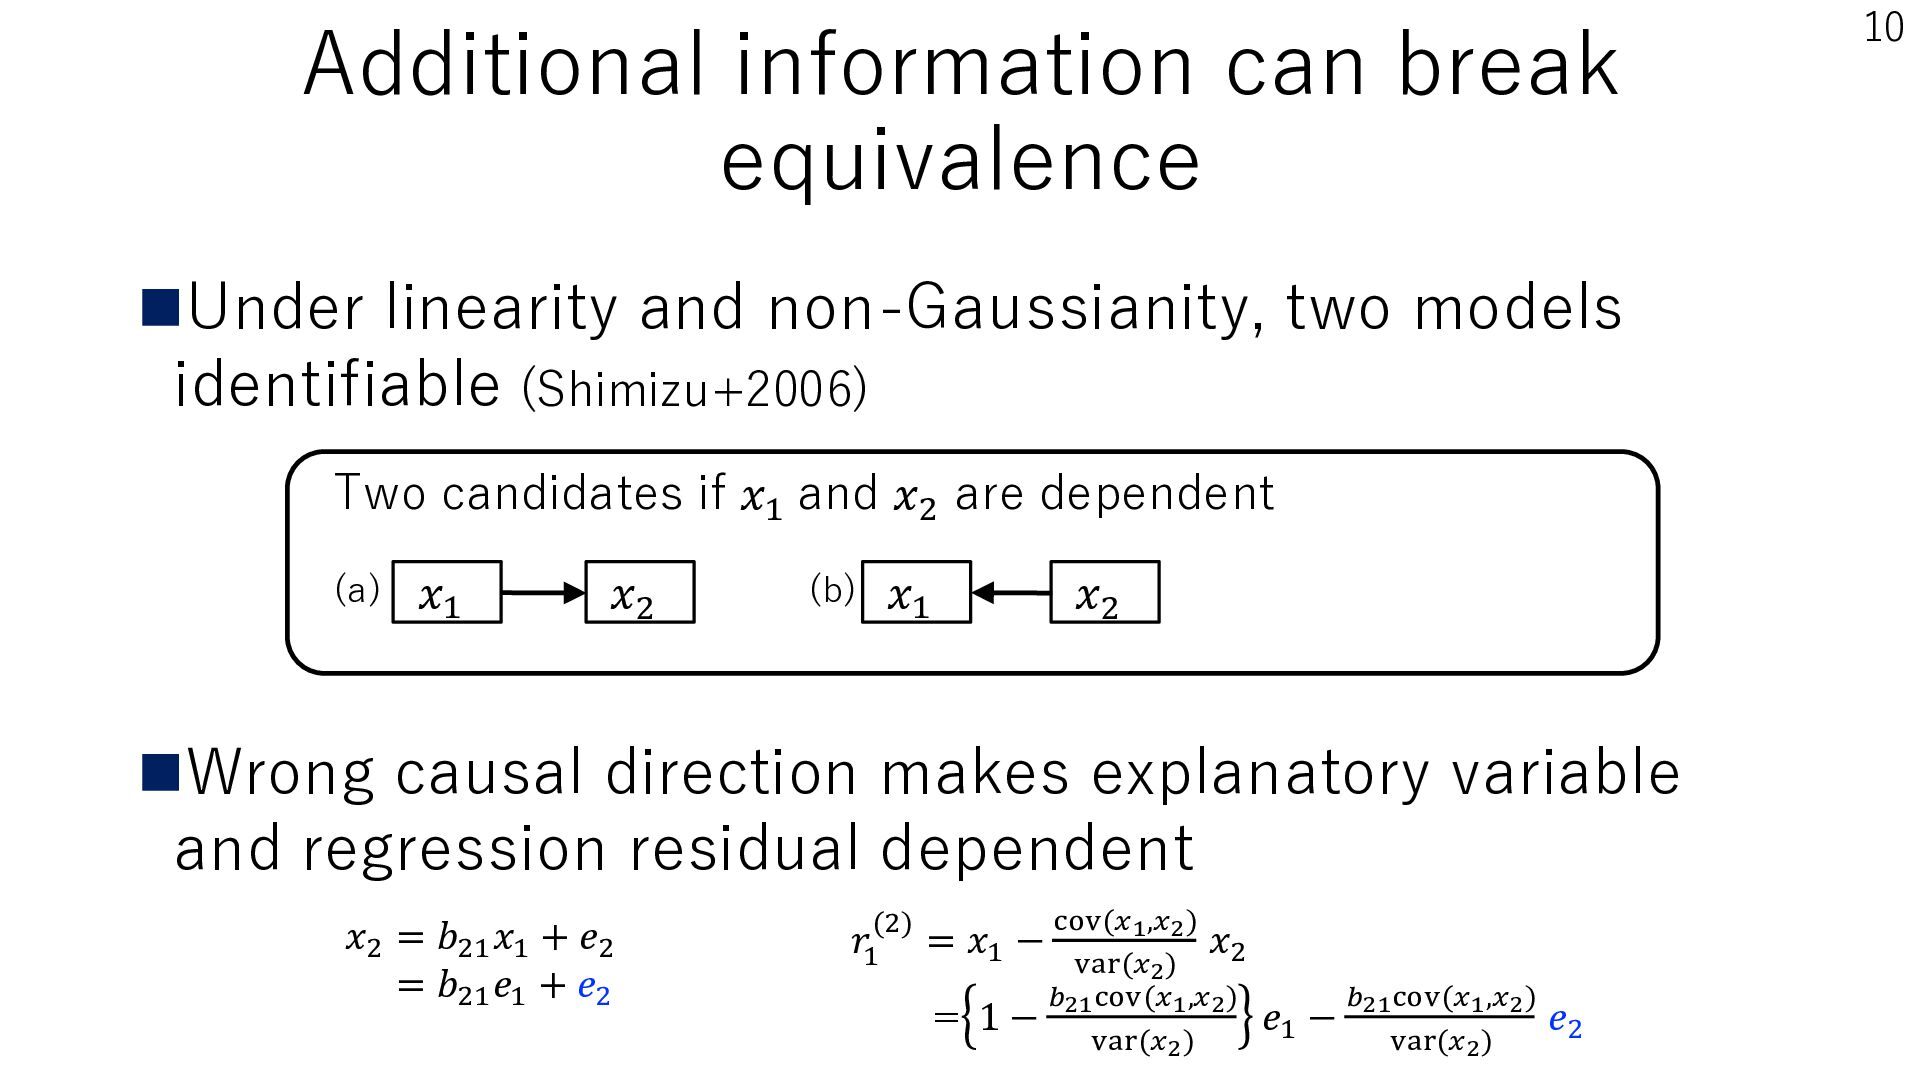
same dependency structure despite having different causal structures Two candidates if 𝑥1 and 𝑥2 are dependent (a) 𝑥1 𝑥2 (b) 𝑥1 𝑥2 ◼Cannot conclude that, for example, (a) is correct without considering identifiability
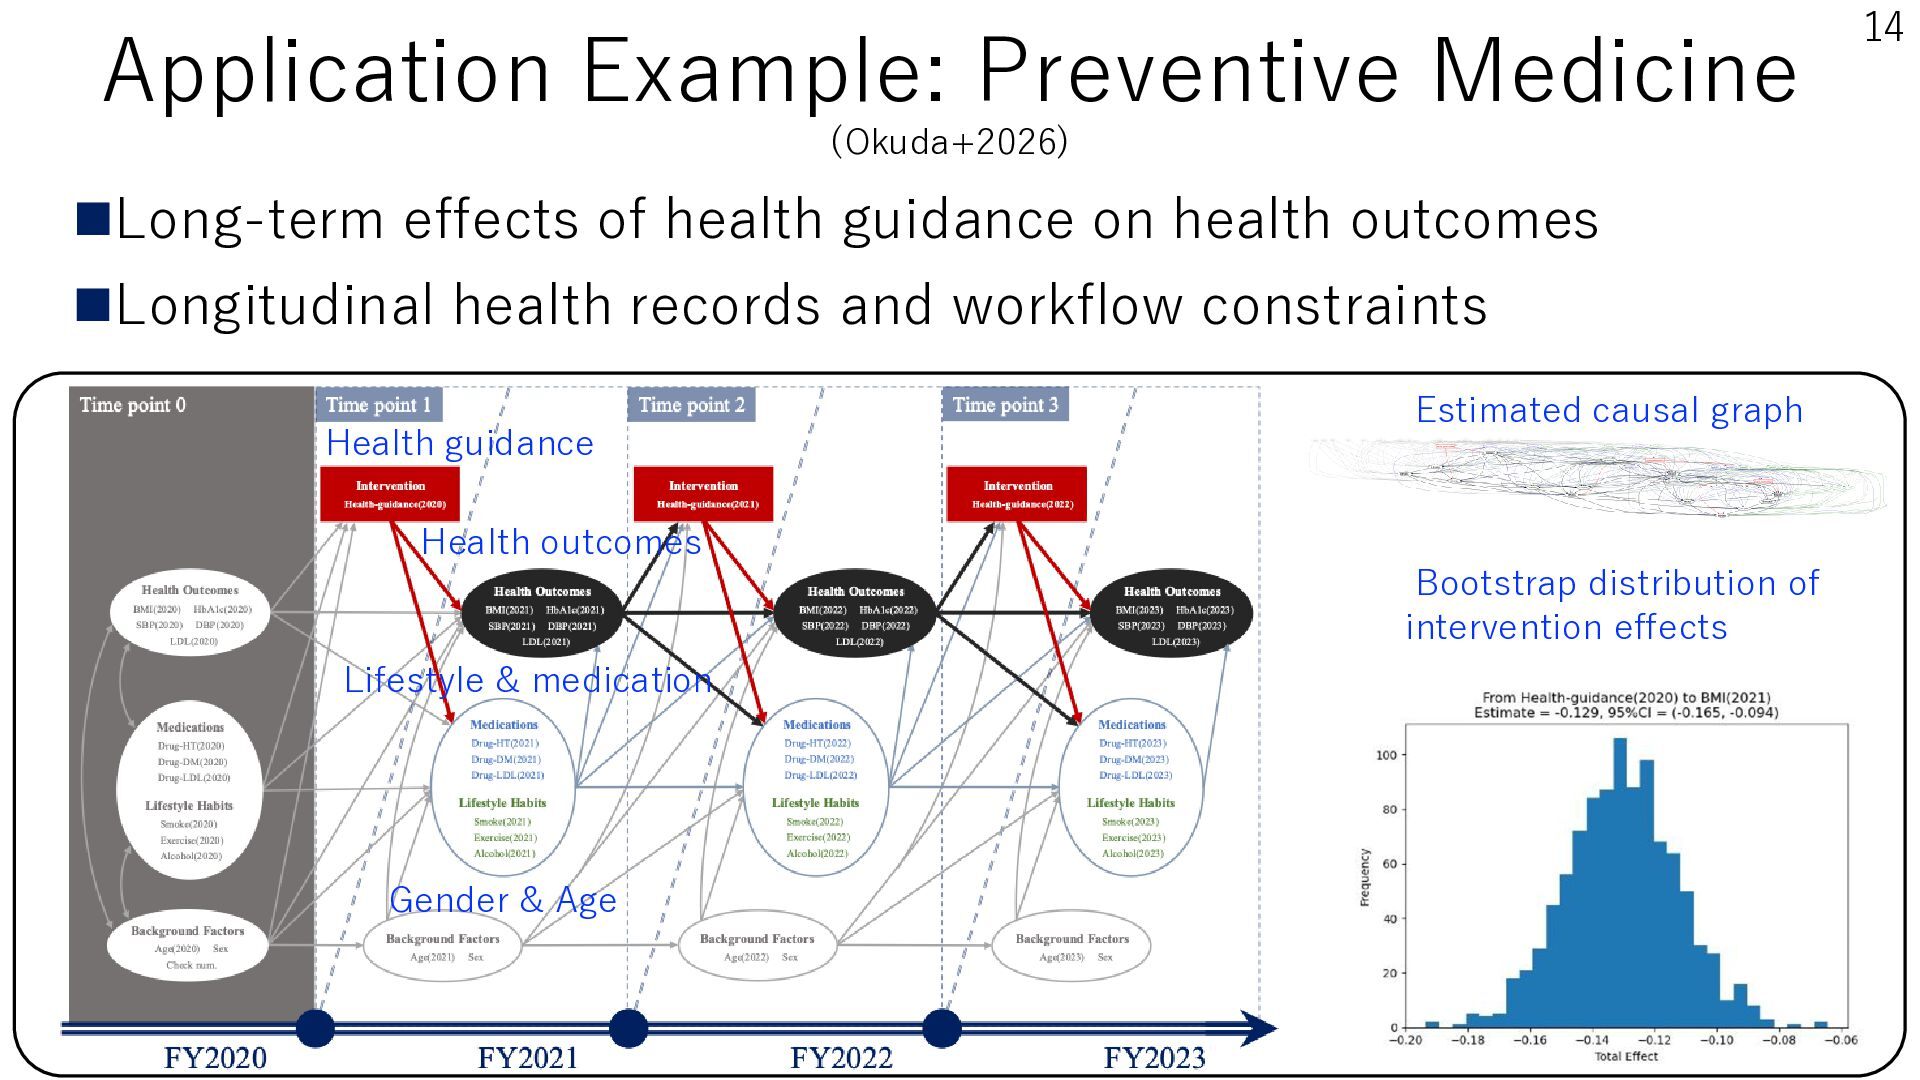
on health outcomes ◼Longitudinal health records and workflow constraints Health guidance Estimated causal graph Health outcomes Bootstrap distribution of intervention effects Lifestyle & medication Gender & Age 14
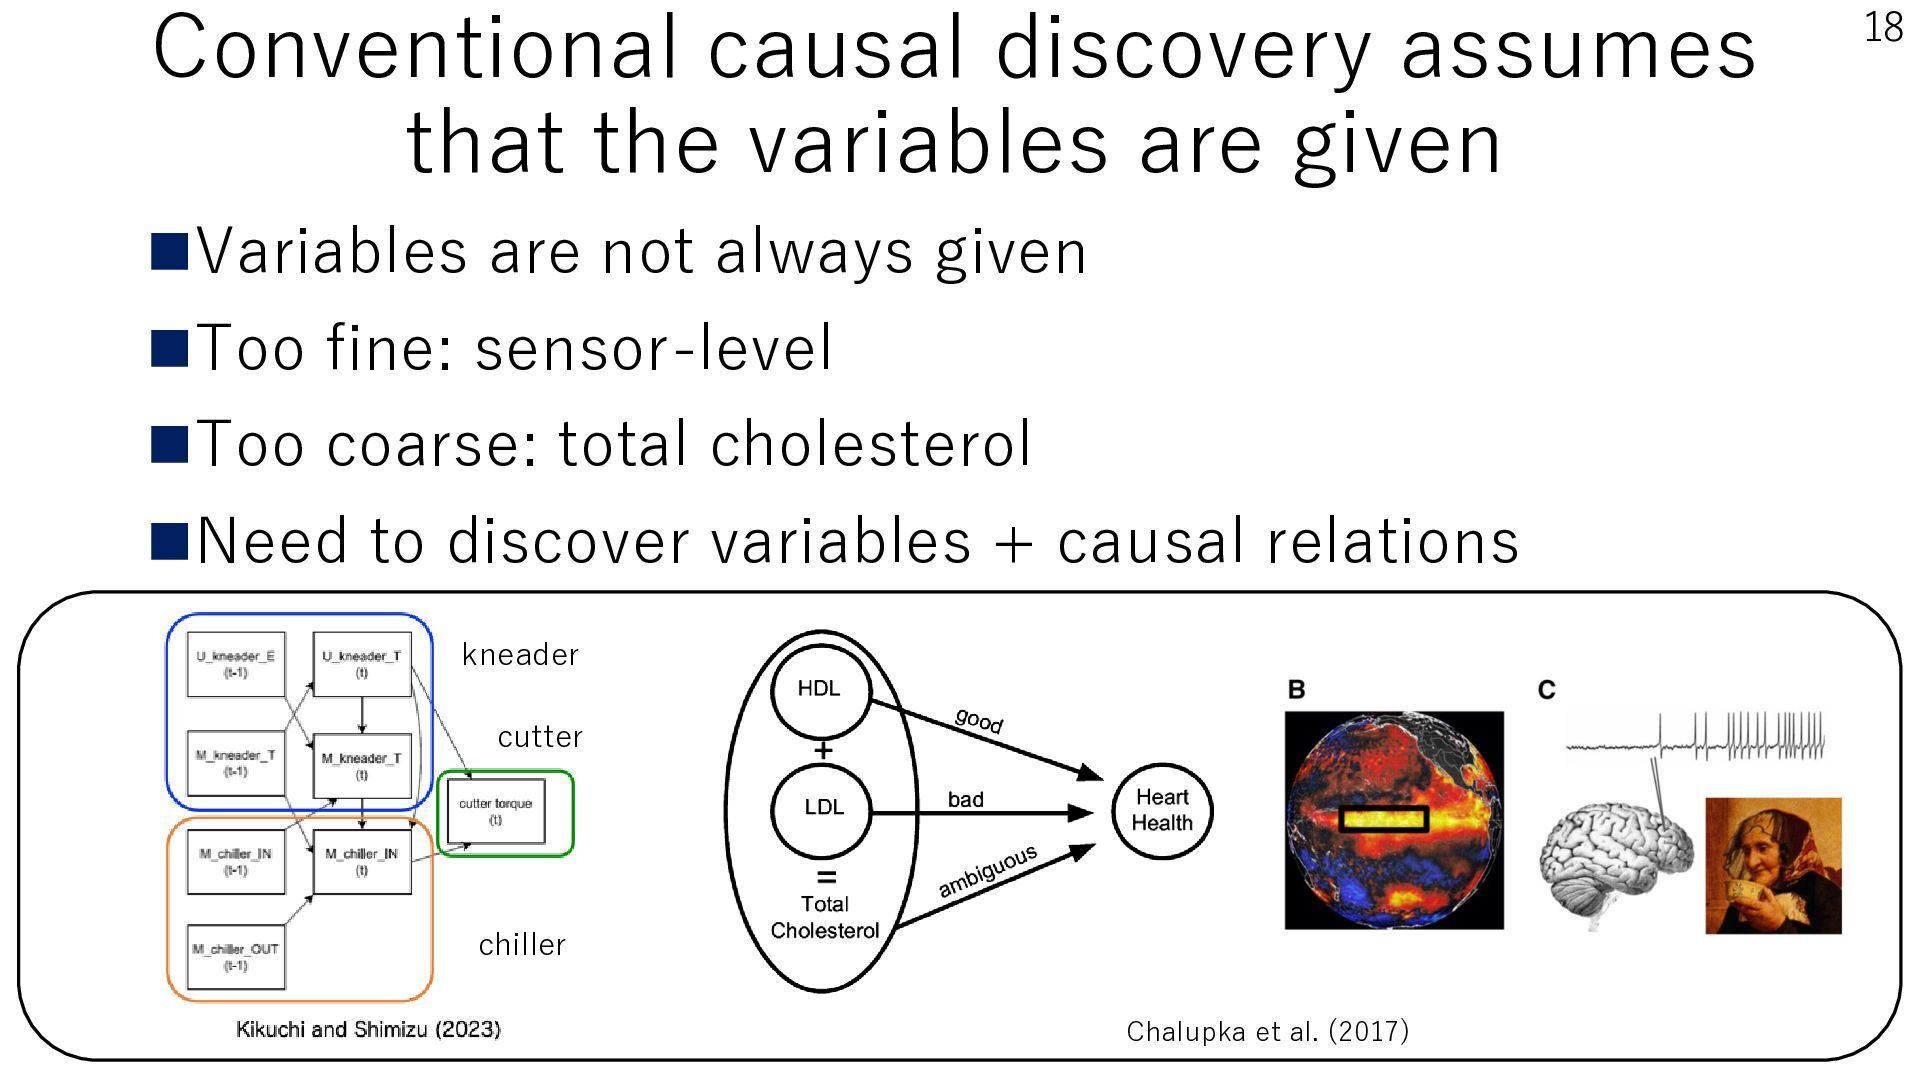
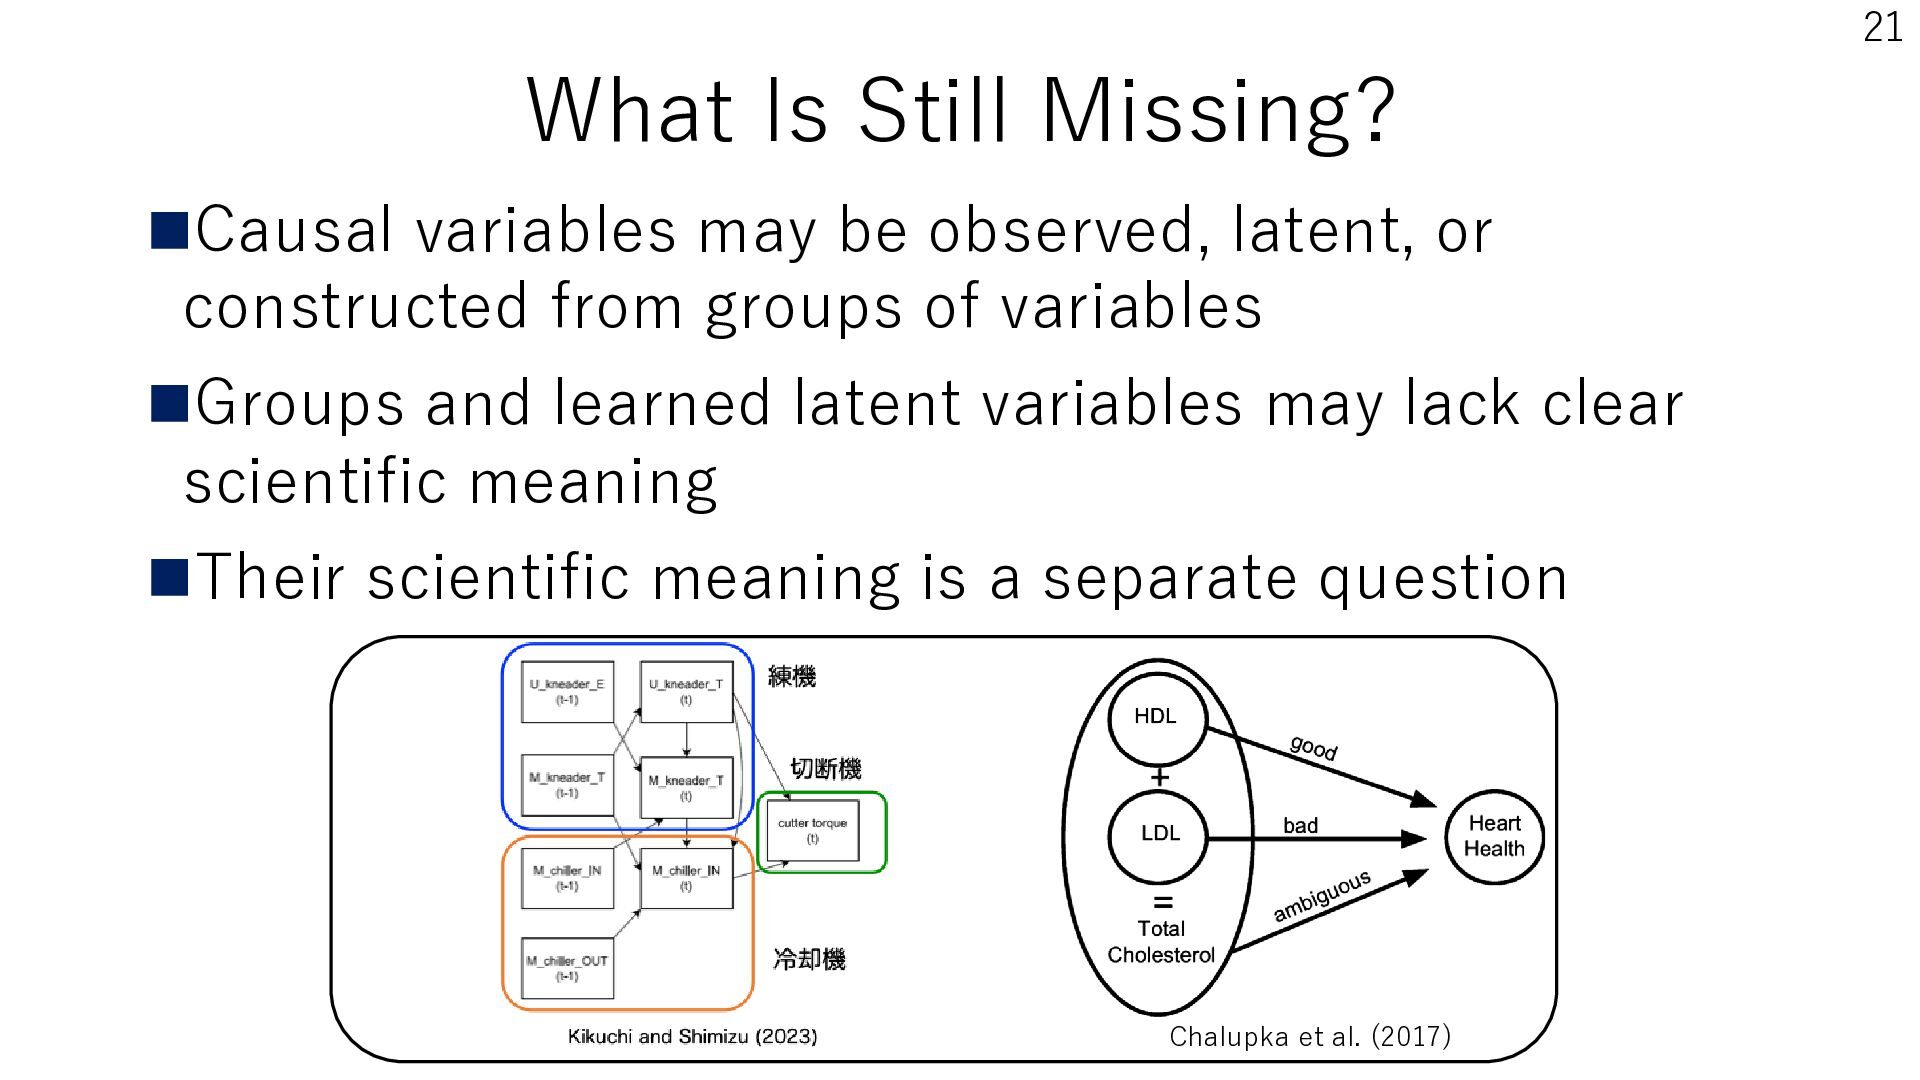
are not always given ◼Too fine: sensor-level ◼Too coarse: total cholesterol ◼Need to discover variables + causal relations kneader cutter chiller Chalupka et al. (2017) 18
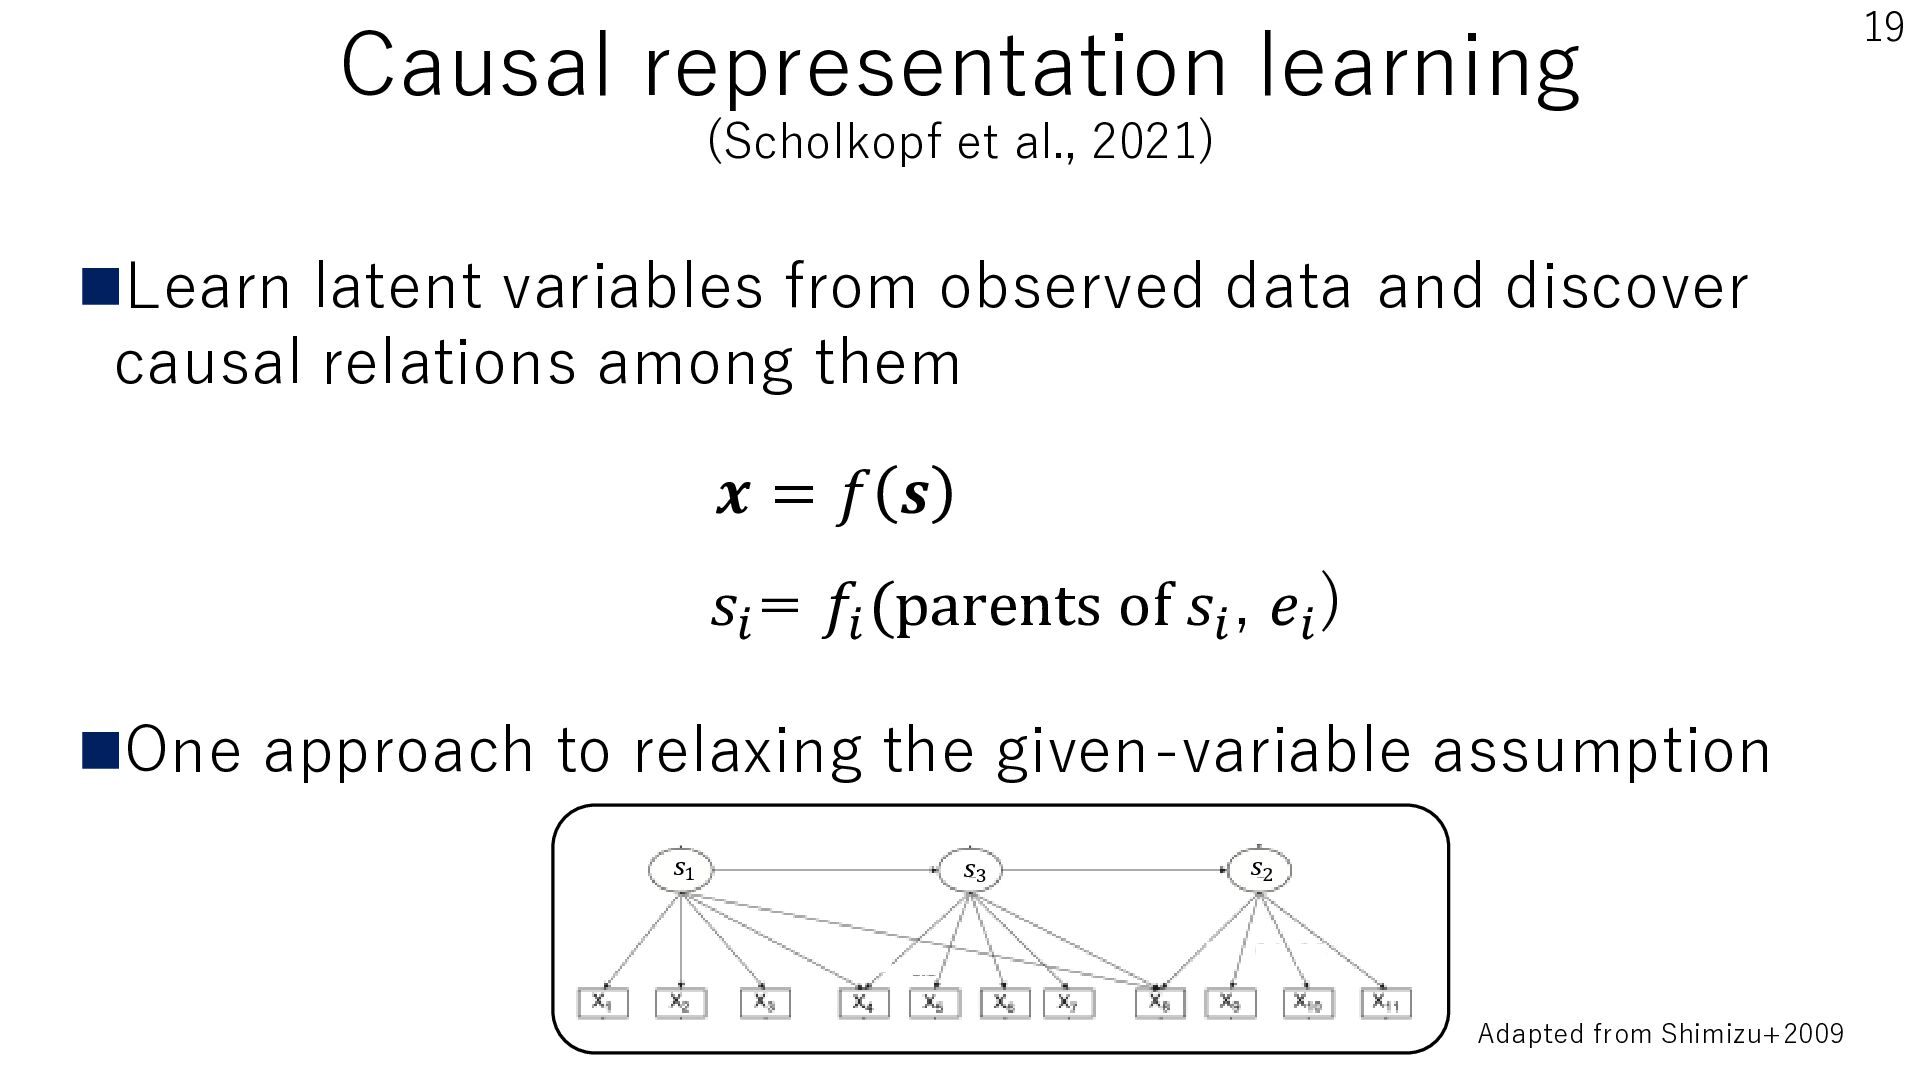
from observed data and discover causal relations among them 𝒙=𝑓 𝒔 𝑠𝑖 = 𝑓𝑖 (parents of 𝑠𝑖 , 𝑒𝑖 ) ◼One approach to relaxing the given-variable assumption 𝑠1 𝑠3 𝑠2 Adapted from Shimizu+2009 19
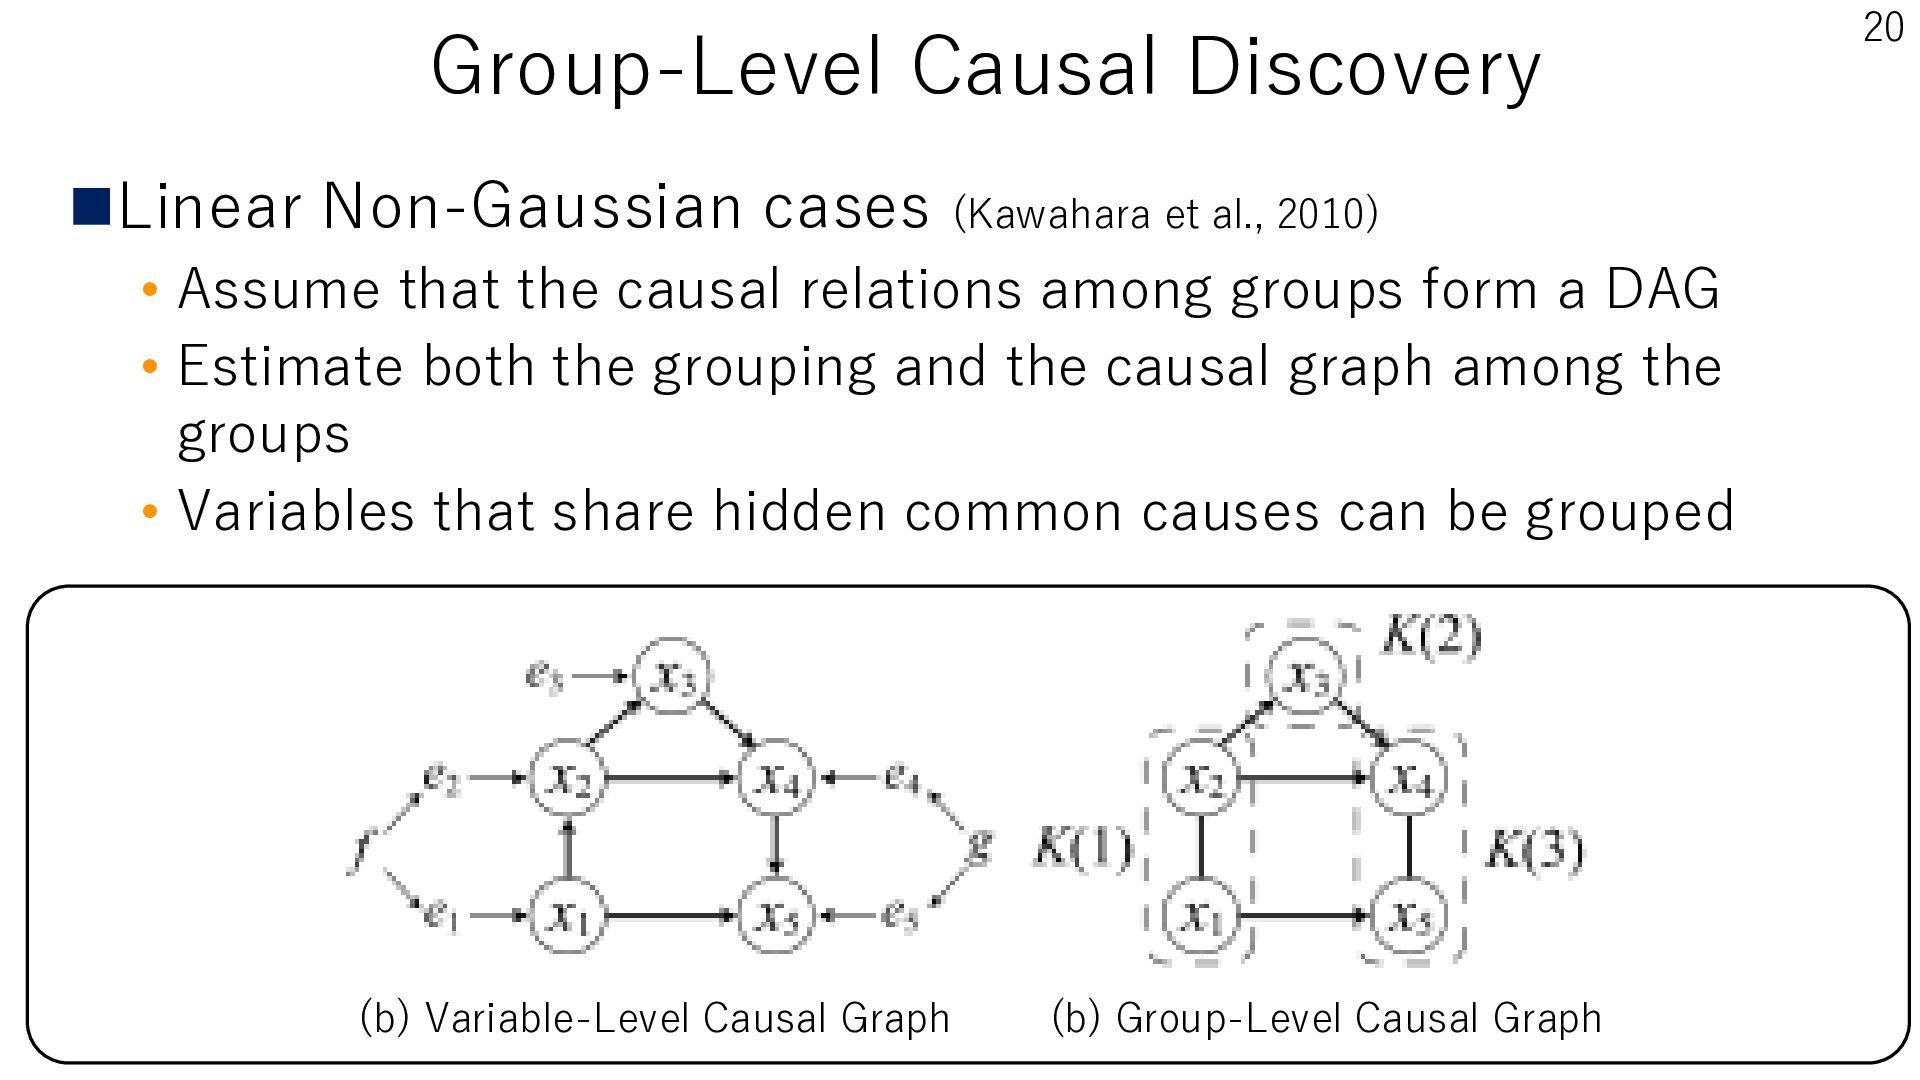
• Assume that the causal relations among groups form a DAG • Estimate both the grouping and the causal graph among the groups • Variables that share hidden common causes can be grouped (b) Variable-Level Causal Graph (b) Group-Level Causal Graph 20
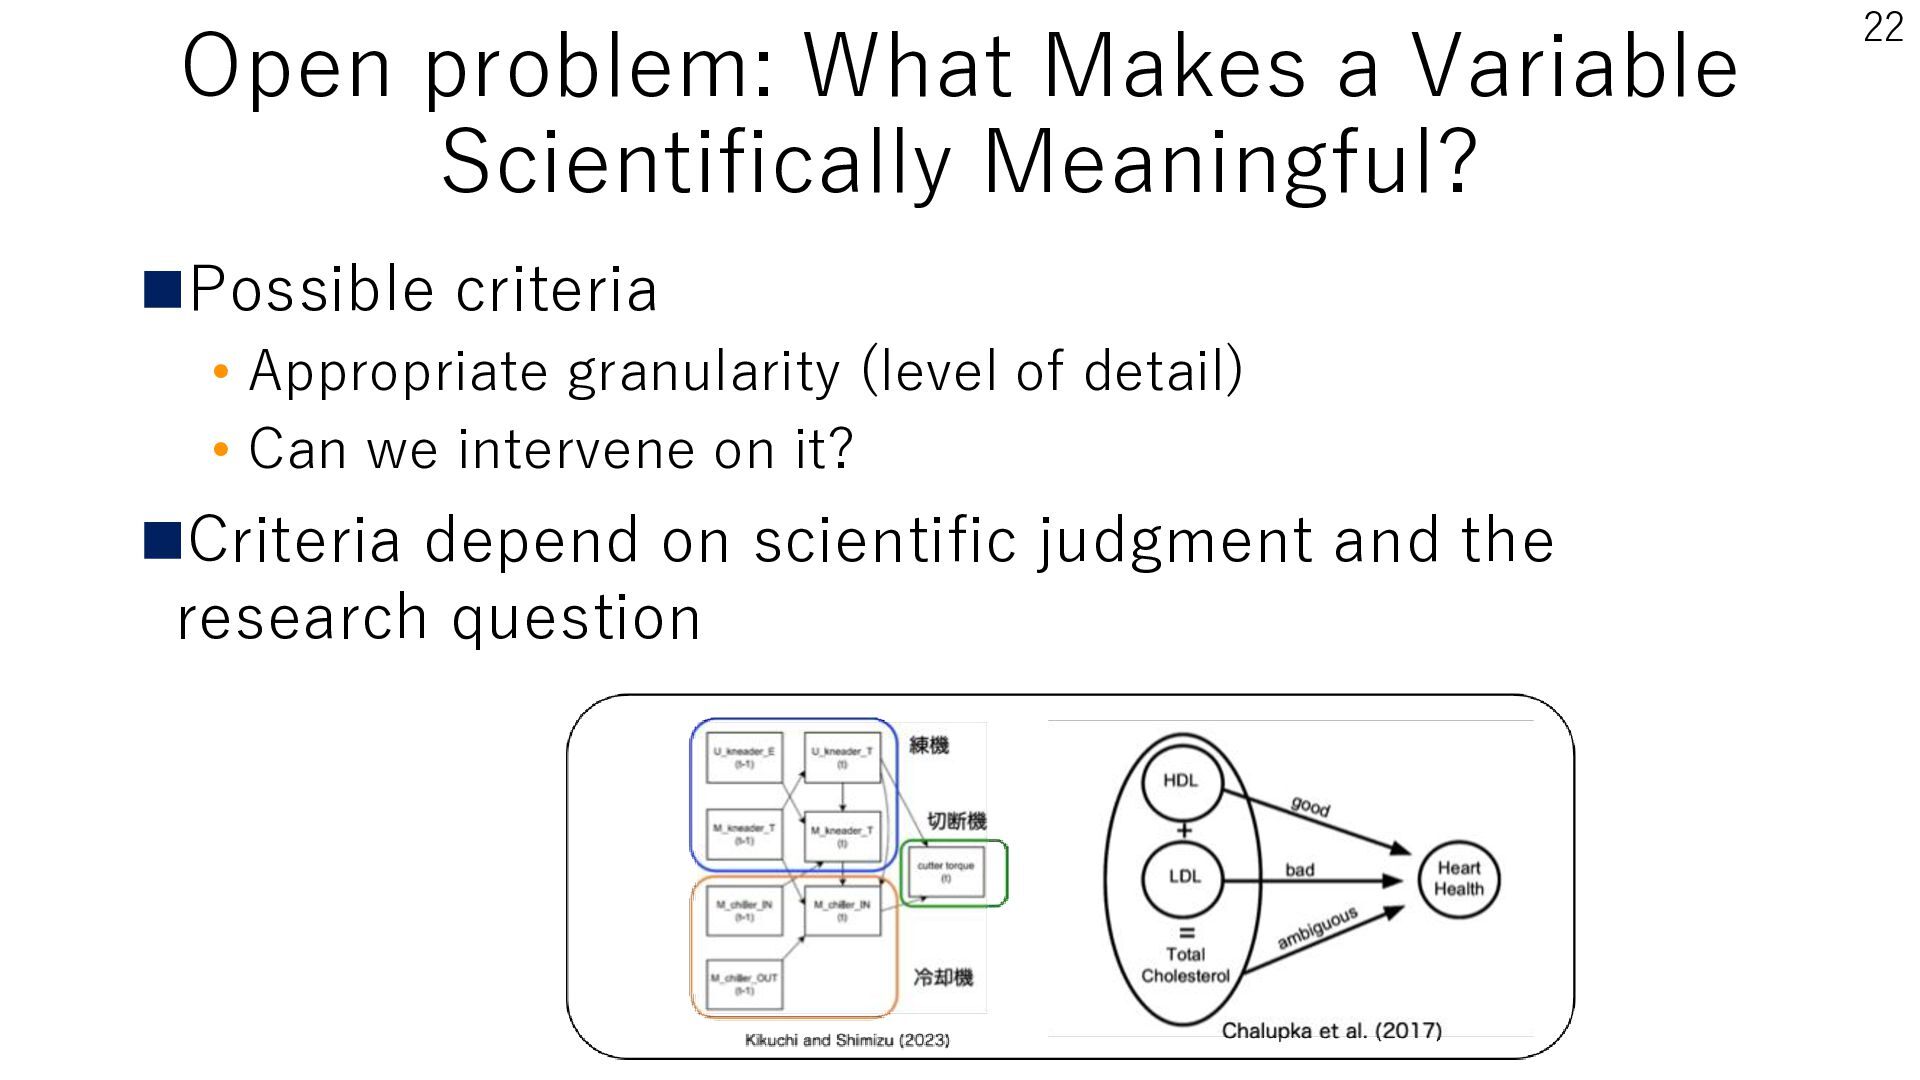
latent, or constructed from groups of variables ◼Groups and learned latent variables may lack clear scientific meaning ◼Their scientific meaning is a separate question Chalupka et al. (2017)
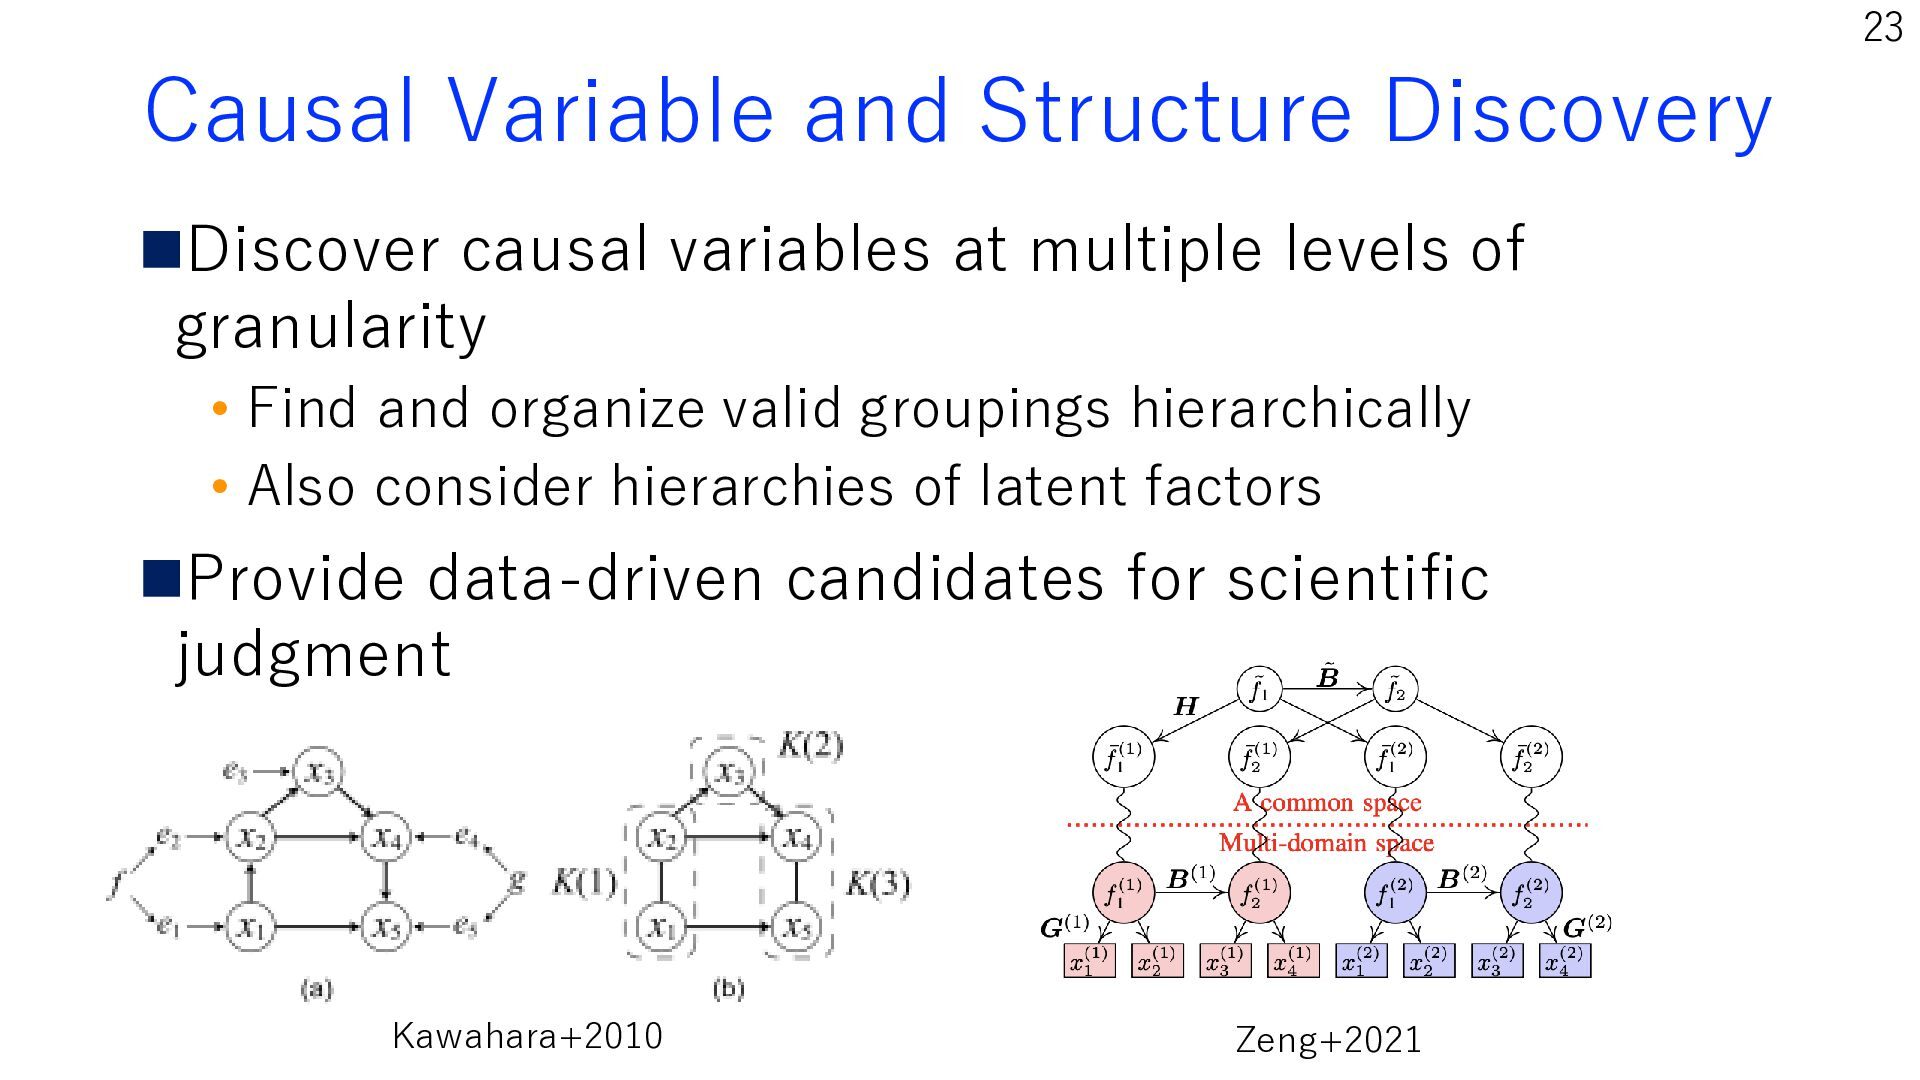
multiple levels of granularity • Find and organize valid groupings hierarchically • Also consider hierarchies of latent factors ◼Provide data-driven candidates for scientific judgment Kawahara+2010 Zeng+2021
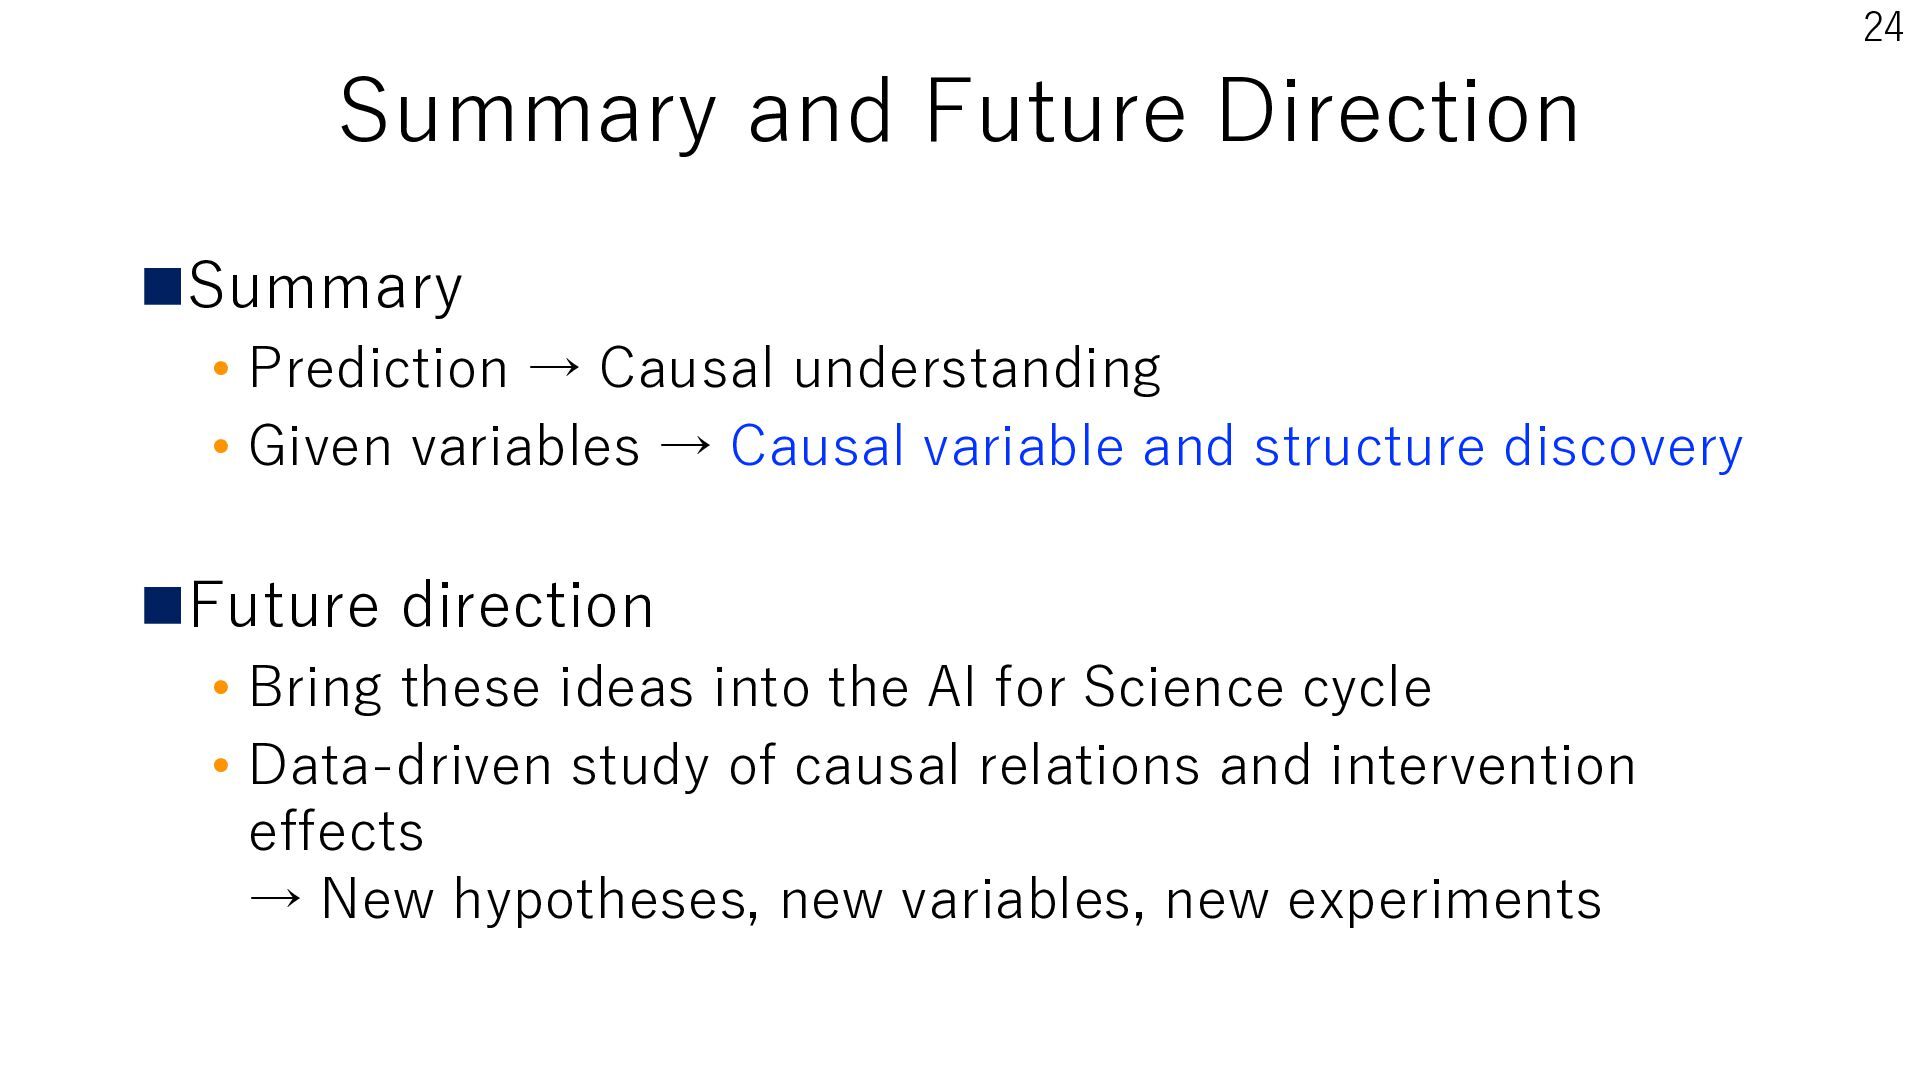
understanding • Given variables → Causal variable and structure discovery ◼Future direction • Bring these ideas into the AI for Science cycle • Data-driven study of causal relations and intervention effects → New hypotheses, new variables, new experiments


 sshimizu2006
 jarvist
 martinlippert
 institutdelelevage
 i2tsuki
 trycycle
 neutron63zf
 hayashiyus884
 nozakijcom
 shumpei777
 tagtag
 brainpadpr
 techseoconnect
 reverentgeek
 scottboms
 lfama
lfama
 chrislema
 kastner
 chriscoyier
 danielanewman
 427marketing
 tenderlove
 hannesfritz